Share your thoughts
placeholder
Article
Claude just produced the first computer-checked proof of Fermat's Last Theorem, working largely on its own for 11 days.
It wrote 13 million lines of Lean and proved 29,500 intermediate theorems. Full proof is on GitHub.
Would you trust an AI-checked proof more than a year of human referees?
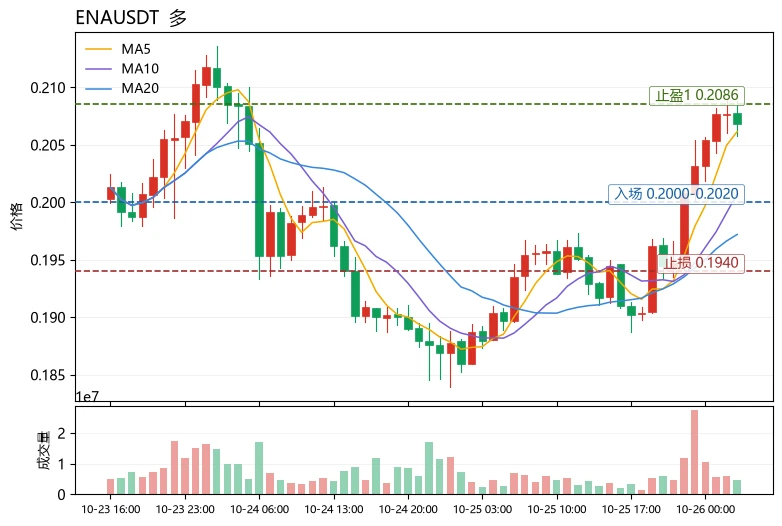
$USELESS Signal】Go long on 1H EMA20 pullback + 4H trend intact
$USELESS RSI1H 56.27, 1H MACD bearish bars expanding, with the price at 0.238 above EMA20. 4H MACD bar 0.0083, 4H RSI 77.58; trend-side momentum remains strong, but short-term profit-taking needs to be absorbed. Order book imbalance is 0.59, with notably heavy sell orders above; funding rate is 0.047%, with no signs of overheating.
🎯Direction: Long
⚡Entry/limit order: 0.2373458 - 0.2380600
🛑Stop-loss: 0.2356794
🚀Target 1: 0.2416309
🚀Target 2: 0.2434164
🛡️Trade management: - Execution strategy: After reaching Target 1, reduce
post-image
USELESS+33.06%
BTC-2.13%
ETH-2.11%
SOL-3.11%
Why is everyone long $H /USDT while the 4h chart screams 95% short conviction?

$H /USDT - SHORT

Trade Plan:
Entry: 0.07975 – 0.08055
SL: 0.08400
TP1: 0.07726
TP2: 0.07534
TP3: 0.07246

Why this setup?
- Daily trend is bearish, and the 4h signal just armed a SHORT at 0.08015 with 95% confidence.
- RSI 15m at 44.53 shows zero momentum to the upside—weakness is the story.
- Targets are stacked: TP1 0.07726 (-3.6%), TP2 0.07534 (-6%), TP3 0.07246 (-9.6%).
- Invalidation sits at 0.08400, but the alt-long setup needs a break above 0.08304—that’s a trap door, not a ladder.
- Why now? Pri
H+1.67%
$UAI Signal】Long + 1H momentum continuation/buy-side order book dominance
$UAI Funding rate 0.0383%, OI stable, bid-side depth imbalance at 12.09%, with short-term bulls in control. The 1H MACD bullish histogram is shrinking, while the 4H MACD maintains a bullish crossover. The current price is pinned above EMA20, and the short-term structure remains intact.
🎯Direction: Long
⚡Entry/limit order: 0.480355 - 0.481800
🛑Stop-loss: 0.476982
🚀Target 1: 0.489027
🚀Target 2: 0.492640
🛡️Trade management:
Reduce the position by 50% upon reaching Target 1, and move the stop-loss up to breakeven. If t
post-image
UAI+42.87%
BTC-2.13%
ETH-2.11%
SOL-3.11%
Many people who fish always like to crowd into the busiest fishing spots, unaware that the big fish often hide in corners no one visits. Not long ago, $SPCX was like a fish lurking in deep water, circling back and forth within a range every day, wearing down so many anglers that they packed up and left to chase the market’s hot coins instead.
During this period of sideways trading, changes were quietly taking place beneath the surface. Selling pressure gradually subsided, while many smart-money players had already quietly cast their lines and laid in wait, and interest in the sector also bega
post-image
SPCX-1.16%
BTC-2.09%
ETH-2.08%
XAUT just printed a 4h signal most gold bugs will call fake — but the math says otherwise.

$XAUT /USDT - SHORT

Trade Plan:
Entry: 4420.2 – 4430.2
SL: 4472.8
TP1: 4389.5
TP2: 4365.7
TP3: 4329.9

Why this setup?
Why now? The 1D range isn't respecting 4425 as support — it's acting as resistance. RSI on 15m sits at 47.2, meaning no oversold bounce fuel left. ATR (19.8) confirms enough volatility to travel the full 55-point path to TP1. Target stack is clean: 4389 → 4365 → 4329. Invalidation sits at 4465, just 40 points above entry — asymmetric risk/reward favors the short.

Debate:
Are you f
XAUT-0.93%
I was just about to go rant on the forum, but then I saw my balance and thought, never mind—the market is always right. During the repeated intraday swings, $SKR fell just short every time it tried to push higher, and the volume never followed through. It clearly had a strong bull-trap vibe. My thinking was crystal clear at the time: follow in directly around 0.012992, no hesitation. Now at 0.021592, +1304.32% secured—the timing was just right. The early phase was genuinely sluggish, but the breakout feels genuinely sweet. Take 70% off first; don't get greedy for the last bit. Move the stop-lo
post-image
SKR+11.29%
BTC-2.09%
SNDK+11.97%
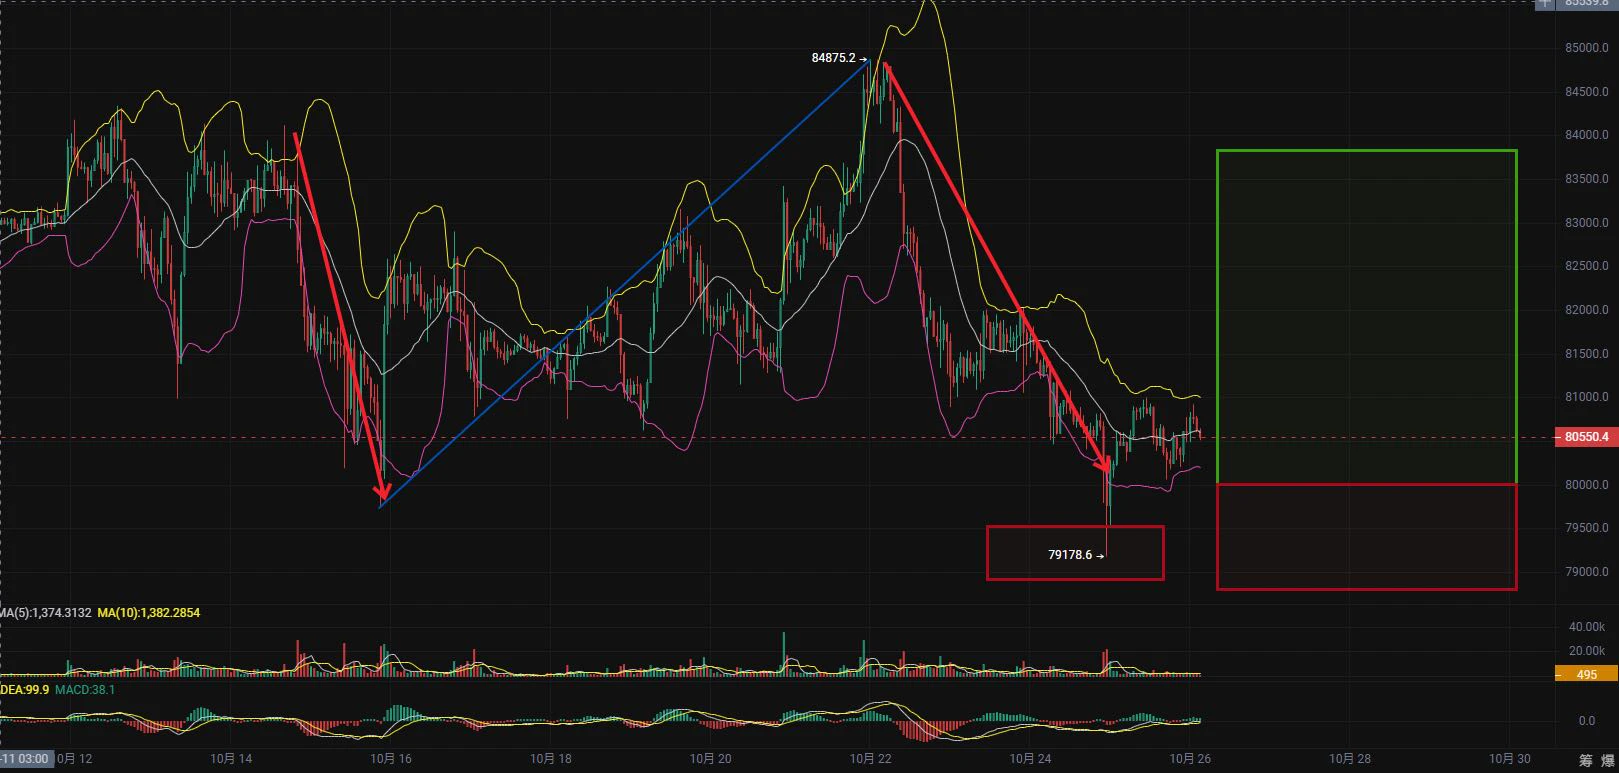
$BTC Signal】Long + order-book support and 1H short contraction
$BTC The order-book bid depth ratio is 3.85, with very thick buy orders below; 1H short momentum is weakening, and the price has rebounded from 78618 to 79548. The 1H MACD bearish bars are contracting, while the 4H MACD bullish structure remains intact, with the bars narrowing. Trading volume shrank from 94628 to 12502, indicating selling pressure has been exhausted. RSI 1H is 44.69, neutral to weak but not out of control.
🎯Direction: Long
⚡Entry/limit orders: 79309.855 - 79548.500 (directly target an entry near the current price
post-image
BTC-2.09%
$SUI is at a key 4H decision zone around $0.759.
➜ Support: $0.74–$0.75
➜ Major demand: $0.70–$0.72
➜ Resistance: $0.78–$0.80
➜ Major supply: $0.83–$0.85
Holding $0.74 and reclaiming $0.80 could open the way toward $0.83–$0.85. Losing $0.74 puts $0.70–$0.72 back in focus.
For now, I’d rather wait for confirmation than chase the middle of the range.
#SUI
post-image
SUI-4.20%
  • 3
  • 2
【$Q Signal】Long | 1H Order Book Imbalance and Price Holding Steady
$Q Order book imbalance -16%, Bid/Ask 0.72, price holding steady at 0.0268. The 1H long upper wick touched 0.02917 before pulling back; RSI 1H 71.47/4H 69.16, MACD expanding on 4H and contracting on 1H.
🎯Direction: Long
⚡Entry/Limit Order: 0.02671761 - 0.02679800
🛑Stop-Loss: 0.02653002
🚀Target 1: 0.02719997
🚀Target 2: 0.02740096
🛡️Trade Management:
- Execution strategy: After reaching Target 1, reduce the position by 50% and move the stop-loss up to the breakeven level. If the price falls back to the entry level, exit auto
post-image
BTC-2.13%
ETH-2.11%
SOL-3.11%
I didn’t do anything—just went to the restroom, and when I came back, the K-line had already done the work for me. During the intraday plunge, $COLLECT pulled back to a key level, with buying support clearly strengthening. I immediately judged that this was a fake drop, not a real decline. I flagged it once around 0.06495, and now at 0.08095, +488.74% has been realized on cue—feels really great. Experts die trying to catch the bottom, retail traders perish chasing orders, and smart people live in the present. Let me say it again about position management: Take 80% off the table first, and prot
post-image
COLLECT+1.55%
DOGE-4.27%
LAB-0.27%
I only meant to snag a free breakfast, but the market ended up serving me six months’ worth of dumplings.
During the intraday bottoming phase, $NVDAX moved sideways around 216.97 for so long I was nearly falling asleep, but there was clearly buying support below and the low-volume sell-off couldn’t push it down. I judged the bottom to be solidified and went long immediately, without hesitation.
I just checked the chart, and the price has already climbed to 230.16, +566.36%. This bite of meat went down nicely—everyone on board should be waking up laughing.
Take 80% off the table first, and mov
post-image
NVDAX+0.62%
ETH-2.08%
DOGE-4.27%
A few days ago, my hand trembled as I set the stop-loss; this morning I realized that filial piety was unnecessary😂. When the price plunged intraday, $SCRT struggled to rebound, with every push upward falling just short. Volume failed to follow, while selling pressure remained genuinely heavy—the signs of a bull trap were unmistakable. I know this kind of market all too well.

Going long in this kind of market is just giving money away, so I went with the trend and opened a short at 0.01082. I just refreshed again, and the current price has already slipped to 0.00765, with unrealized gains a
post-image
SCRT-4.32%
XRP-4.49%
SNDK+11.97%
Beginner Trader - Real Account Live
live-cover
LIVE86
This yield is making me nervous, and I’m worried the market will come to its senses tomorrow and blacklist me. 😂 When I checked the charts after lunch, $NIL made another push, but it clearly lacked follow-through, with shrinking volume and insufficient support. Every surge looked like a test. Seeing this setup, I knew it was a classic bull trap: the key resistance above was substantial, and there would be no one to take it higher. I told my friends right then, don’t chase it—wait until it runs out of steam; that’s our opportunity. Sure enough, it started falling in the afternoon and kept grin
post-image
NIL-0.98%
XRP-4.49%
LAB-0.27%
Crypto Prediction and Trading Insights
live-cover
LIVE251
Hello everyone, this is my account
This is also my
fundamental reason for leaving this world.
post-image
No vision, couldn’t hold on—the profits on this move were paper-thin, but I loved every bit of it. I opened the chart this morning and saw $ORDI grinding sideways all night without ever breaking below 3.960. Bottoming out without breaking down is a classic bullish signal, so I directly called for a long. Now it’s started moving at 3.988, with a +34.07% return. This bite of the trade feels great. It was truly sluggish at first, but once it broke out, it felt amazing. This bite of the trade feels great; staying up late wasn’t in vain. Time to treat myself to a good meal. Position management: Tak
post-image
ORDI-5.29%
LAB-0.27%
ETH-2.08%
Most traders still think XLM is going long—here’s why the 4h chart is screaming otherwise.

$XLM /USDT - SHORT

Trade Plan:
Entry: 0.17888 – 0.17984
SL: 0.18398
TP1: 0.17589
TP2: 0.17358
TP3: 0.17011

Why this setup?
Why now?
- 1D trend is *range*, not bullish—so upside is capped.
- RSI (15m) at 45.7 shows weak momentum, but the 4h bias is SHORT with 55% confidence—a slow bleed, not a crash.
- Price sits at 0.17936, right at the entry ref. TP1 at 0.17589 (-1.9%) is the first magnet; TP2 at 0.17358 (-3.2%) if support cracks.
- The alt (long) setup is invalid above 0.18173—so any pump
XLM-3.89%
NVDA Still Leading The AI Race — Can Bulls Push Higher?
$NVDA is trading around the $230 zone, and this area is becoming very interesting for the next move. After recovering from the recent pullback, Nvidia is showing strength again as buyers continue to defend important levels.
My view is that NVDA remains one of the strongest AI-related stocks because the market is still focused on AI infrastructure growth, data center demand, and Nvidia’s dominant position in advanced chips. Recent momentum has improved as investors regain confidence in the AI sector.
From a technical perspective, holding
post-image
NVDA+0.87%
Load More

Join 40 M users in our growing community

⚡️ Join 40 M users in the crypto craze discussion

💬 Engage with your favorite top creators

👍 See what interests you

View More