Square
Following
Hot
News
Notifications
Profile
Share your thoughts
placeholder
Article
The most dramatic moment in the struggle for AI computing dominance has arrived: Jensen Huang, who ruled the GPU empire for more than three decades, did not lose to a competitor. Instead, he handed over power in haste within a matter of days amid a personal relationship scandal and a compliance storm.

On November 12, Nvidia officially announced that Huang had resigned as CEO, president, and director, effective immediately. CFO Colette Kress will take over as interim chief.

When we piece together the timeline disclosed by multiple media outlets over the past week, it becomes clear that this w
post-image
NVDA-0.42%
market update on gate
live-cover
LIVE1,322
Trenches
GTAVI
G
bade
b
GTAVI
ERiM...pump
Market Cap
$.
Change
.
24h Vol
$
Holders
.
mihao
m
bade
b
mihao
4Cxj...pump
Market Cap
$.
Change
.
24h Vol
$.
Holders
.
BLOB
B
bade
b
BLOB
8s11...pump
Market Cap
$.
Change
.
24h Vol
$.
Holders
.
CLAUDIA
C
bade
b
CLAUDIA
2j5S...W2ZM
Market Cap
$.
Change
.
24h Vol
$.
Holders
.
GTA6
G
bade
b
GTA6
4kjr...zDnz
Market Cap
$.
Change
.
24h Vol
$.
Holders
.
$BREV It's always like this with the most profitable coin: don't expect it to keep falling for long. Everything goes down and up, but it's number one, and its rapid moves are always upward by a significant percentage
post-image
BREV+7.05%
#NasdaqDrops2.5%SanDiskFalls8% #ShareWeekly

Which Chip Stock Has the Strongest Recovery Potential After the Latest Market Crash?

The semiconductor market is facing another major test. On November 16, the Nasdaq dropped 2.49%, while SanDisk (SNDK) suffered a decline of more than 8%. Nvidia (NVDA) also remained under significant selling pressure as investors reassessed the future of the AI industry.

In my view, the most important question is not which stock has fallen the most, but which company has the strongest business foundation to recover when market sentiment improves.

I would focus o
NVDA-0.42%
SNDK-1.36%
NAS100-0.07%
  • 1
Strategy is sitting on $9.6 billion in unrealized losses, yet MSTR shareholders are even more nervous! Bitcoin going up doesn’t necessarily mean the stock will make money, does it?

Many people buy MSTR stock because they think it’s essentially a leveraged version of Bitcoin.
This view has some merit, but it can also lead to misconceptions.
Strategy holds a large amount of BTC, so its share price is usually affected by Bitcoin market movements. However, MSTR is not the same as spot Bitcoin.
It also involves share issuance, preferred stock, debt financing, company operations, and capital market
MU-0.84%
  • 16
post-image
BTC-0.65%
GT-2.24%
ETH-1.23%
SOL-0.74%
BREAKING 🚨No Network November erupts as a wave of cyberattacks slams major tech and finance firms ⚡.Since Nov 2, outages and hacks have crippled Apple, Microsoft, US airline systems, Chase, Bank of America, Wells Fargo, the NSA and 178 other sites including CNN and Zoom 📉. The cascade threatens global digital infrastructure and could stall financial transactions. Regulators are scrambling to contain the breach.Stay tuned for updates.$BREV , $MMT , $BREV
post-image
BREV+7.05%
MMT-2.35%
Meeting my online date in person— is it still not too late to run?
I’ll never trust another pretty girl I meet online again😂
Short $ZEC ‼️The rejection signal at the main 2-hour resistance zone looks strong, and sellers are actively applying pressure—expect a pullback to the local support zone. Entry: 945 - Current Price Take Profit: 860 Stop Loss: 1,033 Trade here $ZEC 👇
post-image
ZEC+1.16%
📉 Stocks Slide: Which Stock Could Hold Up Best in a Falling Market?

The US stock market is facing another challenging moment. The Nasdaq has fallen around 2.5%, while the S&P 500 has dropped approximately 1.9%. This decline has created fresh concerns among investors. At the same time, some defensive stocks are showing better strength and attracting attention.

When the market starts falling, investors usually become more careful. They begin to think about protecting their money instead of taking unnecessary risks. Technology stocks can offer strong growth opportunities, but they can also fac
post-image
NDAQ-3.16%
SPX500+0.19%
WMT-0.73%
PG-0.80%
JNJ-1.40%
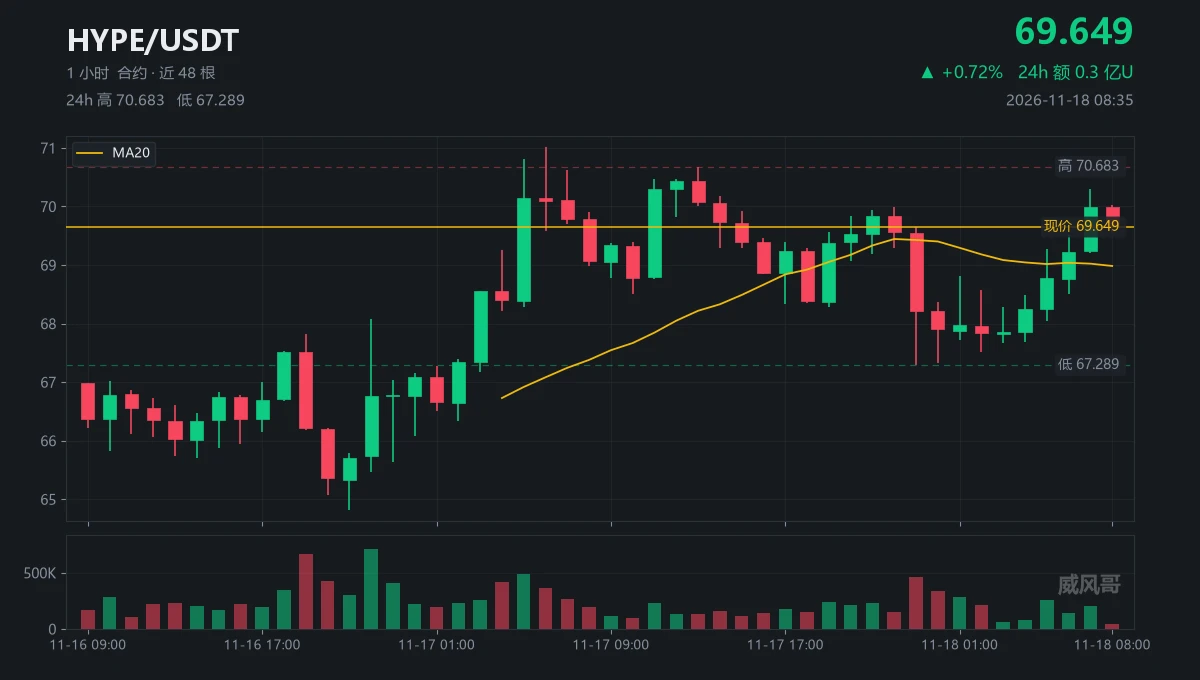
Who saw that 465k-contract candle at 23:00?
I did. Why didn’t I act then?
It had just been swept once at 22:00—was I afraid of a second sweep?
Right. From 67.289 back to 69.649, entering $2.36 late?
If I’m 3.5% late, is there still enough room for the stop loss?
The stop has to be at 68.30 to avoid getting swept, and the upside to 71.018 is only 1.37?
A one-to-one trade—what’s the point?
The 71.018 level overhead was left on 11-17 at 06:00; it hasn’t been touched again in 26 hours?
$HYPE I’ll sit tight and wait for a high-volume close above 71.018, then we can talk if 70.30 holds on a retest.
post-image
HYPE+0.33%
  • 2
  • 2
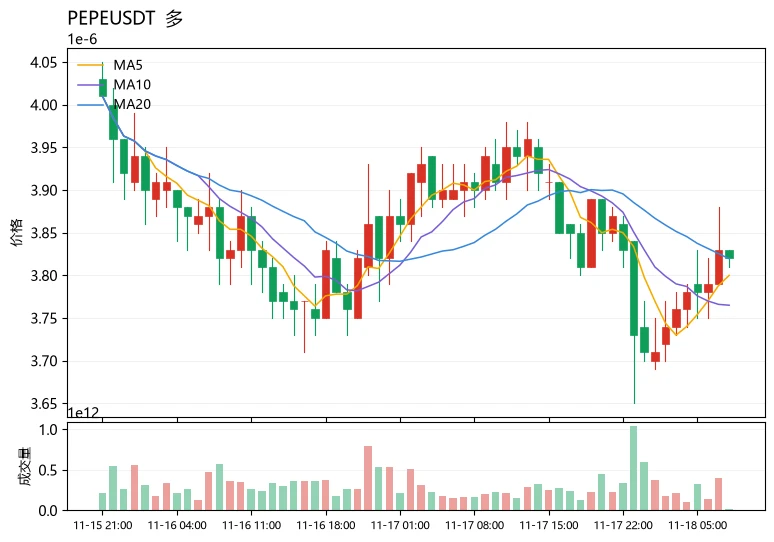
Extreme Fear Index at 11: Which meme-sector token is quietly gaining strength?
The answer is PEPE. Comparing tokens in the same sector: $PEPE is down just 2.30% over 24h, with 27.0M USDT in trading volume, showing clearly greater resilience than $ICP (-7.41%, bearish MACD, funding rate -0.0100%) and $SNXXB$SNXXB (+4.28%, but with a 22.64% amplitude, the most volatile). PEPE is currently at 3.82e-06, with MA5=3.8e-06 closely tracking MA20=3.8195e-06, and the gap narrowing to under 0.5% as the moving averages converge; RSI=49.5 is neutral, the MACD histogram at +4.143e-09 has turned bullish, a
post-image
PEPE+0.97%
ICP-1.14%
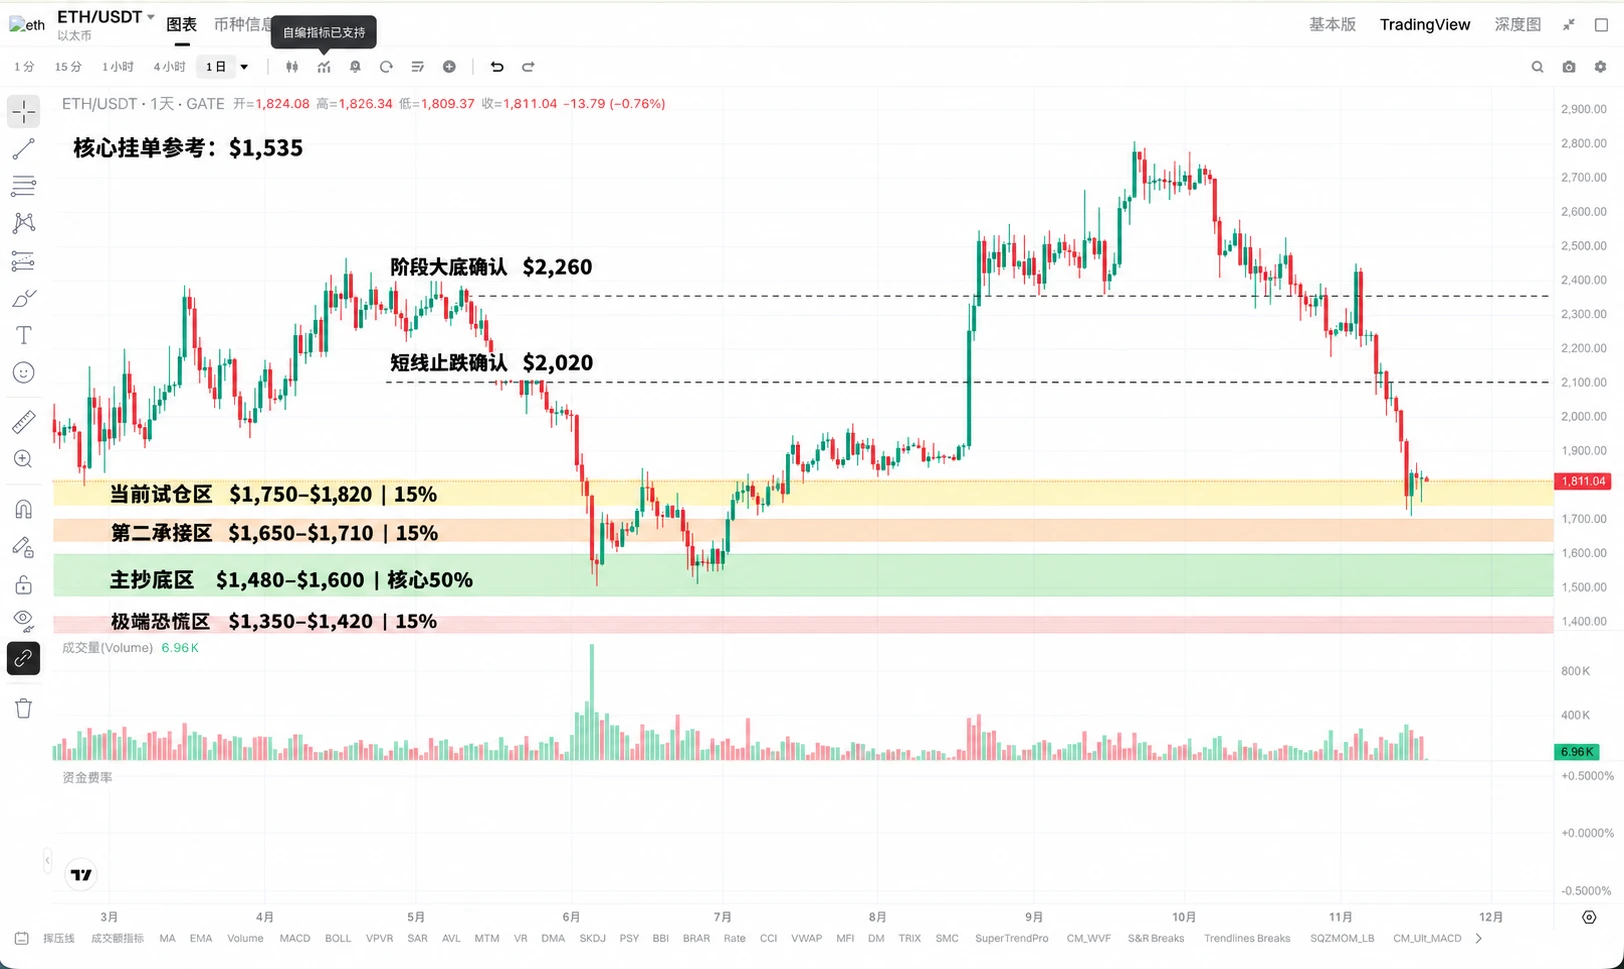
Why not go heavily into position at $1,800 $ETH

Although it is already severely oversold:

* Daily RSI is around 11, in extreme oversold territory.
* Monthly RSI is around 27, entering a long-term undervaluation zone.
* ETH has fallen below its on-chain realized price of around $2,000, leaving the average holder underwater.
* The value of derivatives open interest has fallen about 22% in nearly 30 days, with leverage significantly flushed out.

But the bottom is not yet fully confirmed:

* Funding rates remain slightly positive, with no sustained period of extreme negative rates.
* The long-
post-image
ETH-1.26%
  • 4
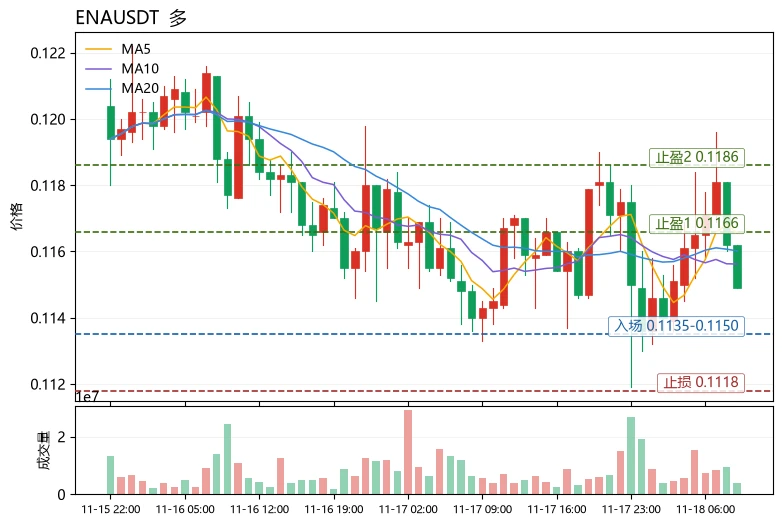
The moving averages are in a bullish alignment, yet the price is hugging the lower Bollinger Band. What does this divergence indicate? The answer: momentum remains, but the short term is in a pullback-and-confirmation phase. $ENA is exactly this kind of setup.
$ENA The current price is 0.1149, with MA5=0.11656 still above MA20=0.11602, so the medium-term moving-average structure remains intact. However, the price has pulled back to around the lower Bollinger Band at 0.113391, which is a pullback within a strong structure rather than a breakdown. The MACD histogram is positive (+9.717e-05), s
post-image
ENA+8.04%
XRP-1.15%
ZEC+1.16%
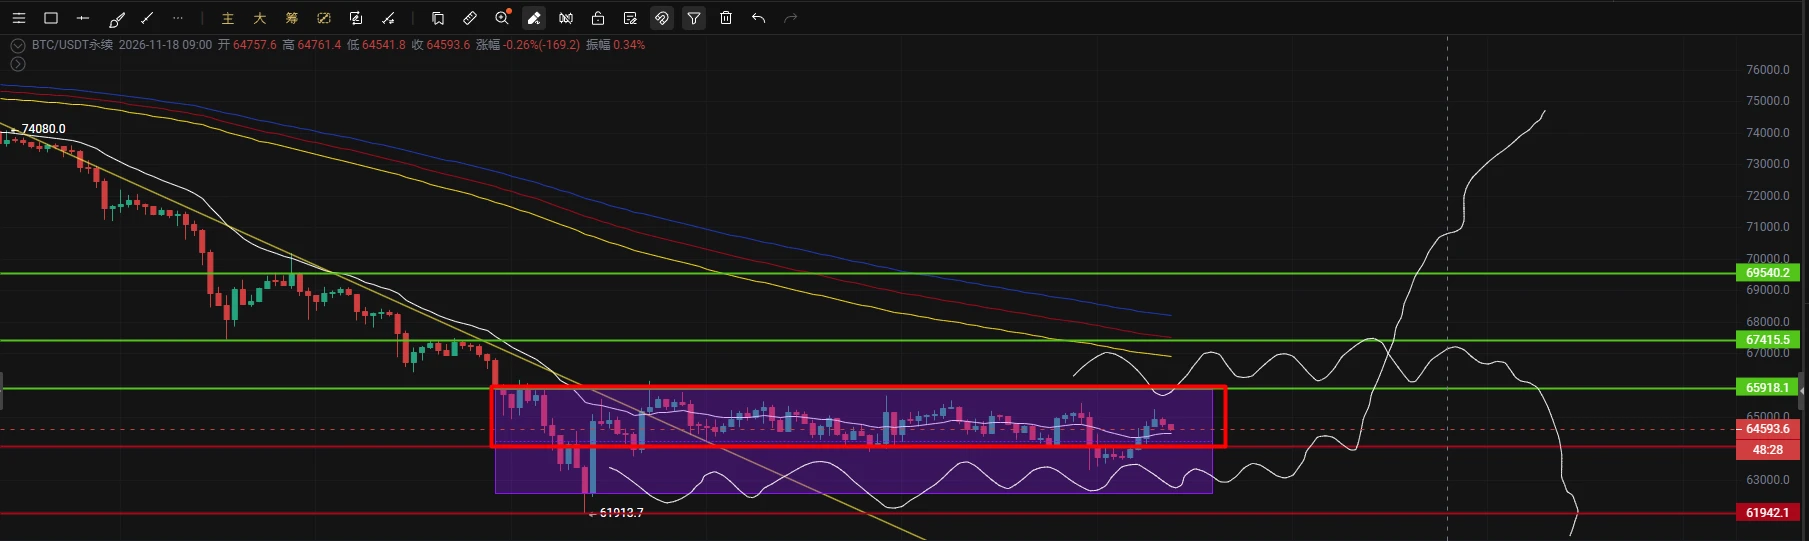
Once a one-way market move has ended, don't worry about the price dropping to 30k or rising to 100k. After each one-way move, the market goes through a range-bound shakeout, with intraday wicks up and down as it recovers. This is the best time to trade: go long on moves up and short on moves down for quick trades. Keep your position size strictly under control and trade within the 62,000–66,200 range. Place stop-losses for short positions above 66,200 and for long positions below 62,000. Keep long entries below 64,000 and short entries above 66,000, and you’ll have a good chance of making mone
post-image
BTC-0.65%
I think I found the next 7 figure runner.
post-image
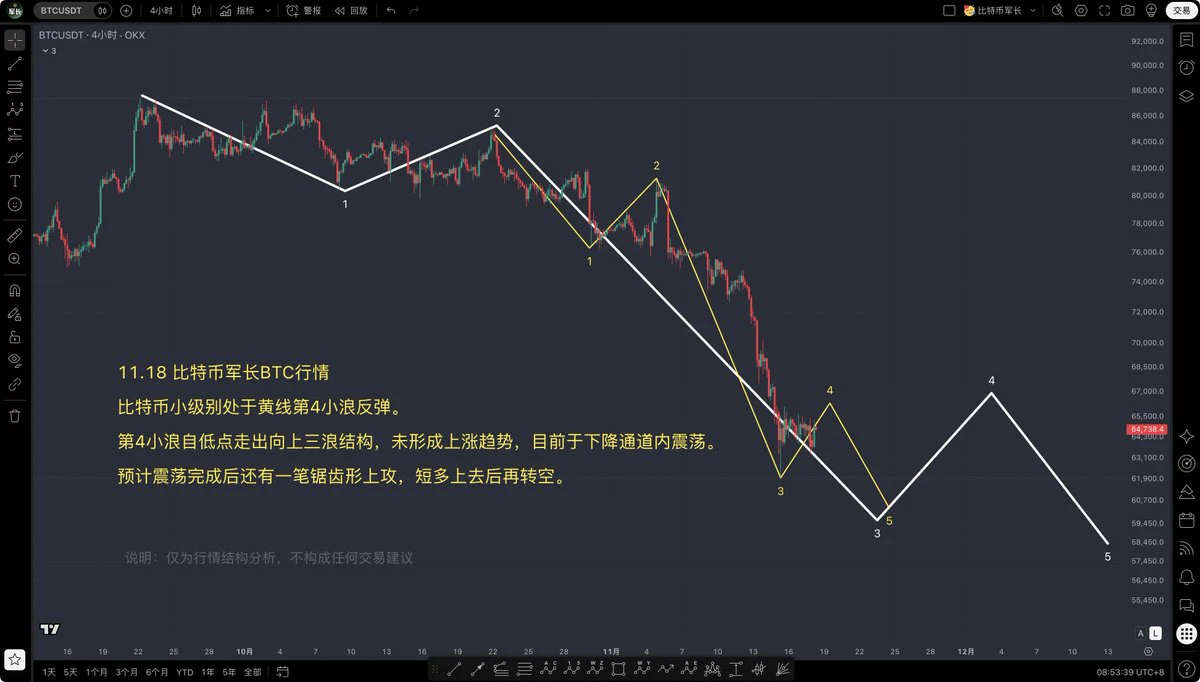
$BTC 11.18 Bitcoin Price Analysis
On the lower timeframe, Bitcoin is in a rebound of the fourth minor wave on the yellow line.
The fourth minor wave has formed a three-wave upward structure from the low, but has not formed an uptrend and is currently fluctuating within a descending channel.
After the consolidation is complete, another zigzag push upward is expected, followed by a return to a short position after a brief move higher.
#BTC走势分析 #比特币走势分析
post-image
BTC-0.67%
  • 1
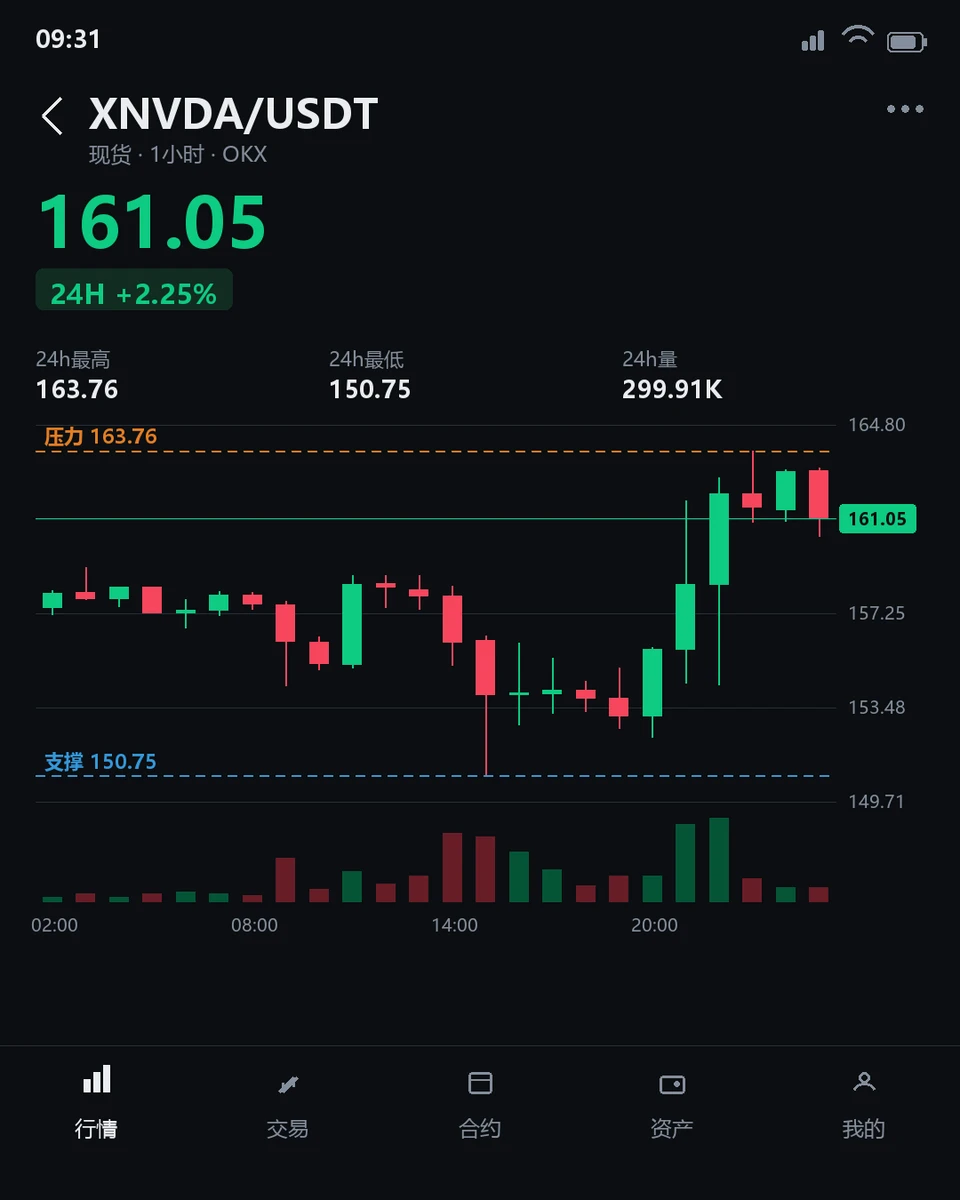
$XNVDA Price Is Up 2.72%, but 1-Hour Trading Volume Is Only 0.43x—How Long Can This Rebound Last?

$XNVDA is currently trading at 161.05, up 2.72% over 24 hours. The price has fluctuated within a range of 150.75 to 163.76. On the 1-hour timeframe, it broke above the 150.75 support level before quickly pulling back, while on the 4-hour timeframe, it remains capped below the 166.94 resistance level. This conflict between a short-term breakout and longer-term resistance is at the heart of the current market action. The 1-hour RSI14 is 57.18, in neutral territory, while the 4-hour RSI14 is only 45
post-image
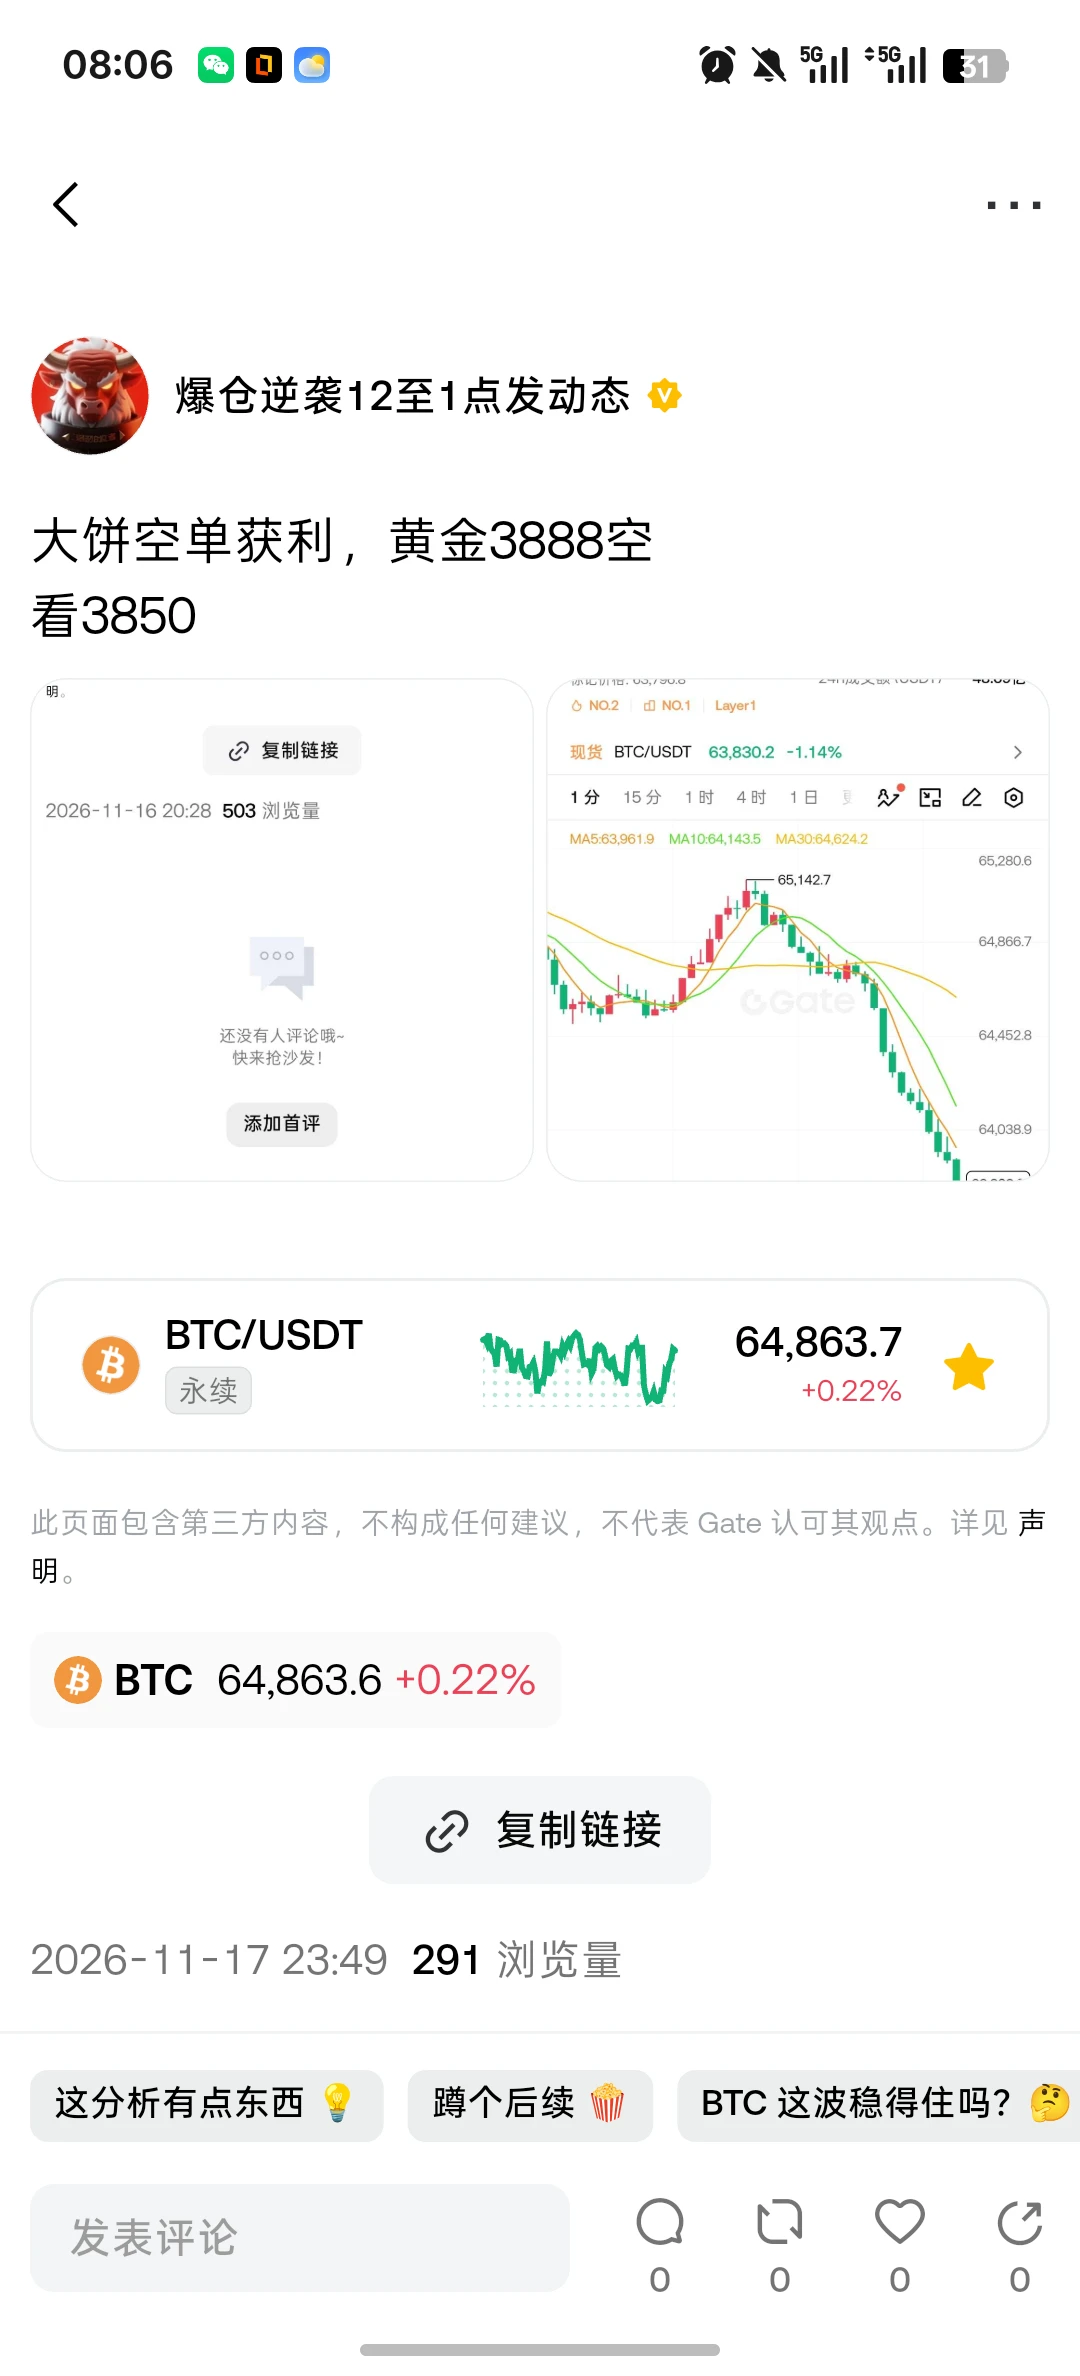
Gold short from 3888 to 3850 hit the target, congrats on the gains
post-image
Load More

Join 40 M users in our growing community

⚡️ Join 40 M users in the crypto craze discussion

💬 Engage with your favorite top creators

👍 See what interests you

Trending Topics

Dr.HanOxfordUnionSpeech

340.8K Views1.7K Discussing

Gate Founder and CEO Dr. Han delivered a “Start Alone” speech at the Oxford Union, reflecting on Gate’s 13-year journey and sharing lessons on resilience, team building, and opportunities in the AI era. He also introduced the “Boss + AI” model, highlighting how AI is reshaping information access, learning, and everyday productivity. What do you think is the most important skill for entrepreneurs in the AI era? [👉 Full Report](https://www.odaily.news/newsflash/534012)

ANTPreMarketFuturesNowLive

426.8K Views3.9K Discussing

NvidiaEarningsInFocus

202.9K Views6.9K Discussing

View More