Square
Following
Hot
News
Profile
Share your thoughts
placeholder
Article
The little girl's cheeks are slightly flushed.
Does she have a fever?😳
post-image
I’ve been watching the charts since the middle of the night, and I can barely keep my eyes open. At least the market has finally stopped acting up and has steadied for now.
Taking a look at the latest position screenshot, I can finally breathe a little easier. That sudden plunge by $SO just now really scared the life out of me. Luckily, buyers stepped in at the lows, keeping it from collapsing outright. I just barely escaped with my skin.
Let’s review how each position is doing after this round of shakeout:
$SOL : Entry price 96.56, current price 95.05, unrealized loss -31.4U (ROI -31.41%). T
post-image
ETH-1.26%
DOGE-0.22%
Trenches
ZIG
Z
bade
b
ZIG
0x8c...1145
Market Cap
$.
Change
.
24h Vol
$.
Holders
.
IDOL
I
bade
b
IDOL
0x3b...ab07
Market Cap
$.
Change
.
24h Vol
$.
Holders
.
Q
Q
bade
b
Q
0xc0...0589
Market Cap
$.
Change
.
24h Vol
$.
Holders
.
STONK
S
bade
b
STONK
6GmA...UNgx
Market Cap
$.
Change
.
24h Vol
$.
Holders
.
GTA6
G
bade
b
GTA6
4kjr...zDnz
Market Cap
$.
Change
.
24h Vol
$.
Holders
.
The AI cash-burning inflection point: Apple “coasts” back to No. 1 in global market cap
At Friday’s close, the crown of the world’s largest company by market cap quietly changed hands: Apple, at $5.03 trillion, overtook Nvidia at $4.93 trillion. Ironically, Apple actually fell 1.2% that day—it won only because Nvidia fell harder, dropping 4.2%.
Behind this is a clear signal: the market is starting to do the math. As investors reassess the returns on AI infrastructure investment, “cash flow” is suddenly carrying much more weight. Alphabet posted free cash flow of -$9.1 billion in the third quar
post-image
NVDA-4.16%
AAPL-1.18%
#BTC大跌
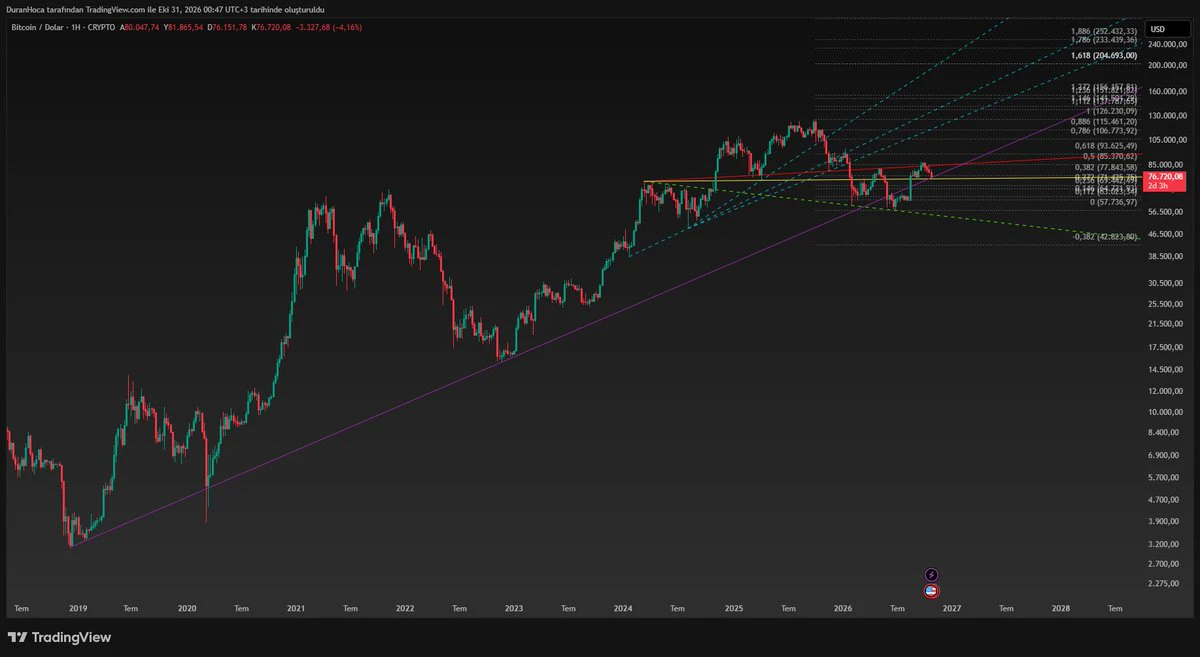
$BTC ‌Bitcoin took a sharp hit today, dropping down toward the $76,000–$77,000 range and pulling down broader market sentiment. The sudden downside move triggered massive flush-outs across derivatives markets, wiping out over $1.5 billion in leveraged positions in just 24 hours.
Heavy selling pressure hit simultaneously across risk assets, compounded by market jitters surrounding exchange security reports and tech stock pullbacks.
While steep pullbacks often trigger immediate fear, they also clear out over-leveraged long positions. Watching key support levels closely right now is crit
post-image
BTC-0.65%
GOOGL-1.32%
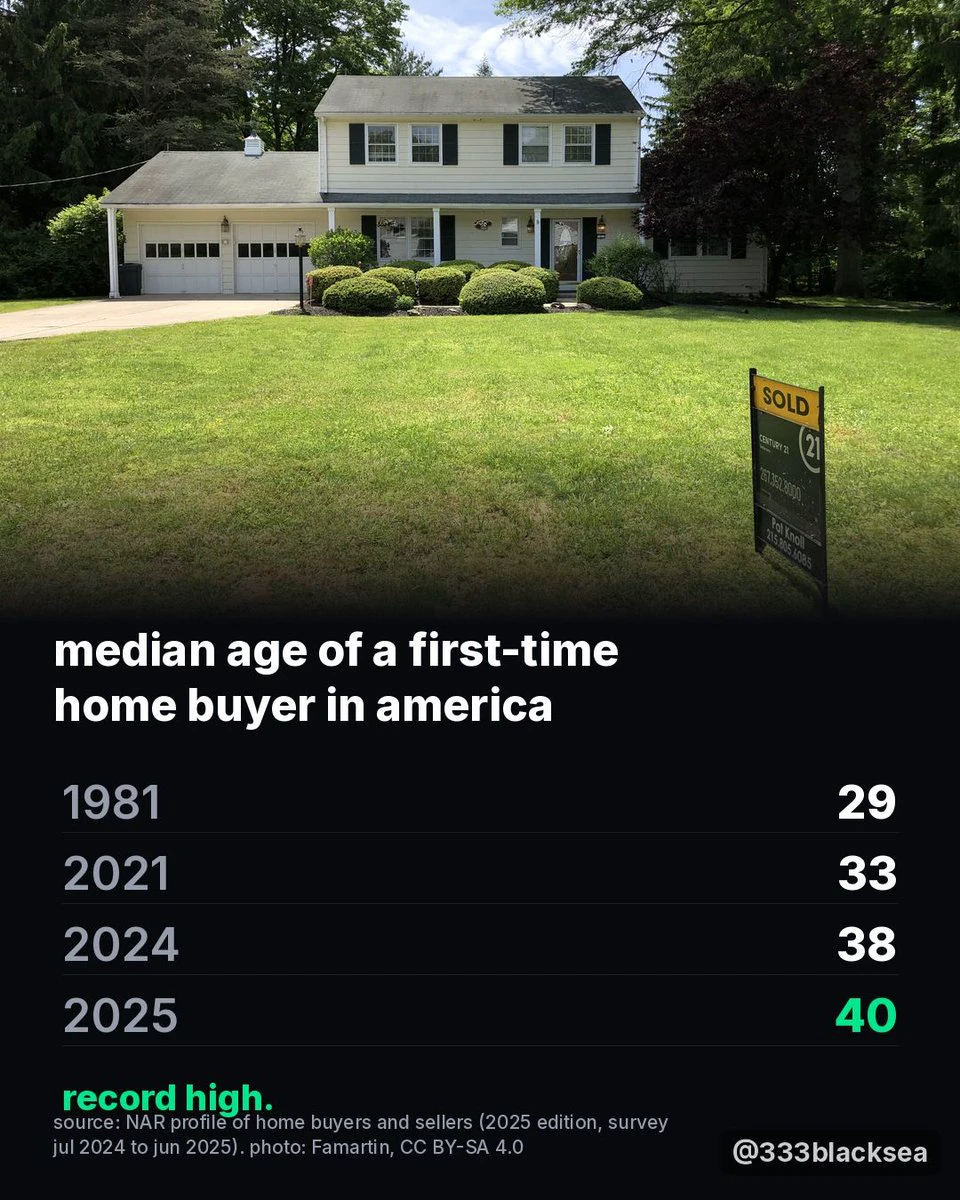
Median age of a first-time home buyer in America:
1981: 29
2021: 33
2025: 40
Record high.
How old were you when you bought your first?
post-image
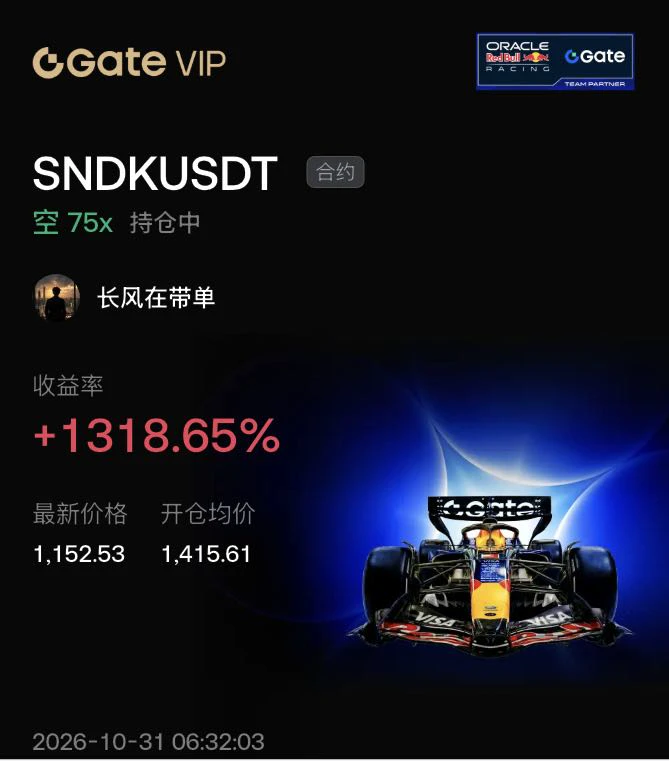
Often, going with the trend is what keeps highly leveraged positions alive.
$SNDK This move from 1415 down to 1152 saw almost no meaningful rebound. This shows the bearish trend is extremely strong. In this one-way downward market, shorting is going with the trend, while going long is catching a falling knife.
“In this market, the trend is your only friend. When the candlesticks form a guillotine-like plunge, even at 75x leverage, if you’re on the right side, the market will make way for you; if you’re wrong, you’re just giving money to the market.”$SNXX #BTC大跌
post-image
SNDK-0.18%
SNXX-0.43%
  • 1
🎃 Gate Live Halloween Special
live-cover
LIVE799
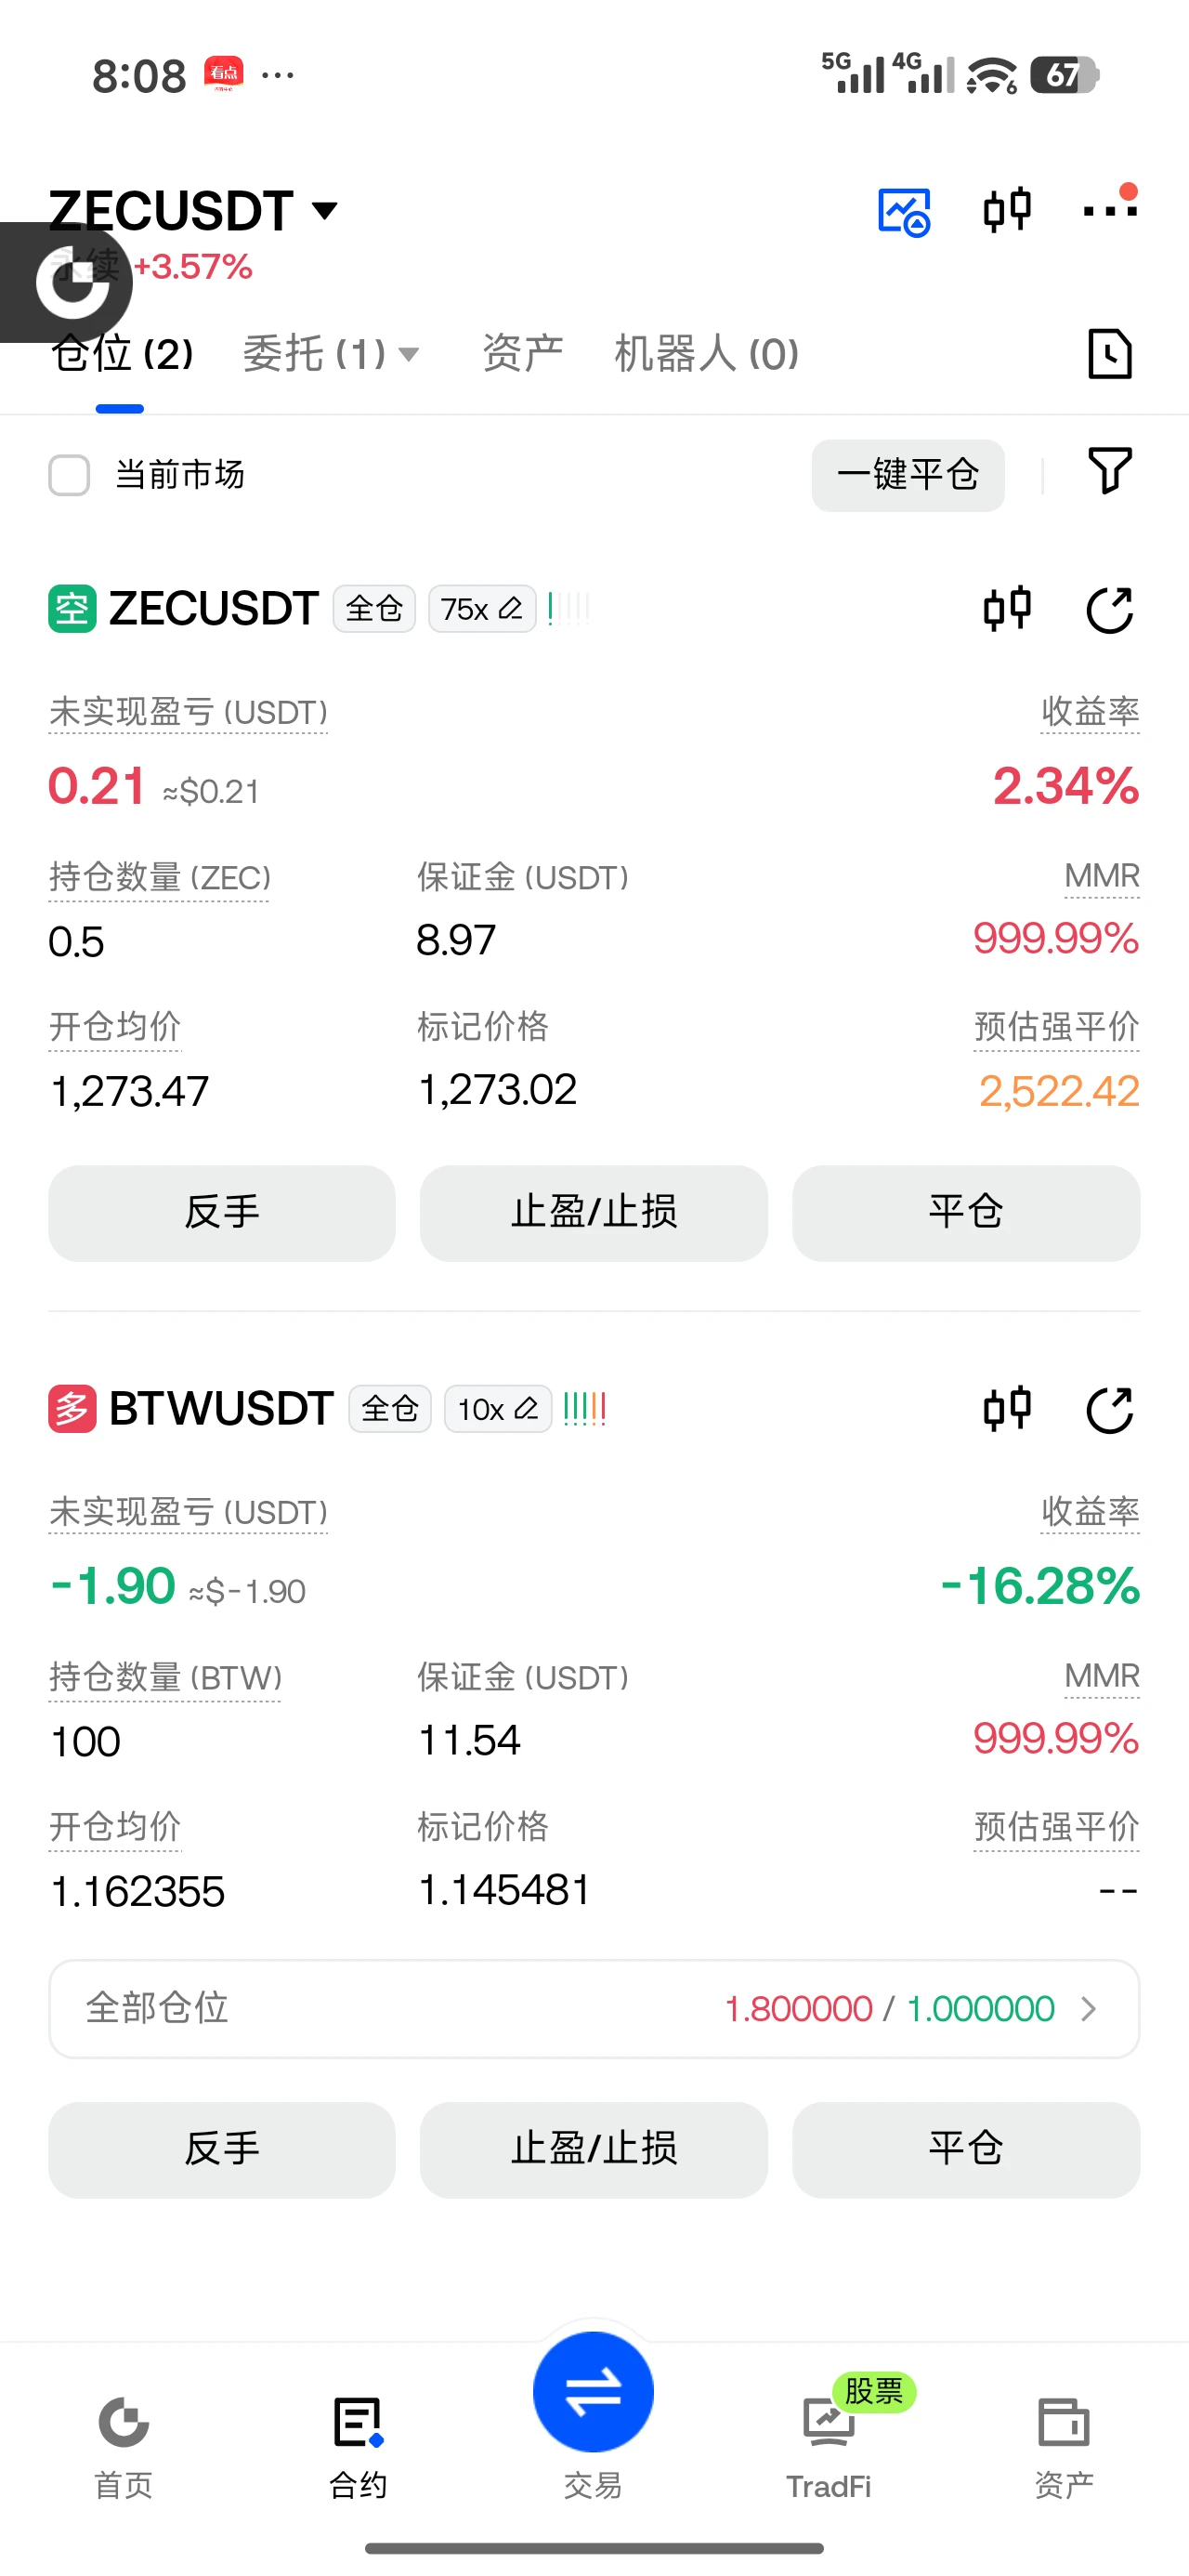
$BTW Take a long position😦 ‌
post-image
BTW-7.42%
I held a gun to Richard Asante's head.
Forced him to watch.
Peeled his eyes back.
Fuck waterboarding, making this guy sit through my lecture is the new form of torture.
post-image
$SOL looks weak near resistance. It will be difficult to continue moving sharply higher without taking a breather first. Take profit: 91.10 Stop loss: 98.88 Hot assets: $BIRB : Current price 0.09252 - 24-hour change: +35.10%$ETH : Current price 2,237.63 - 24-hour change: -1.32%
post-image
SOL-0.77%
BIRB-16.68%
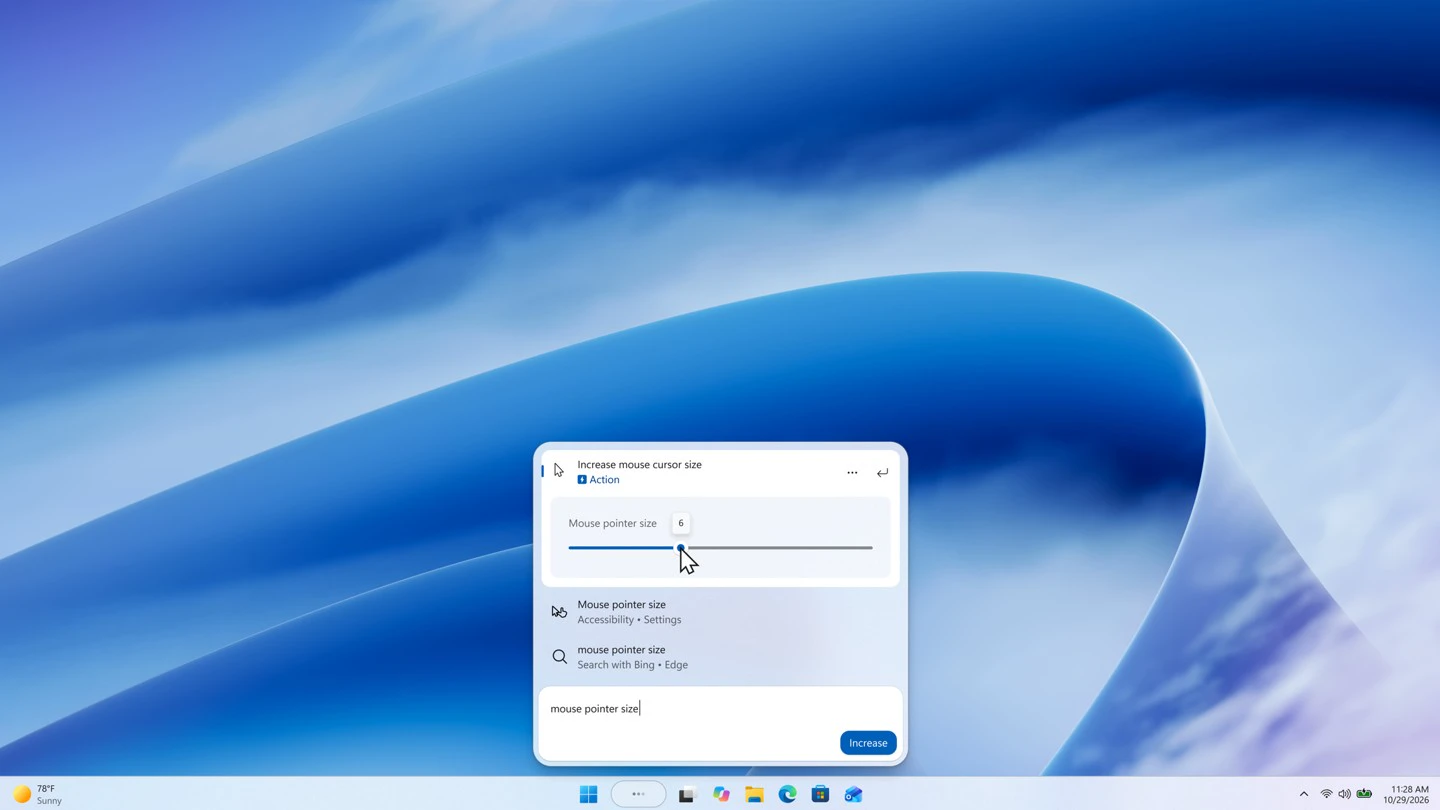
Microsoft lets users adjust brightness and volume directly from the search bar in a Win11 preview build, replacing the traditional Settings entry.
Centralizing controls seems convenient, but the added sliders may make the search bar more complex.
$BTC
#量化达人# Let’s talk about quant trading and market trends. What do you think?
post-image
BTC-0.67%
[NEWSTREAMER] market update
live-cover
LIVE1,096
  • 1
Money is flowing in, but I’m choosing to play it safe first—my asset allocation strategy
Guys, seeing this $57.97 million in net inflows really got me thinking. It shows that although everyone is saying the bear market is here, their actions are telling the truth: they’re moving money to safer places.
In response to this wave of inflows, my strategy on Gate over the past few days has been simple: adjust my positions, cut the weak and keep the strong, focus on defense, and absolutely avoid blindly using leverage.
In the past, when I saw inflow data like this, my first thought was, “Is a big ral
GT-2.41%
  • 1
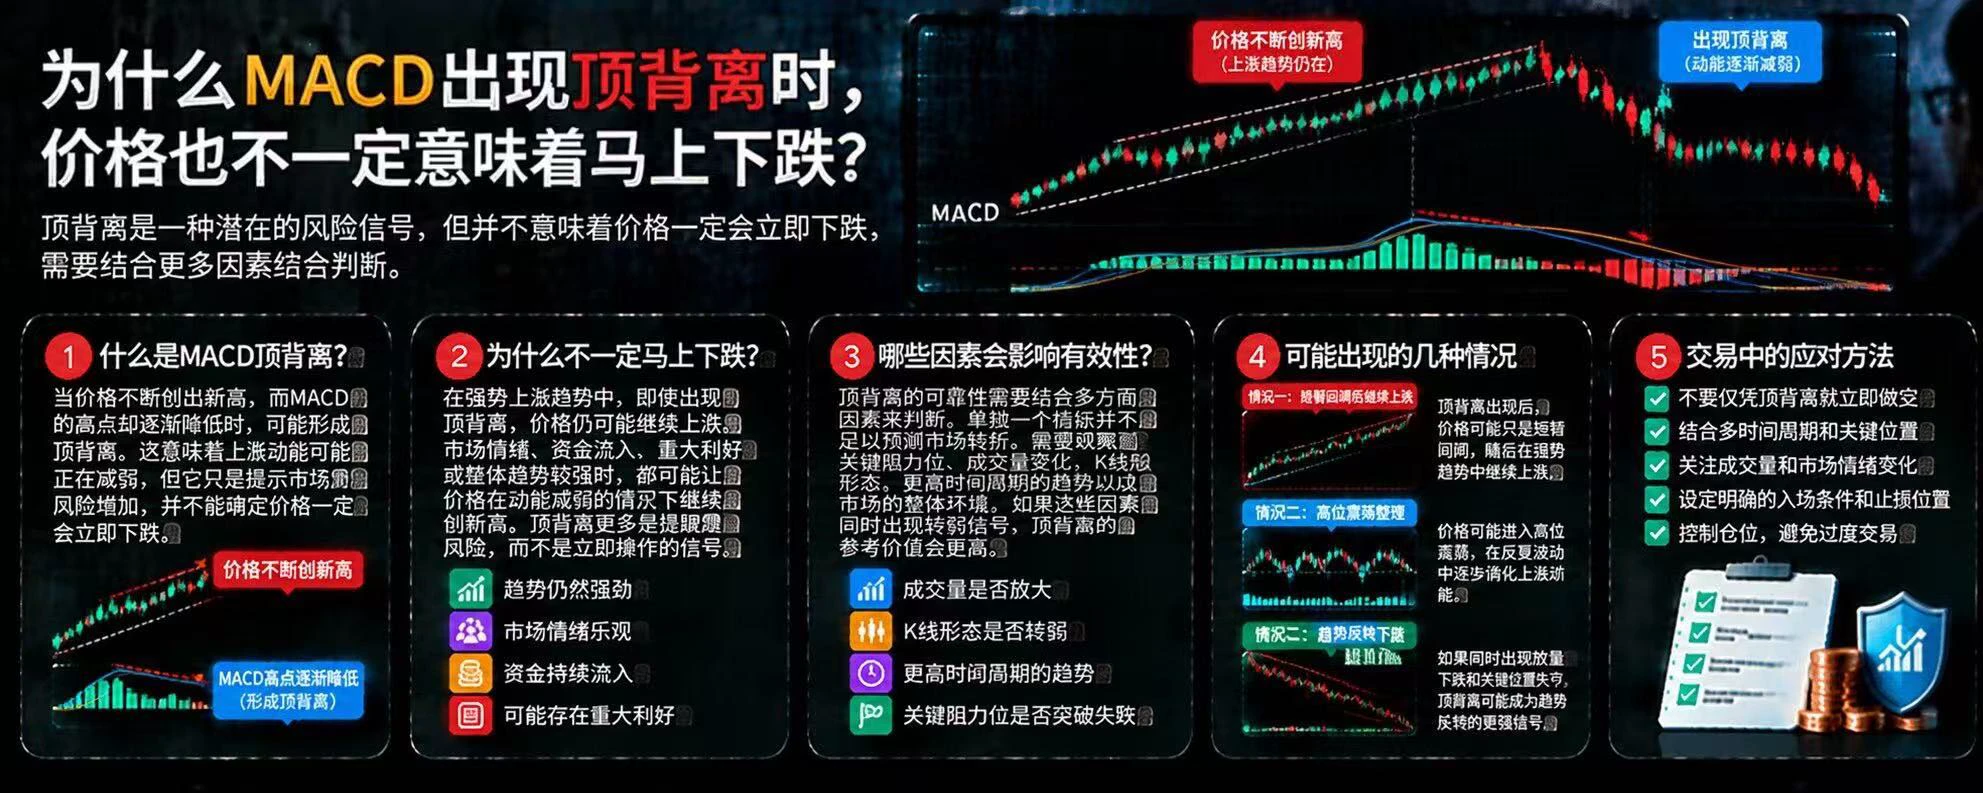
Why Doesn’t Price Necessarily Fall Immediately When MACD Shows Bearish Divergence?
In the crypto market, when prices keep making new highs while the highs on the MACD indicator gradually decline, bearish divergence may be forming. Many traders see this as a short signal, but bearish divergence indicates that upward momentum may be weakening; it does not mean that prices will necessarily fall immediately.
First, understand what bearish divergence means.
Bearish divergence typically occurs when price highs keep rising while the corresponding MACD highs gradually decline. This may indicate that u
post-image
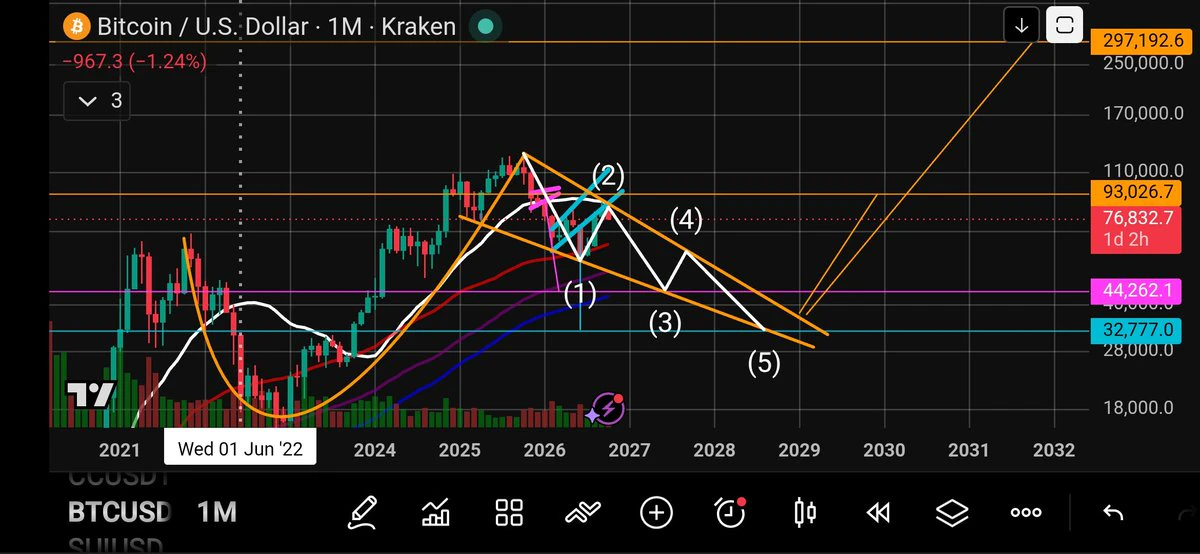
$BTC 1 Month Chart Analysis
Tomorrow is the 1 month candle close.
At this moment we see a tweezers top with a bearish engulfing candle.
We can also see a bearish restest of the blue bearflag. With a target down to $32,777.
This will give us the likely bottom range of the orange cup and handle pattern.
I see a likely bear market heading into 2027.
When the cup and handle pattern breaks upwards we could see some nice moves to the upside. Patience...
$BTC Main Bearish Targets 🎯
1) $44,262
2) $32,777
$BTC Bullish Targets Approx (If This Structure Holds)
1) $93,026
2) $297,192
NFA, DYOR ⚠️
#Cryp
post-image
BTC-0.67%
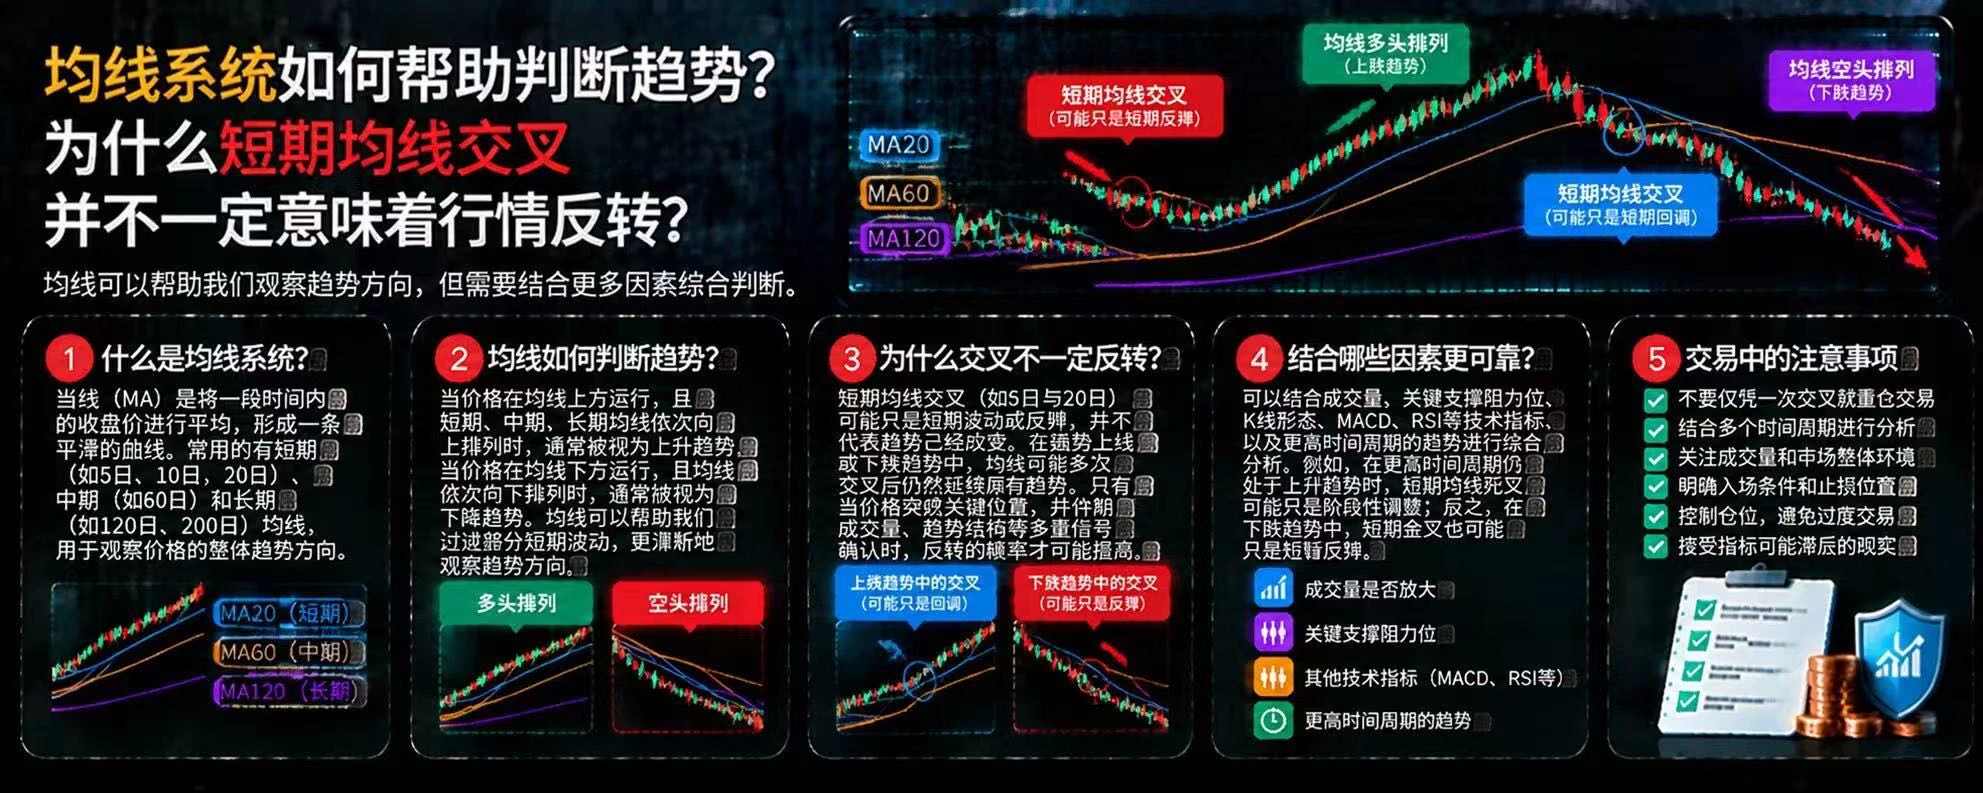
How Can Moving Average Systems Help Identify Trends? Why Don’t Short-Term Moving Average Crossovers Necessarily Signal a Reversal?
In the crypto market, moving averages (MAs) are a common tool for observing price trends. They smooth out short-term price fluctuations and help traders identify market direction, but moving average crossovers are not definitive signals for predicting price movements.
First, what is a moving average system?
A moving average is a curve formed by calculating the average price over a specific period. Common settings include MA20, MA60, and MA120, which are used to obs
post-image
SILVER plunges to $50, down 59% from its peak‼️‼️ Reportedly, silver prices fell to $50, the first time since November 2025; the January high was $121. Experts expect silver supply to increase in 2027 while demand weakens. The report also says the market sees an 80% chance of a rate hike in December, putting further pressure on silver. Meanwhile, gold remains near $3,900. $XAU $XAU l $XAG
post-image
XAU+0.38%
XAG+0.47%
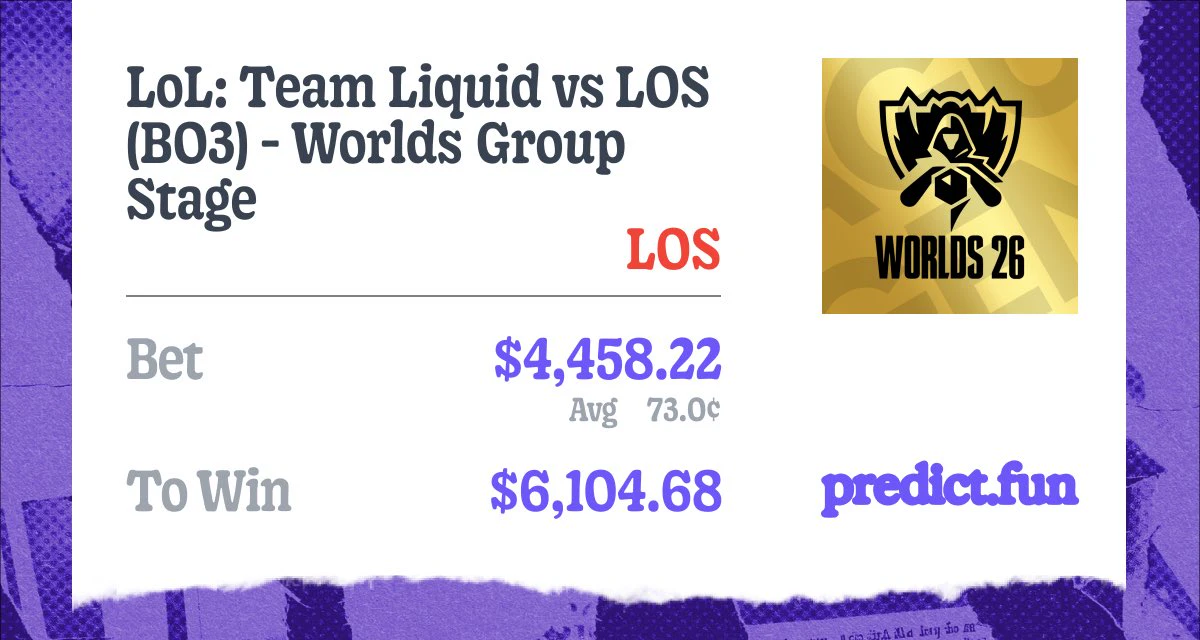
Two teams of absolute lunatics… I really shouldn’t have watched this match
Even though they won, the viewing experience was genuinely awful
post-image
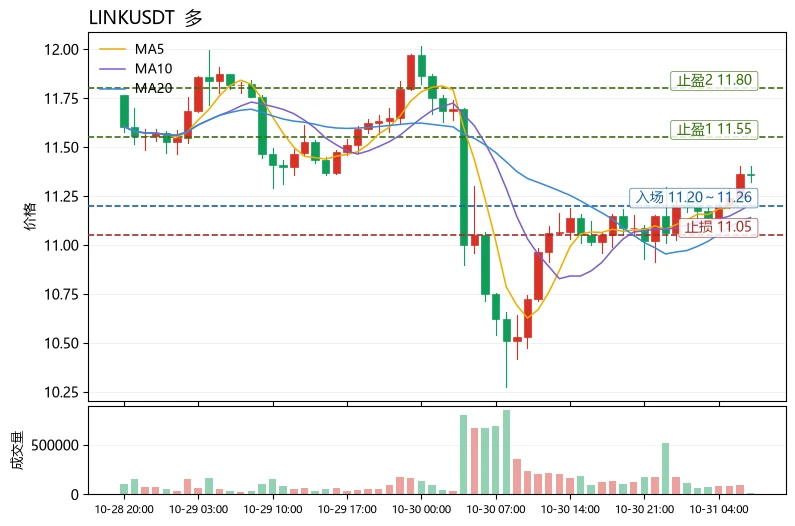
Conclusion first: $LINK is bullish in the short term, but the current price has already reached the upper Bollinger Band, making it poor value to chase; wait for a pullback before entering. On the funding front, longs have the edge on funding, while shorts are defending key levels, with pin risk concentrated above 11.33.
Rationale: $LINK The current price is 11.36, 24h +6.14%, with a trading volume of 55.2M and a moderate increase in volume. MA5=11.2596 has crossed above MA20=11.1404, with the moving averages in a bullish alignment; the MACD histogram at +0.04627 maintains bullish momentum; R
post-image
LINK-0.18%
PEPE+0.97%
AAVE-1.22%
#Bitcoin We also went around and around and ended up back at trend support again.
bitcoin:native
post-image
BTC-0.67%
Load More

Join 40 M users in our growing community

⚡️ Join 40 M users in the crypto craze discussion

💬 Engage with your favorite top creators

👍 See what interests you

Trending Topics

BTC大跌

187.63k Views39.5k Discussing

$BTC briefly fell below $77,000 and remains under pressure around the $77K zone, with its 24-hour decline still above 4%. With risk appetite weakening and Fed uncertainty rising, where is the next key support after losing $80K?

IntelBeatsEarningsButStockPlunges

13.45k Views725 Discussing

StrategySTRCNears100ParValue

17.04k Views4.03k Discussing

View More