Share your thoughts
placeholder
Article
I just hit refresh, and it shot up as if I had startled it. While it was bottoming during the session, $SOL hovered around 75.33. Buying pressure strengthened, and I judged it wasn’t a fake move, so I kept holding the long position—don’t let a small pullback shake you out. 🔥
It then shot straight up to 101.73, with unrealized gains of +3260.07%. Those who caught the rhythm must have woken up laughing. It was truly sluggish before, but the result is truly sweet.
Take profit on 80% first, and protect the remaining 20% at the entry price. Lock in profits when it’s time—don’t let gains become pa
post-image
SOL+2.02%
XRP+1.30%
LAB+48.23%
#GateAugustTransparencyReport
Gate August 2026 Transparency Report: When the Numbers Speak for Themselves
In the world of crypto, trust is the most expensive currency, and in August, Gate backed that trust not with words alone but with hard numbers. The August 2026 Transparency Report is a story that simultaneously brings the platform's financial strength, the solidity of its reserves, its trading liquidity, and the rapid evolution of its multi-asset business to the forefront. If this report had to be summarized in a single line, it would be this: Gate is not just operating, it is reinforcing
GT+0.95%
Crypto Market Sentiment: Bulls vs Bears
live-cover
LIVE1,289
Shiba Inu broke down below the trendline, triggering a sharp 7% sell-off.
After the initial drop, price retraced back to the breakdown level and got rejected once again, leading to another leg lower.
This structure offered two separate short opportunities: the initial breakdown and the subsequent retest and rejection of the broken trendline.
#CoinDeskRevealsGateRWAPerpetualsTop3Globally
post-image
SHIB+3.42%
  • 3
  • 2
#BREW I can't even—however much is earned each day, the same amount goes back, neither increasing nor decreasing🤥🤥🤥
post-image
So what exactly lies at the end of contract trading? 😖😭 To those of you fantasizing about getting rich overnight, I’d advise you to leave the game altogether. Don’t touch it again; if you have money, put it into regular spot investments.
Betting your house and car, pouring your entire net worth into the market, and ultimately getting liquidated is how you learn just how cold reality can be. You keep fantasizing that a single market rally can transform your wealth, get swept up by the obsession with getting rich overnight, ignore the risks, and stake all the safety net your life depends on in
This week’s account growth results:
Achieved impressive gains this week, growing from $10,000 to $21,270 in just five trading days, for a total profit of $11,270 and a trading win rate as high as 80%!
#黄金: #Gate主流CEXTop4 $BTC $ETH
post-image
BTC+0.12%
ETH+2.46%
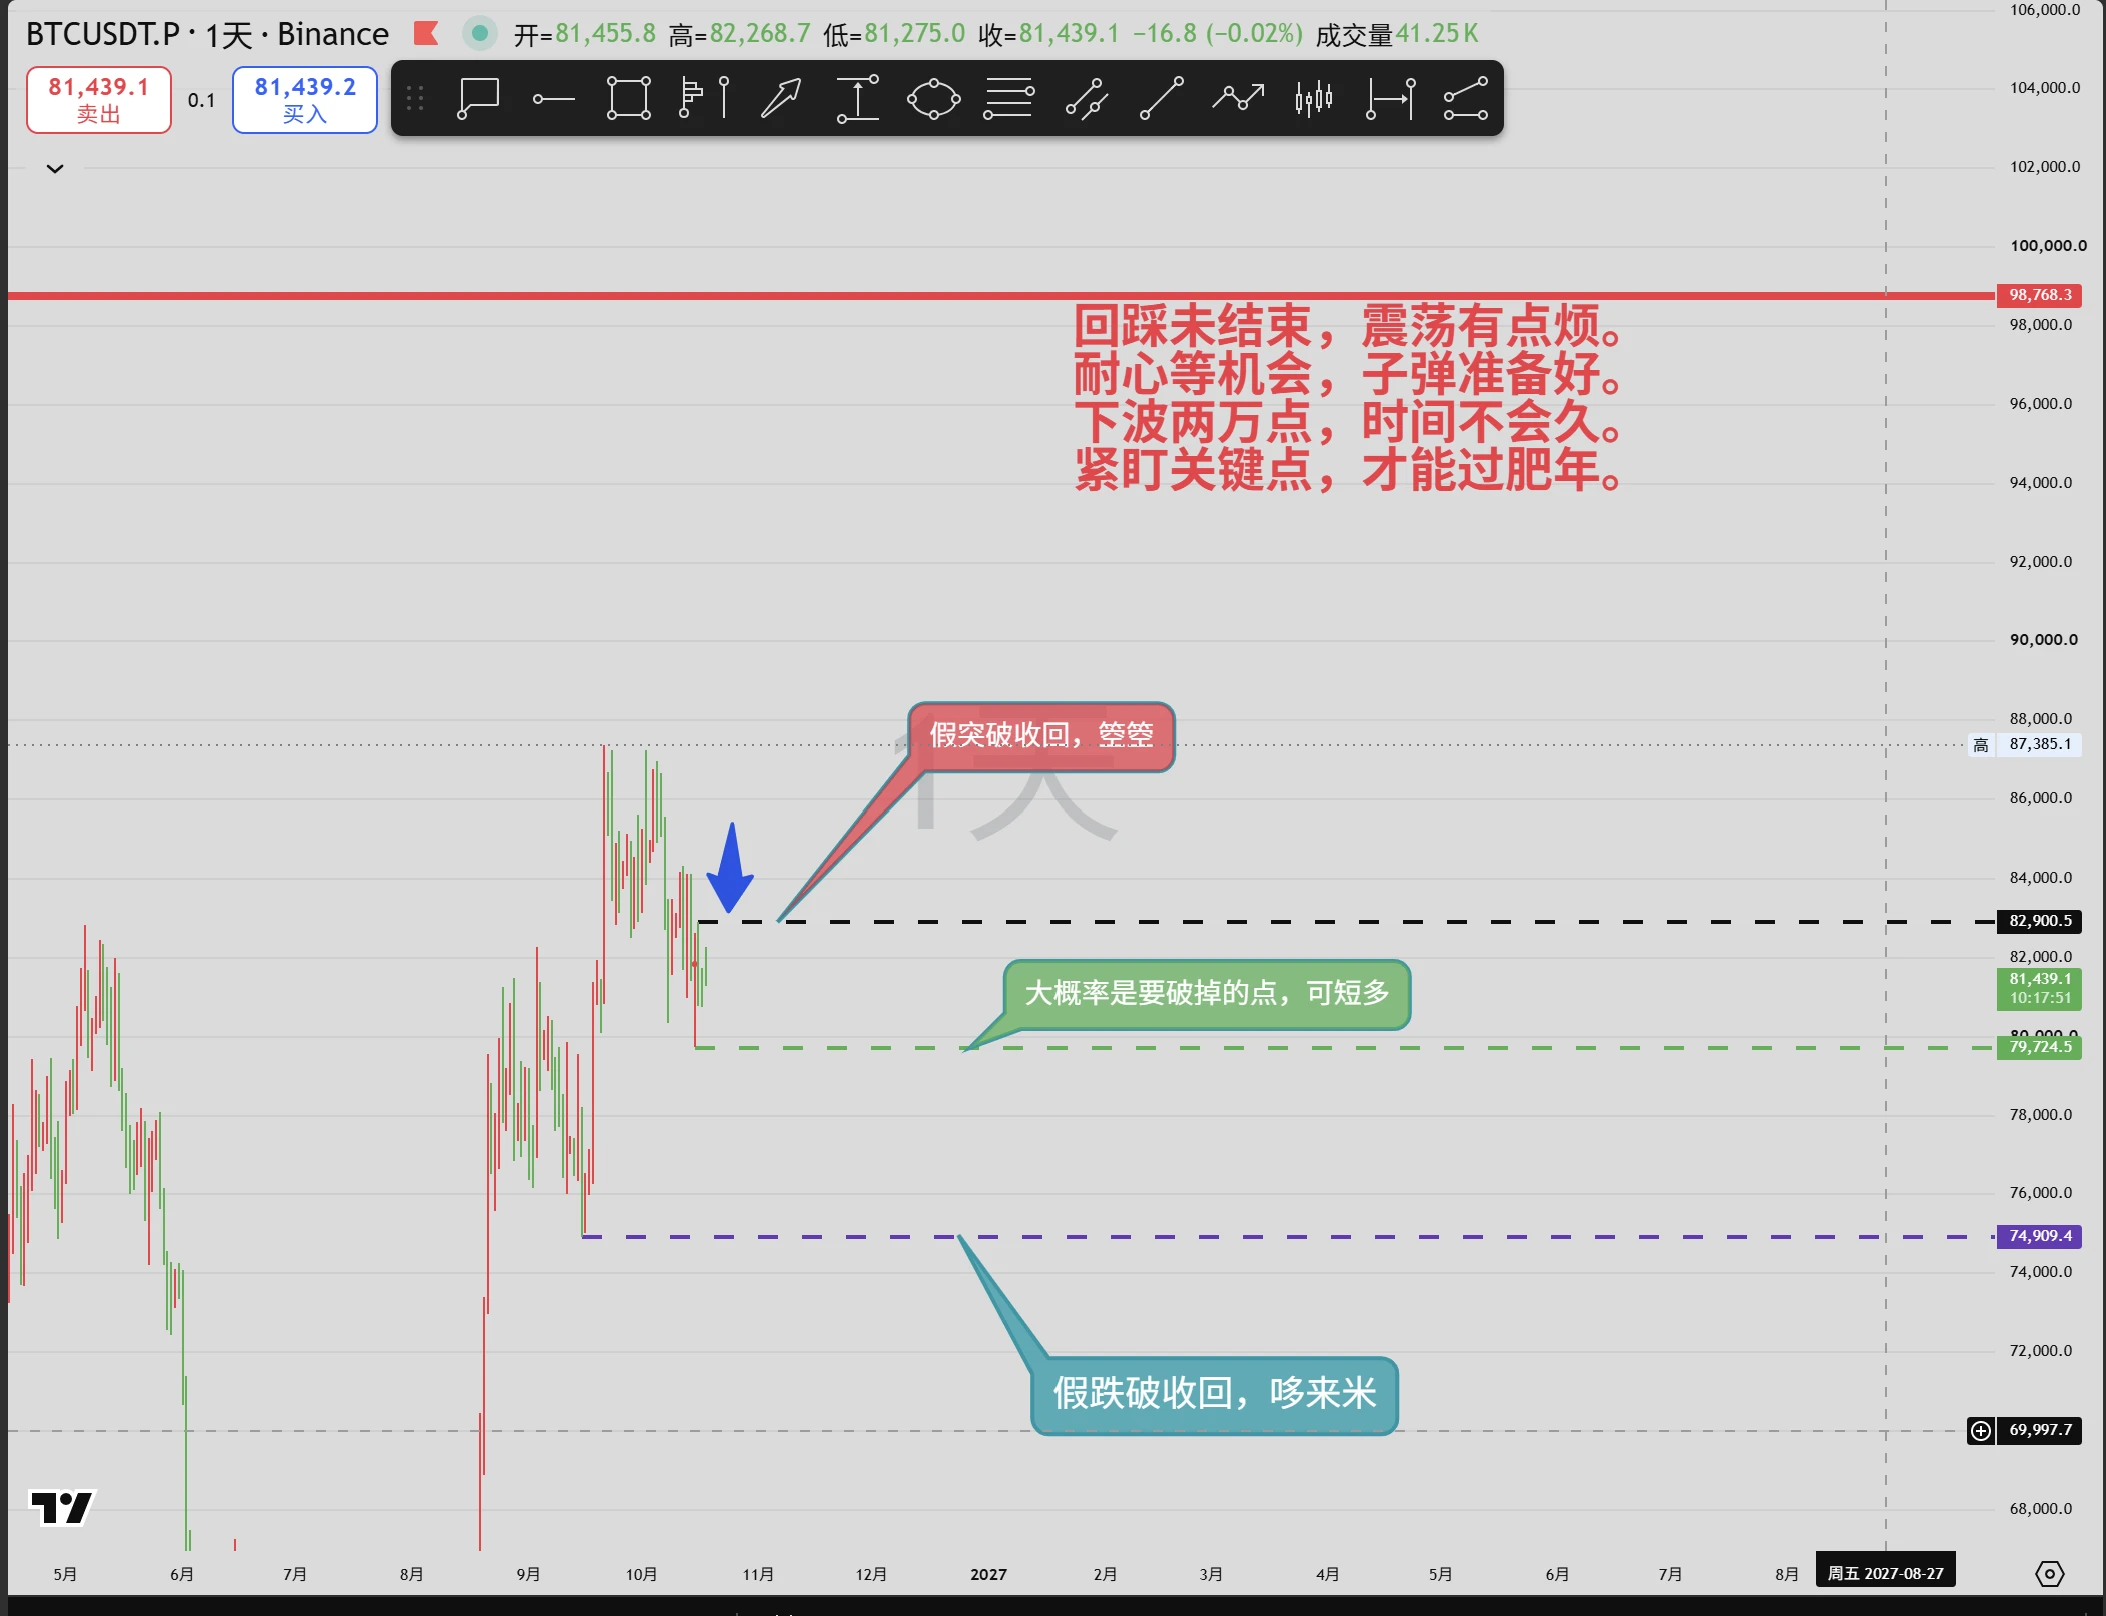
$NVDA Ethereum has broken out, while Bitcoin is still crouching below 82050
Ethereum pierced the horizontal high with a wick last night, while the range contracted from wide to narrow and support kept moving higher. The initial target is 3000, followed by 3300 after the breakout. Bitcoin has yet to make an effective break above 82050; I won’t turn bearish as long as 76,000 holds. This wave of bearish news has basically been priced in ahead of time, and even an actual rate hike may not necessarily trigger a drop. How high do you plan to hold the spot positions you have? Personal opinion only,
post-image
NVDA-0.09%
BTC+0.12%
Would you still buy ZEC at $1,140?
Look at the surface first: after surging to 1,297, it pulled back 15%, and retail traders panicked.
On September 9, ZEC touched 1,297, then plunged all the way back to 1,140. The groups started shouting, “It’s topped out” and “Privacy coins are always one-wave wonders.” But look closely—the pullback came on declining volume, the daily RSI retreated from overbought to 64, and the price is still above the 20-, 50-, and 100-day moving averages.
This isn’t a crash; it’s a breather at the highs after the main uptrend. The question is, after catching its breath, wi
post-image
BTC+0.12%
ETH+2.46%
ZEC+3.53%
Why is everyone ignoring the range trap forming in $XAU /USDT right now?

$XAU /USDT - SHORT

Trade Plan:
Entry: 4354.44 – 4359.62
SL: 4381.85
TP1: 4338.41
TP2: 4326.00
TP3: 4307.39

Why this setup?
Why now? The daily trend is a range, but the 1h price is holding at 4357.03 with a 15m RSI of 43.6, showing bearish momentum beneath the surface. The 1h ATR of 10.341699 means each candle can easily sweep the entry zone between 4354.44 and 4359.62, so a short entry at 4357.03 targets TP1 at 4338.41 and TP2 at 4326.00 for quick scalps. The invalidation level sits at 4415.15, a hard line that woul
XAU+0.06%
$USELESS ‌ is up 432 percent today, but the 4-hour chart is telling a very different story. This meme coin already had its massive pump and dump, and now it is trying to bounce from the lows. The problem is that the bounce is running straight into the EMA30 at 023448, which is acting as a hard ceiling. The MACD is still negative with DIF below DEA, so the momentum is not on the bulls side. If price rejects here, the next leg down could be brutal.
Entry: 023300 - 023400
Stop Loss: 024000
TP1: 021500
TP2: 020000
TP3: 018500
Do you think USELESS will break through 023448 or get rejected and roll
post-image
USELESS+5.79%
  • 4
How to Identify Trends in Crypto Markets
live-cover
LIVE1,141
#GateMeme Robinhood Chain’s New Paradigm: Meme Coins Directly “Attached” to Stock Tokens
If you remember only one sentence: On Robinhood Chain, a batch of Meme coins are replacing ETH/stablecoins as the “quoted asset” with tokenized stocks (Stock Tokens), using AMM pools to directly bind “crypto speculation” with “U.S. stock narratives” in trading.
What phenomenon is this? (Conclusion first)
Traditional on-chain Meme coins are usually traded as Meme/ETH or Meme/USDC, with the other side of the liquidity pool being a public-chain native asset or stablecoin. On Robinhood Chain (RH Chain), howeve
  • 7
  • 1
#OracleQ1EarningsBeatStockUpOver5%
Oracle just dropped Q1 FY2027 numbers and the market liked what it saw. Shares jumped more than 5 percent after hours on the beat. Here is the breakdown and how I am looking at it.
Key earnings highlights
Total revenue came in at 19.3 billion dollars, up 30 percent year over year and ahead of expectations. Non-GAAP EPS hit 1.92 dollars, beating the roughly 1.74 dollar consensus by a solid margin and rising 30 percent from last year.
The real story sits in cloud infrastructure. IaaS revenue more than doubled, up 121 percent to 7.4 billion dollars. Total cloud
ORCL-1.87%
  • 4
Gulf Stream Notes
2026.09.12-15:52
post-image
$XRP is showing strong short-term momentum. Buyers remain in control as price holds above the recovered structure.
EP $1.3632–$1.3660
TP $1.3675 $1.3695 $1.3720
SL $1.3590
Liquidity is building above $1.3675, while reactions from the $1.3632 zone continue to support the bullish structure.
Let’s go $XRP ‌
post-image
XRP+1.33%
My hand trembled slightly when I set the stop-loss a few days ago, only to find this morning that the filial devotion was unnecessary😏. The last thing I saw before bed, $SKHYNIX was still hovering around 1202.67, bottoming for so long that I nearly questioned my life choices, but I never moved that line because the bottom was getting increasingly solid and no breakdown occurred.

Looking again today, the price has already climbed to 1367.47, with unrealized gains directly hitting +972.92%. This run was worth the wait. It was truly sluggish at first, but the result was truly sweet.

I’ll ta
post-image
SKHYNIX+0.91%
DOGE+1.20%
ADA+0.77%
The price has moved down quite a bit, but I have no urge to add to my position. The short position has come down from 80632.5, but the pace hasn't been fast. There were two small rebounds along the way, neither significant, which instead looked more like the bulls searching for an entry point.

So I moved the protection level down a bit. If the price climbs back above it, I'd rather take slightly less profit than let a position already in floating profit turn passive. This is not a position for a new entry; a genuine new opportunity will only be confirmed if the rebound ends and the price con
post-image
SOL+2.02%
BNB+2.94%
Insiders are quietly fading $MU /USDT at 973.95 while the 1h ATR screams caution.

$MU /USDT - SHORT

Trade Plan:
Entry: 972.91 – 974.99
SL: 983.93
TP1: 966.46
TP2: 961.47
TP3: 953.98

Why this setup?
Why now? The daily trend is range-bound, which means $MU /USDT has been oscillating without a clear direction, setting the stage for a sharp move once it breaks out. The 1h ATR of 4.159725 shows that hourly volatility is compressed, suggesting a squeeze is building near the entry zone of 973.95. A 15m RSI reading of 43.49 confirms the asset is approaching oversold territory on the short term,
MU-1.25%
Load More

Join 40 M users in our growing community

⚡️ Join 40 M users in the crypto craze discussion

💬 Engage with your favorite top creators

👍 See what interests you