
Square
Following
Hot
News
Notifications
Profile
Share your thoughts
placeholder
Article
Ford wasted no time, tearing up the Starlink contract. U.S. companies can forget about getting government contracts in Ontario. With Trump’s tariffs in place, Canadian provinces are turning the tables. This is the blowback from a trade war: the one who strikes first feels the pain first, and the states and provinces that follow will learn from it. Which province do you think will be next to follow suit? We’ll know in two weeks.
post-image
F-0.63%
Continue shorting BTC and ETH: ETH at 2,150, BTC at 73,800. #美股AI板块遭遇重挫
post-image
BTC-0.65%
ETH-1.23%
Trenches
ZIG
Z
bade
b
ZIG
0x8c...1145
Market Cap
$.
Change
.
24h Vol
$.
Holders
.
STONK
S
bade
b
STONK
6GmA...UNgx
Market Cap
$.
Change
.
24h Vol
$.
Holders
.
BTC
B
bade
b
BTC
C5xp...pump
Market Cap
$.
Change
.
24h Vol
$.
Holders
.
MAGGIE
M
bade
b
MAGGIE
8rHo...PmZV
Market Cap
$.
Change
.
24h Vol
$.
Holders
.
CLAUDIA
C
bade
b
CLAUDIA
2j5S...W2ZM
Market Cap
$.
Change
.
24h Vol
$.
Holders
.
My cat votes for the jar with more treats, fren. Honest question: do you hold NFTs for the art or for the bags, anon?
post-image
ART+2.02%
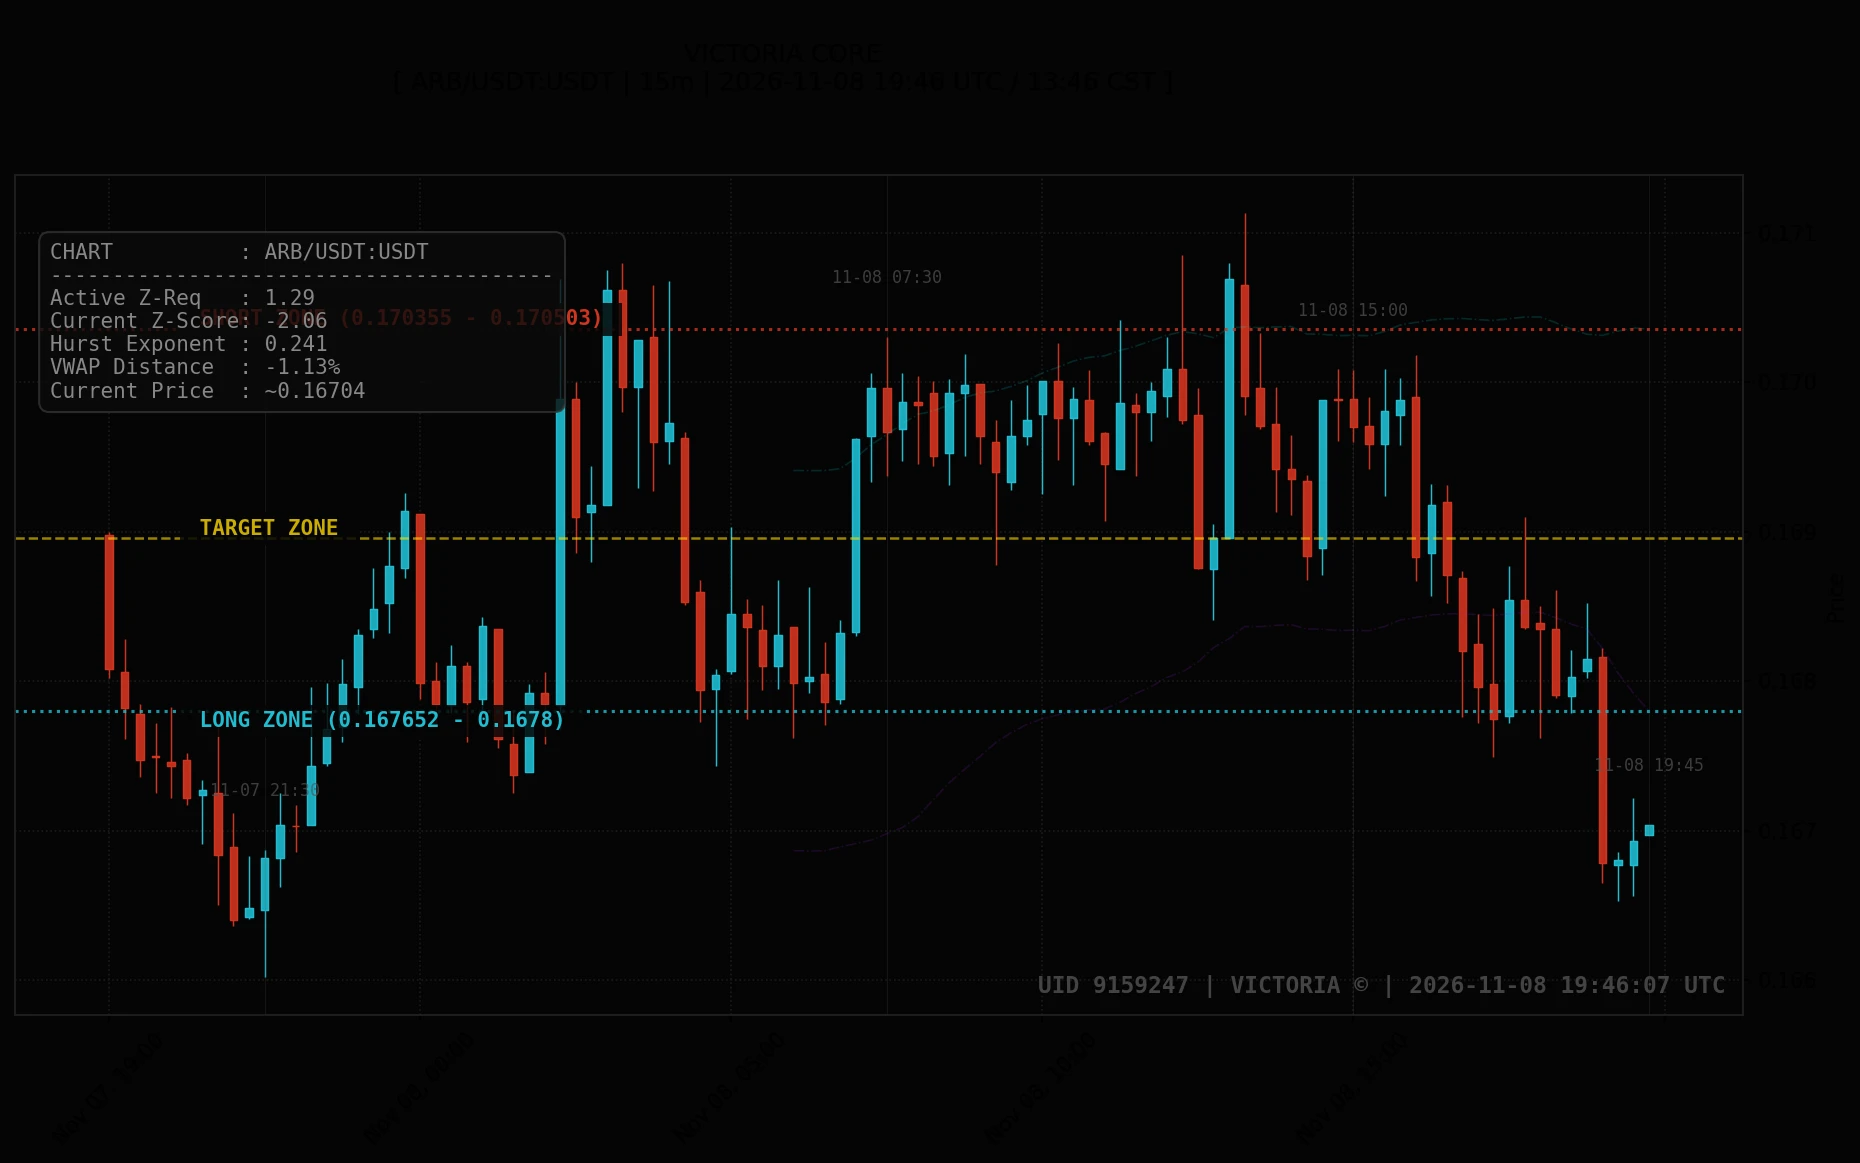
2026-11-08 19:46 UTC. ARB/USDT trades at ~0.16704 USDT in an extended discount structure, offering mean-reversion buyers an attractive risk-to-reward window if support at 0.16653 holds firmly. For safe execution, wait for price confirmation at LONG ZONE (0.167652 - 0.1678 USDT) targeting TARGET ZONE (~0.168955 USDT), while guarding against unexpected volatility with SHORT ZONE (0.170355 - 0.170503 USDT).

In secondary tracking, XRP/USDT at ~1.1544 USDT sits lower mid-range between LONG ZONE (1.15188 - 1.15267 USDT), SHORT ZONE (1.16618 - 1.16696 USDT), and TARGET ZONE (~1.15982 USDT). Finally
post-image
ARB+1.17%
XRP-1.15%
BTC-0.67%
$ROBO

My old stubborn donkey of a friend has decided to start a Good News series. It’s about time!
ROBO-2.79%
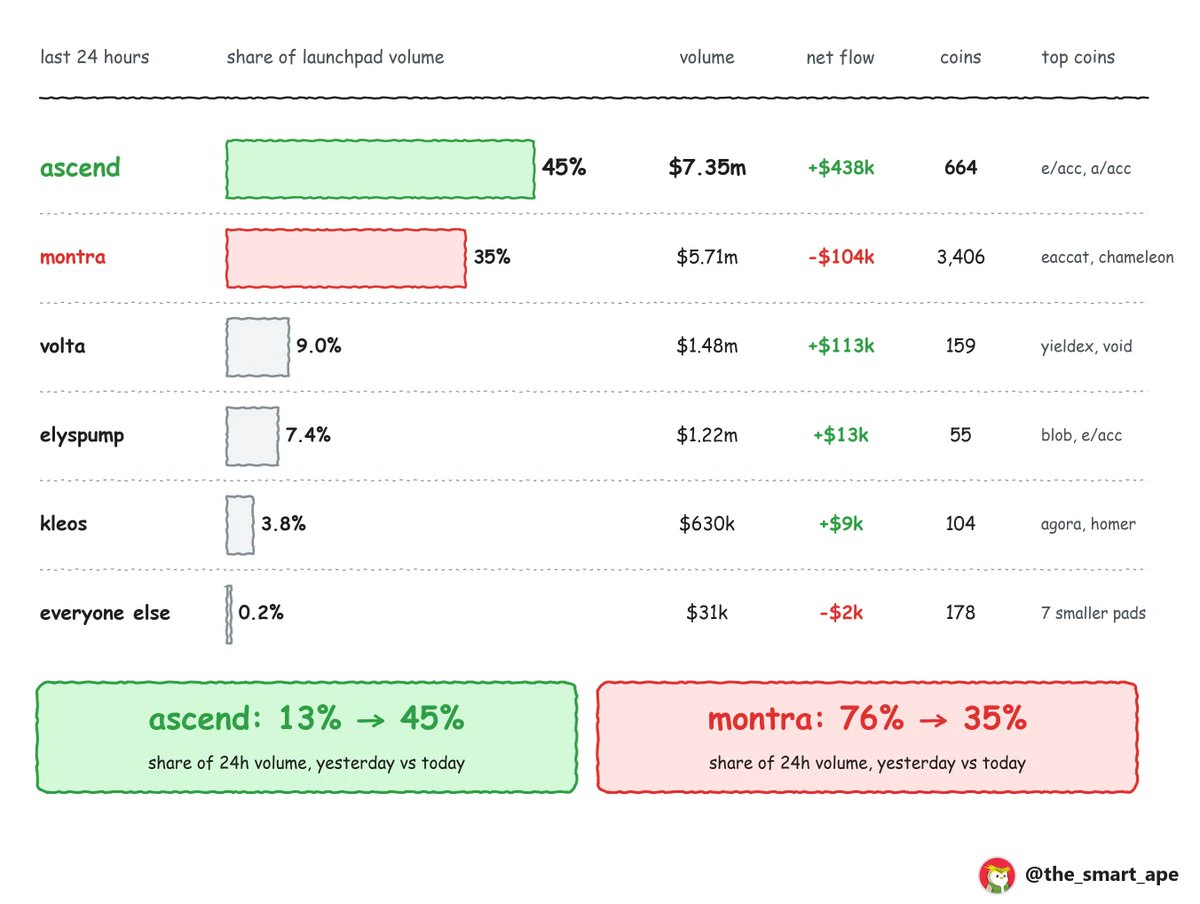
everything moves so fast on @Enter_Elysium. @MontraXYZ just got flipped.
two days ago montra did 73% of all launchpad volume. today @AscendLaunch is #1.
last 24h:
> ascend: $7.35m (45%)
> montra: $5.71m (35%)
> volta: $1.48m (9%)
the day before, montra had 76% and ascend 13%.
post-image
Which memecoin is about to do this
post-image
MEME-0.94%
MEMECOIN+8.70%
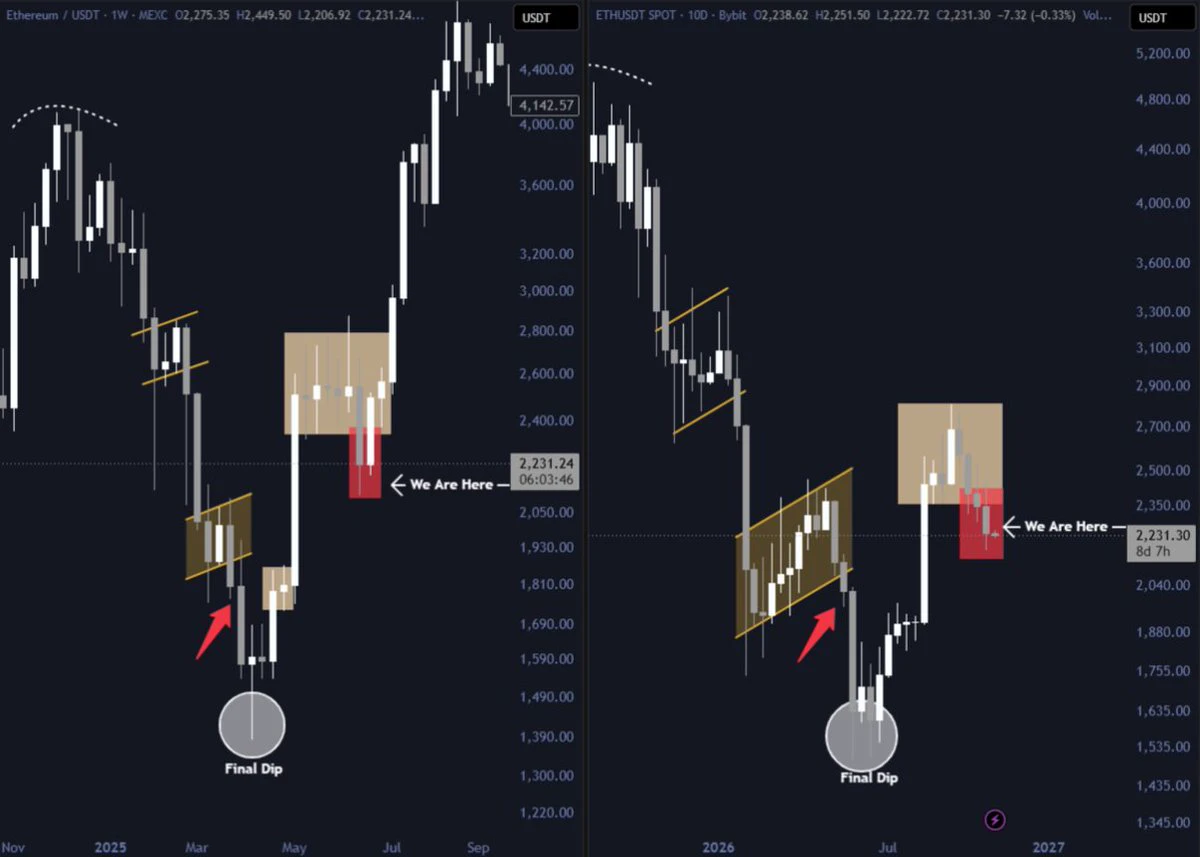
$ETH is getting close to its bottom
The structure looks very similar to 2025, and I think it'll repeat again
post-image
ETH-1.26%
The market suddenly moved late at night. $SNDK surged out of nowhere, and more than $20,000 in unrealized profits vanished in an instant. My average price is currently 888.93. My view is clear: this move is driven by liquidation-related liquidity and has no real footing; the price will most likely get hammered lower when the market opens today. If it keeps rising, I’ll add to my position. Either way, I’m keeping a steady mindset.

If the market maker behind $AK doesn’t have what it takes, they should stop trying to prop it up. Why act like a big shot while the price trades sideways? They can
post-image
ETH-1.26%
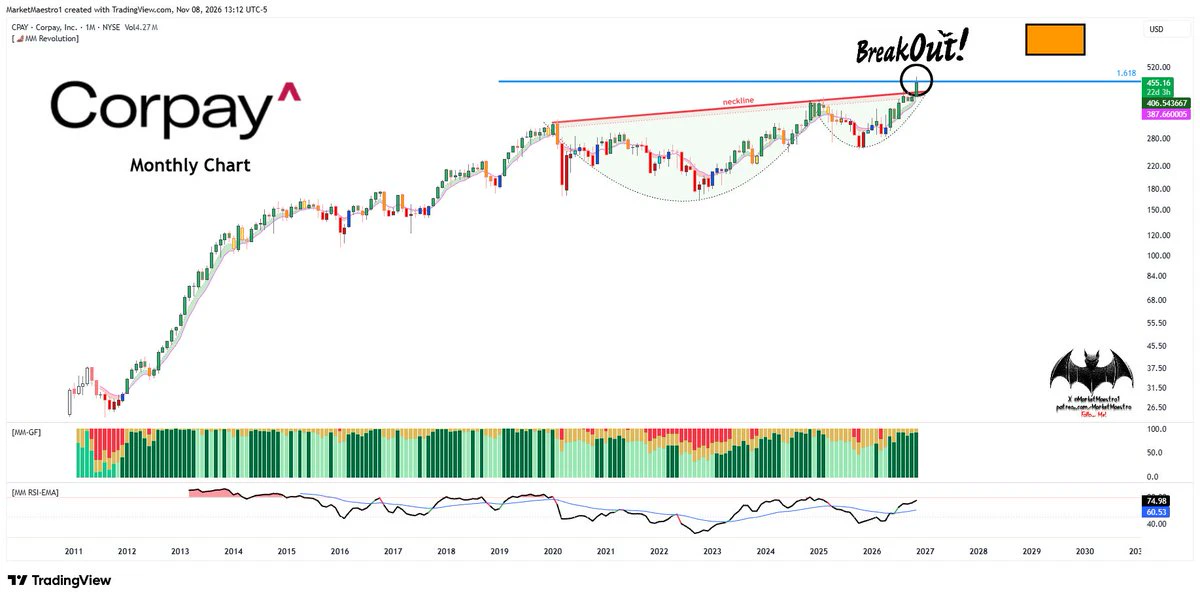
$CPAY
We haven’t seen bullish setups like this in a long time. It reached a key resistance level but broke out 💥 of its cup+handle pattern
post-image
CPAY+1.98%
$KOR This is going to be like a volcano!!!
Buy now at bargain prices
post-image
$SKYAI almost shook me out on this move. A few days ago, it was bottoming around 0.0302. I saw volume keep shrinking and thought I’d wait a little longer. Then a bullish candle shot it up to 0.0411. I chased at 0.038, and my nerves went straight out the window—when it rose, I feared a pullback; when it fell, I feared getting stuck. In the end, I sold half around 0.0363 and made just enough for lunch. One lesson: when it’s moving sideways on low volume, don’t keep thinking “it might go a little lower.” Set a stop-loss at 0.033 and get in when it hits—that’s better than staring at the chart. It’
SKYAI-7.58%
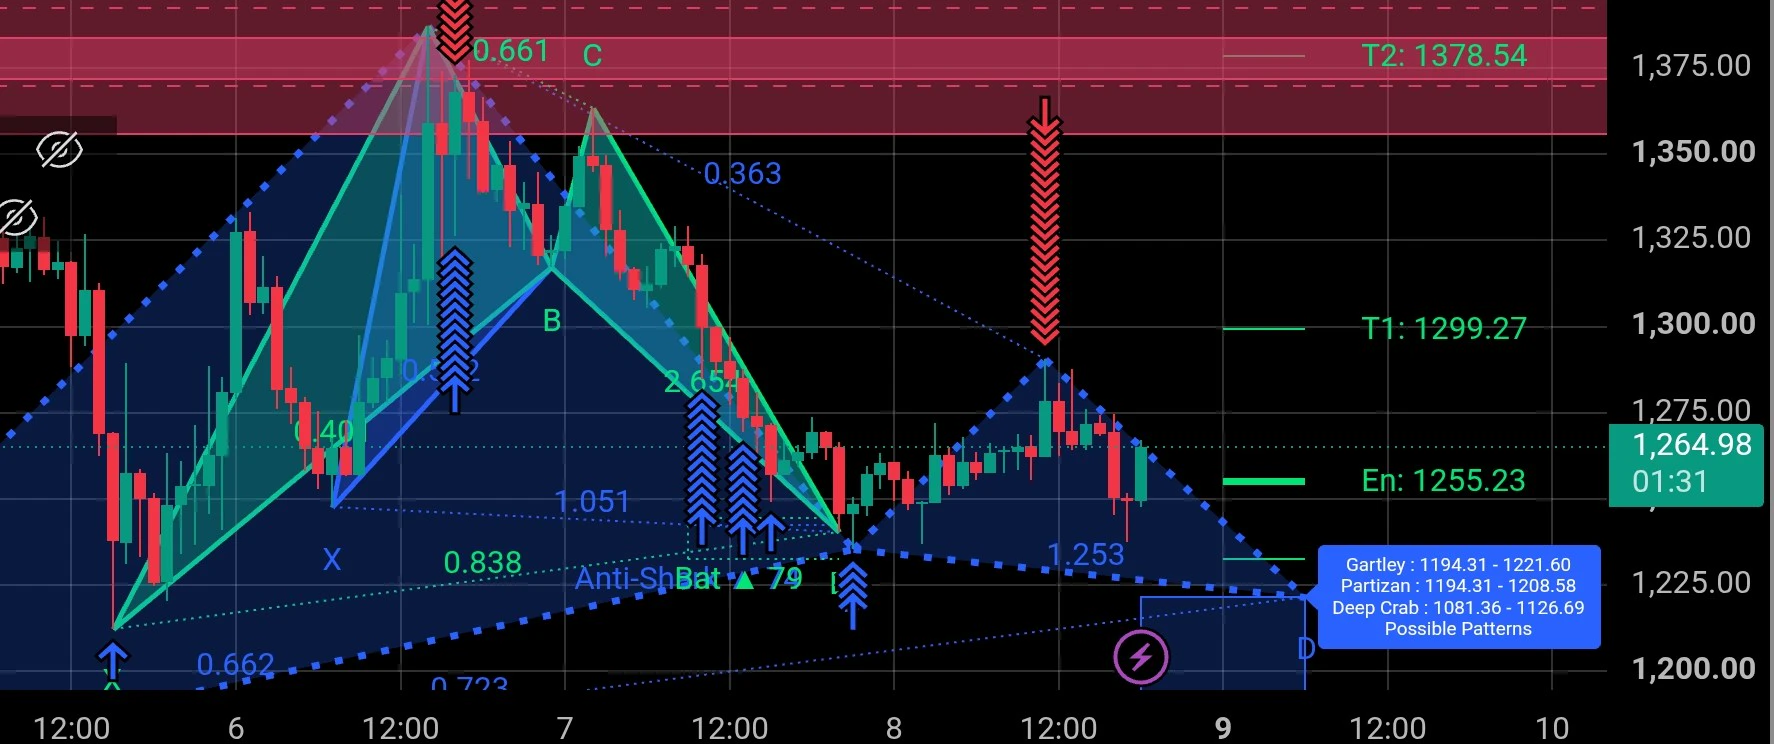
$ZEC Bat pattern formed and confirmed BUY at 1255 usd. See the formation and studied entry point , TP and SL. Some other patterns also coming soon if market moves in the right direction.
post-image
ZEC+1.29%
Bitcoin ETFs saw a net outflow of $412 million, with BlackRock’s IBIT posting a net outflow of $403
live-cover
LIVE40
market prices updattes
live-cover
LIVE11
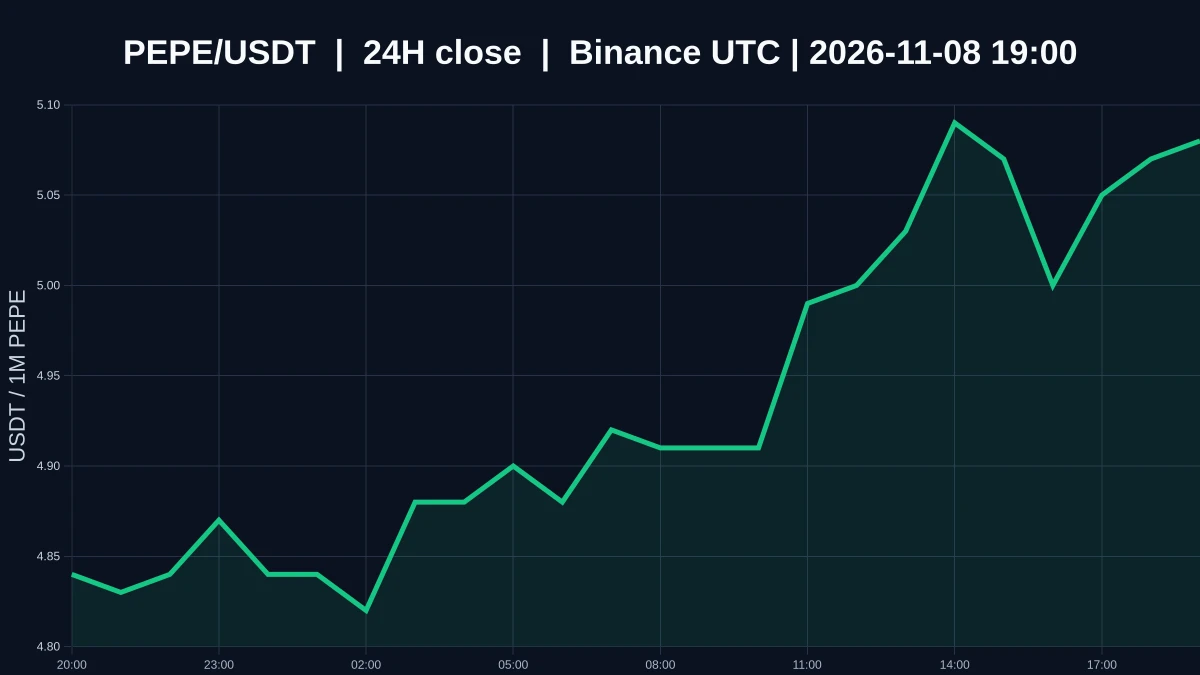
$PEPE ’s price has already moved. Why hasn’t trading volume followed?

$PEPE is currently priced at 0.00000508, up 3.885% over 24 hours, with an intraday high of 0.00000513 and a low of 0.00000478. The 1-hour and 4-hour trends are both relatively strong, but the volume ratio is only 0.030028783815234078. The direction looks clear, but volume hasn’t weighed in, which makes this move less convincing.

On the 1-hour chart, support is at 0.00000478 and resistance is at 0.00000513. At 0.00000508, the current price is about 0.00000030 above support and about 0.00000005 below resistance, putting it ve
post-image
PEPE+0.97%
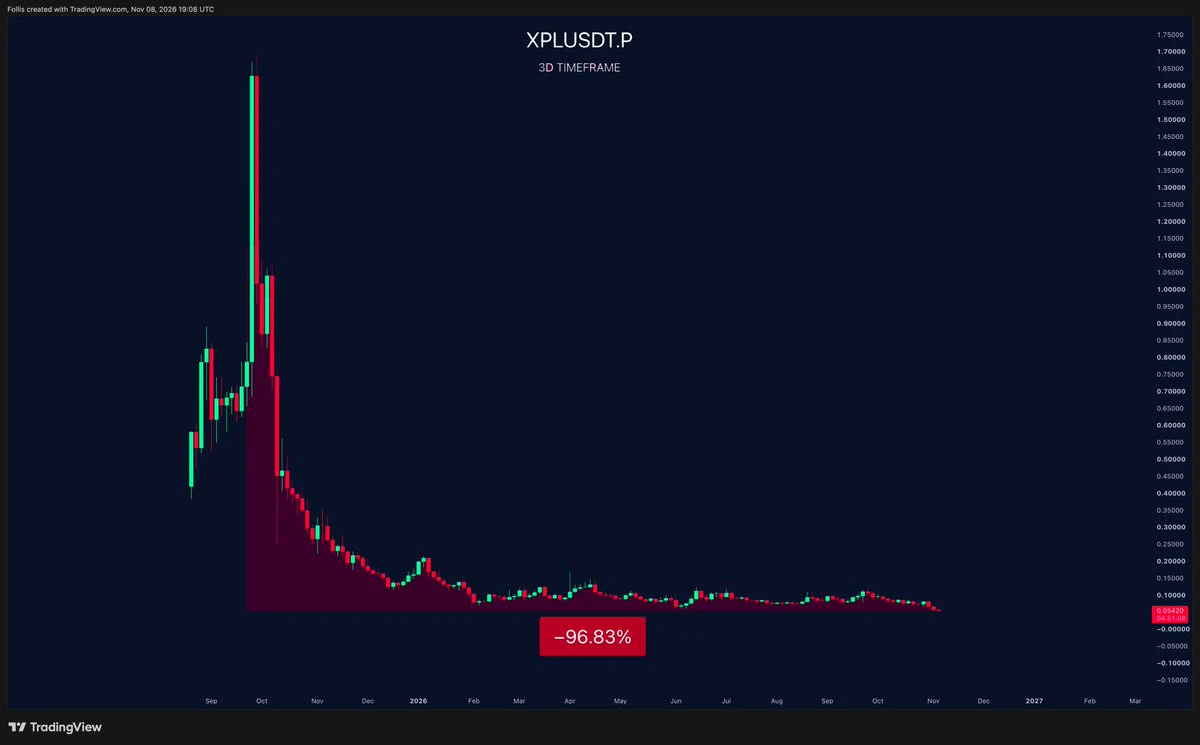
Happy new $XPL ATL to those who celebrate
post-image
XPL-0.60%
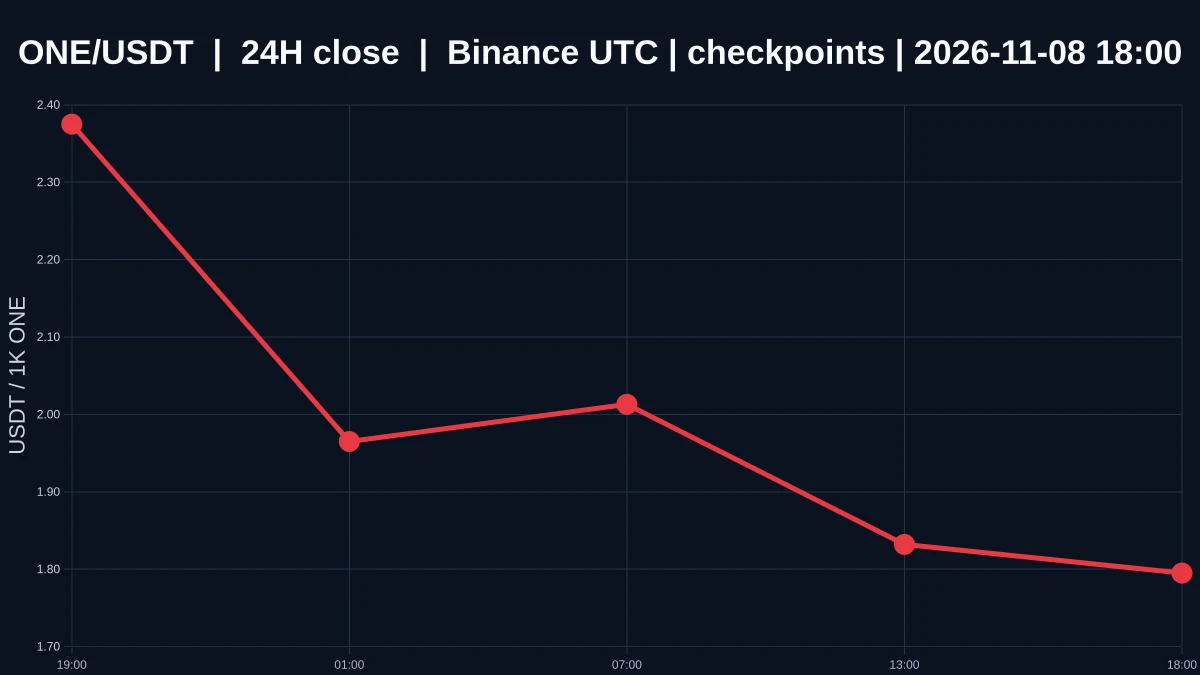
$ONE’s 1-hour and 4-hour charts are at odds. Which one should you trust first?

$ONE is currently priced at 0.001805, down 16.163% over 24 hours, with an intraday high of 0.00243 and low of 0.001692. The 1-hour trend is weak, while the 4-hour trend is strong. The volume ratio is 0.018471001840377217. Selling pressure has emerged on the shorter time frame, but the larger time frame has not weakened in tandem. This looks more like an unconfirmed direction than a clearly established pullback.

At the current price of 0.001805, $ONE is about 0.000113 away from the 1-hour support at 0.001692 and ab
post-image
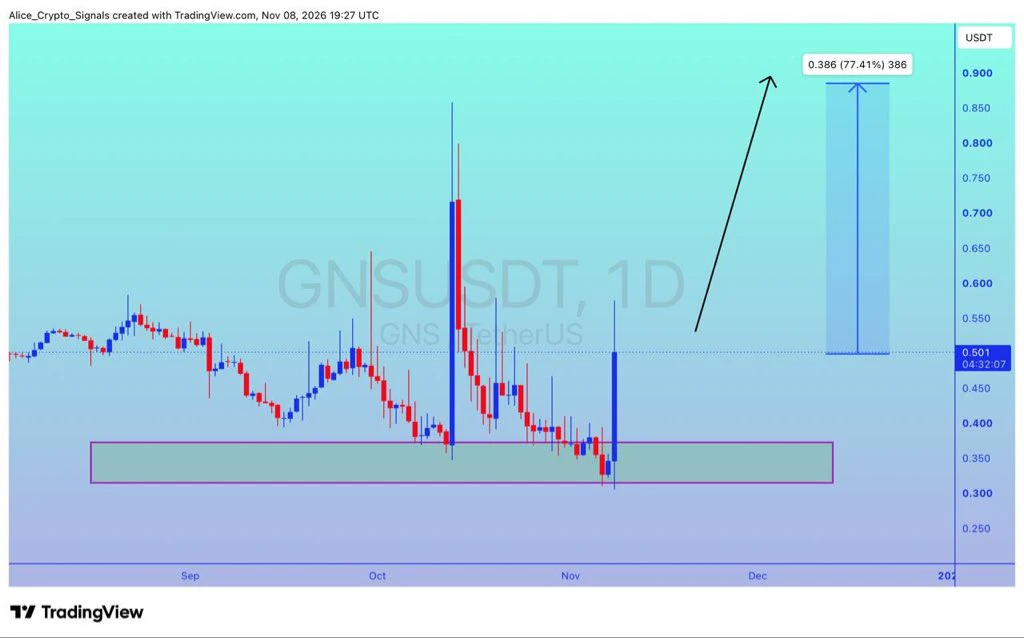
$GNS
UPDATE
#GNS is getting a good volume here. We can see 70%+ gain here ✍🏻
#GNSUSDT #GNSBTC #Btc #Bitcoin #NFTs
post-image
GNS-6.46%
BTC-0.67%
Load More

Join 40 M users in our growing community

⚡️ Join 40 M users in the crypto craze discussion

💬 Engage with your favorite top creators

👍 See what interests you

Trending Topics

USCPIDataIncoming

14.34k Views1.66k Discussing

The U.S. October CPI report will be released on November 10 at 8:30 a.m. ET. September CPI came in at 3.7% year over year, and markets will be watching closely for signs that inflation is cooling, especially in core CPI. A softer-than-expected reading could strengthen rate-cut expectations, while hotter inflation may pressure risk assets through higher Treasury yields and a stronger dollar. How do you think this CPI print will move $BTC, U.S. stocks and gold?

USAIStocksHitHard

28.78k Views3.74k Discussing

USNonfarmPayrolls

55.32k Views4.5k Discussing

View More