Share your thoughts
placeholder
Article
The hand that set the stop-loss a few days ago trembled slightly; this morning, I realized that filial piety was unnecessary.
After the early-session dump, $SOL still poked its head up and faked two upward moves around 104.51. The volume kept shrinking, and the resistance above was too obvious. At a spot this heavy with the scent of a bull trap, I went straight in short. Don’t let the range grind away your patience, only to try to win back your dignity in a one-way move.
By the time I came to my senses, the price had already reached 103.3, delivering a return of +109.4%. This round of holding
post-image
SOL+1.93%
ETH+1.09%
SNDK+1.65%
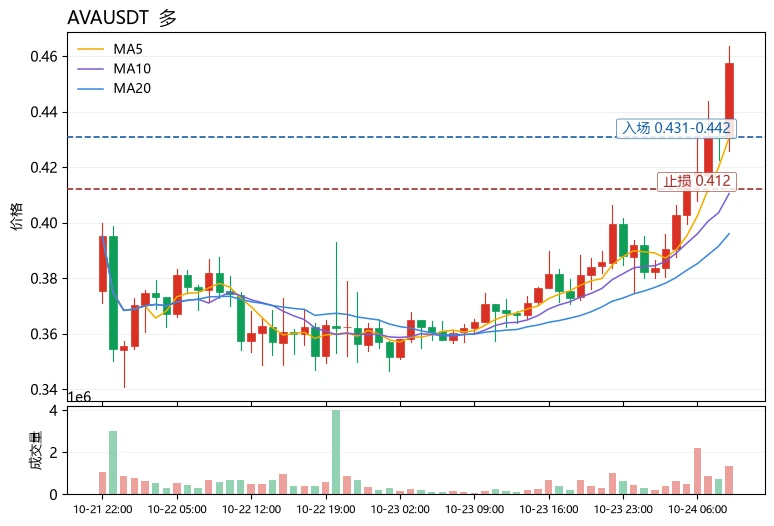
$4 Signal】MACD dual-timeframe expansion, follow long
$4 RSI (4H) 80.32, 1H 77.68; MACD dual-timeframe bars expanding, with price moving along the upper Bollinger Band. The latest 4H candle closed at 0.034113, with aggressive buy orders accounting for 52%. The funding rate is 0.1381%, long position costs remain high, and the order book has not been overwhelmed. Order-book depth imbalance is -0.78%, with slightly greater sell-side depth. Risk-reward ratio 1.5; trade the momentum and do not overstay.
🎯Direction: Long (long)
⚡Entry/limit order: 0.03403459 - 0.03413700
🛑Stop-loss: 0.03379563
🚀T
post-image
4+36.71%
BTC+0.07%
ETH+1.07%
SOL+1.85%
Everyone’s staring at Bitcoin—but ZEC just flashed a 95% long signal that nobody sees yet.

$ZEC /USDT - LONG

Trade Plan:
Entry: 1009.13 – 1017.39
SL: 973.59
TP1: 1043.02
TP2: 1062.85
TP3: 1092.61

Why this setup?
Why now? The 4H timeframe is primed while the 1D trend stays bullish. RSI on the 15m sits at 40.87—cooling off without breaking down. That’s the sweet spot: entry ref at 1013.26, with TP1 at 1043 and TP2 at 1062.85. ATR shows controlled volatility (16.53), so the move isn’t overheated. This is a textbook pullback-buy setup, not a chase.

Debate:
Are you loading ZEC before TP2, o
ZEC-1.17%
Everyone’s staring at gold’s ceiling, but the floor just cracked on XAUT.

$XAUT /USDT - SHORT

Trade Plan:
Entry: 4426.7 – 4429.5
SL: 4439.6
TP1: 4419.5
TP2: 4413.8
TP3: 4405.2

Why this setup?
Why now? The 4h bias flips SHORT with 55% conviction, while the 1D stays range—this is a scalp, not a saga.
- Price sits at 4428.1, rejected from the 4429.5 high.
- RSI (15m) at 53.18 is fading, not accelerating.
- ATR (1h) at 5.72 means a clean 14-point slide to TP2 (4413.8) is a 2.5x risk-reward.
The range top is sticky; the first push down is the highest-probability move.

Debate:
If gol
XAUT+0.06%
Do you still remember your first trade on Gate?
60 million users—that number is enough to evoke a lot of emotion. Gate’s global registered users recently officially surpassed 60 million, and the platform has now expanded from simple digital asset trading into more scenarios, including stocks, ETFs, payments, wallets, and Web3.
But for ordinary users, the number 60 million may not be as memorable as their “first trade.”
Because the first trade is often something special.
It may have been the first time buying BTC and thinking, “Why is this thing so expensive?”; the first time buying ETH, spendi
BTC+0.07%
ETH+1.07%
  • 14
Everyone’s staring at LTC’s 54.17—but the real trap is the 1D range you’re ignoring.

$LTC /USDT - SHORT

Trade Plan:
Entry: 54.02 – 54.32
SL: 55.99
TP1: 52.81
TP2: 51.90
TP3: 50.54

Why this setup?
- 4h bias is SHORT with 77.4 confidence, yet 1D is sideways—that’s a coiled spring, not a free fall.
- Entry at 54.17 sits mid-range; RSI 15m at 49.81 shows zero momentum—no buyers, no sellers, just dead air.
- Why now? ATR 1h (0.58) is tight, but TP1 at 52.81 is a 2.5% drop that only triggers if 54.02 breaks. If it holds, the alt scenario flips to 55.22.
- The range ceiling (55.99 SL) is
LTC+6.45%
$ASTEROID liquidated over 600 million in long positions.
post-image
ASTEROID-12.68%
There was clearly a key level above, but the price simply refused to pull back and retest it, grinding sideways near the highs. This kind of rhythm is the most painful for those without a position. I entered my long after the breakout on the pullback, with an entry reference around 0.3520. After several repeated wicks failed to break the level, I confirmed that the market was temporarily strong.
After the price reached near the target zone today, I took profit on 80% of the position directly, first reducing the risk on this trade. I did not close the remaining 20% either, tightening the stop-l
post-image
ZEC-1.17%
LAB+2.80%
$PI Pi doesn't have what it takes. TRB is the real deal.
post-image
PI+1.43%
Men just want one thing...
post-image
btc market trend
live-cover
LIVE22
What a stressful day it has been for me.
Just spent over 24 hours on traffic. Started my travel by 6pm last night and I'm just getting to my destination 😭💔
post-image
Nonfarm payrolls rewrote the script overnight! The Fed’s rate-cut calculations thrown into disarray by 162k jobs?
The market had originally been looking forward to: cooling employment → slowing economy → Fed rate cuts → liquidity returning → risk assets continuing their celebration.
Instead, August nonfarm payrolls delivered a direct “plot twist.”
The US added 162k nonfarm jobs, far exceeding market expectations of just over 50k, while the unemployment rate held at 4.1%. More importantly, June and July employment figures were revised up by a combined 55k.
What does this mean?
At the very least
NVDA+0.87%
  • 44
15 years ago today, Bitcoin was $8
Me 15 years ago :
post-image
BTC+0.07%
Everyone’s watching $BTC /USDT’s range—but the 4h clock just started ticking against the bulls.

$BTC /USDT - SHORT

Trade Plan:
Entry: 79603.5 – 79727.1
SL: 80259.1
TP1: 79220.0
TP2: 78923.1
TP3: 78477.8

Why this setup?
Why now?
- Price is pinned at 79,665 with RSI (15m) at 39.7—weak momentum, not oversold yet.
- ATR (1h) at 247 shows low volatility, but that’s a coil before a snap.
- Range-bound 1D trend means breakouts fake out—but our SHORT targets TP1 at 79,220 and TP2 at 78,923 are only 0.5% away.
- The invalidation at 79,079 is close—so if we lose this, the thesis flips fast
BTC+0.11%
Most traders will ignore HOME/USDT right now—that’s exactly why I’m watching it.

HOME/USDT - SHORT

Trade Plan:
Entry: 0.0061 – 0.0061
SL: 0.0062
TP1: 0.0060
TP2: 0.0060
TP3: 0.0059

Why this setup?
Why now? The 4h signal screams SHORT with 95% confidence, but the 15m RSI (51.28) hasn’t confirmed weakness yet. That’s the trap—waiting for exhaustion that already happened on the 1D bearish trend. Entry at 0.0061, TP1/TP2 stacked at 0.0060, TP3 at 0.0059. The ATR (4.4e-05) says moves are tight, but the trend says they’re relentless. Price is sitting at a pivot—if 0.0061 breaks, the slide is m
HOME+1.50%
Ondo Stock Token Race: Hold for Cash, Trade to Win 50,000 USDT
https://www.gate.com/share/act/824a0a1b
post-image
ONDO+3.43%
  • 4
Brad cannot say a price. He is a CEO.
So he follows exactly 589 accounts.
The XRPL Foundation cannot say a price either.
So it hid 5, 8 and 9 in a picture.
589 was never a number. A password.
It is the sentence nobody in the room is allowed to say out loud.
1.3M followers is a bonus.
Everyone’s long XLM, but the 4H clock just ticked against the crowd.

$XLM /USDT - SHORT

Trade Plan:
Entry: 0.18373 – 0.18449
SL: 0.18771
TP1: 0.18141
TP2: 0.17960
TP3: 0.17690

Why this setup?
Why now? The range-bound 1D trend is your tell—no momentum to break higher.
- RSI (15m) at 48.2: neutral, giving sellers room to push without overbought friction.
- ATR (1h) at 0.0015: tight volatility—perfect for a clean slide to TP1 (0.18141) and TP2 (0.17960).
- Entry at 0.18411 is armed; invalidation sits at 0.18203, so the risk is defined and tight.

Debate:
Is XLM faking the dip below 0
XLM+3.03%
Load More

Join 40 M users in our growing community

⚡️ Join 40 M users in the crypto craze discussion

💬 Engage with your favorite top creators

👍 See what interests you

View More