Square
Following
Hot
News
Profile
Share your thoughts
placeholder
Article
FUD at ATHs!
BULLISH!
post-image
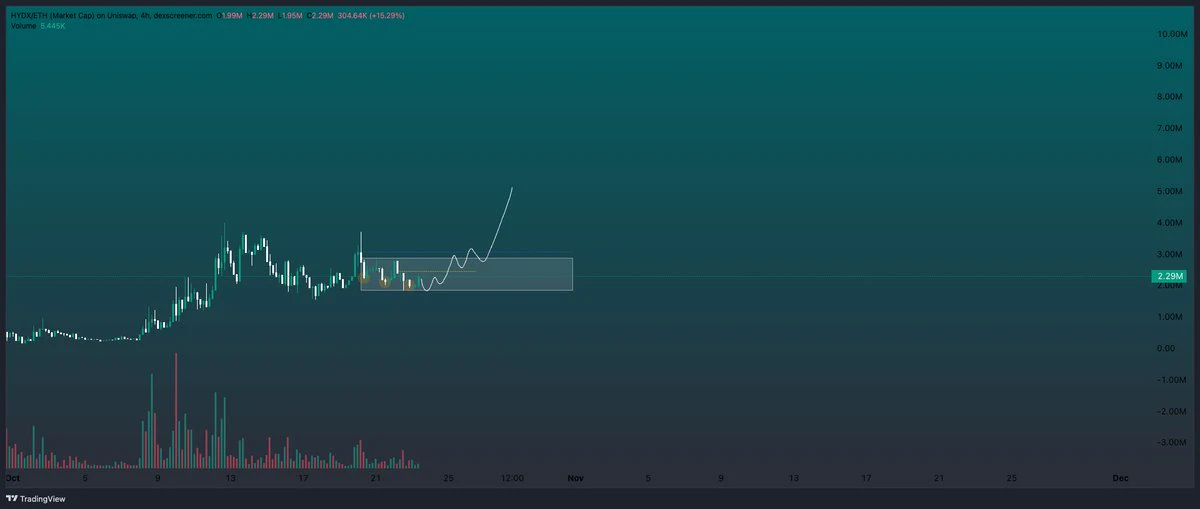
$HYDX very fresh on the market. Best believe massive announcements in works, good bidding levels.
post-image
Trenches
Kimchi
K
bade
b
Kimchi
CSoc...pump
Market Cap
$.
Change
.
24h Vol
$.
Holders
.
kimchi
k
bade
b
kimchi
B1Y2...pump
Market Cap
$.
Change
.
24h Vol
$.
Holders
.
CYBER
C
bade
b
CYBER
CMo7...pump
Market Cap
$.
Change
.
24h Vol
$.
Holders
.
AGT
A
bade
b
AGT
0x5d...e274
Market Cap
$.
Change
.
24h Vol
$.
Holders
.
STONK
S
bade
b
STONK
6GmA...UNgx
Market Cap
$.
Change
.
24h Vol
$.
Holders
.
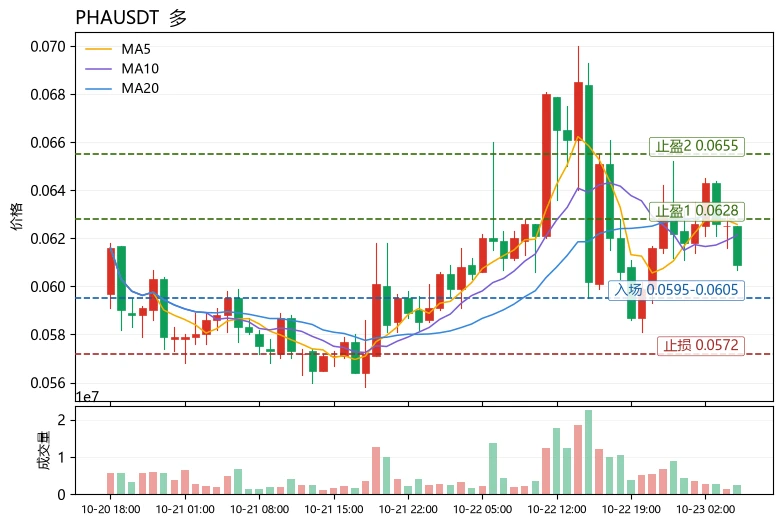
$PHA Current price 0.0609, down slightly 0.81% over 24h, with a trading volume of 12.1M USDT; MA5=0.06258 has crossed below MA20=0.062955, RSI at 47.4 is neutral to weak, the MACD histogram at -0.0002054 remains bearish, the Bollinger Bands [0.0577452, 0.0681648] are relatively wide, and the range across 30 candles is about 19.54%. The data is clear, and so is the assessment: the death cross combined with a negative MACD histogram shows the trend has not yet recovered, but with price near the lower Bollinger Band and the funding rate at -0.0453% indicating crowded shorts, there is room for a
post-image
PHA-2.84%
XRP-5.01%
GRAM-3.15%
$IRYS
It’s been surging wildly all week, and is now grinding against resistance as open interest continues to climb sharply—price up, open interest up; the last wave of longs is propping itself up🤯. There’s nothing but bagholders above; every push higher is just handing money to the shorts. Get out fast—breakdown is imminent
post-image
IRYS+4.48%
Sold all my Mudwater packs and bought a M2 MAYC instead of a M1 yesterday.
I'm either a genius or I'm dumb.
post-image
Many people equate “down 20%” with “oversold, so it’s time to buy the dip.” This is one of the most common technical-analysis misconceptions—the size of the drop itself is not a buy signal; the moving-average structure and momentum indicators are what matter.
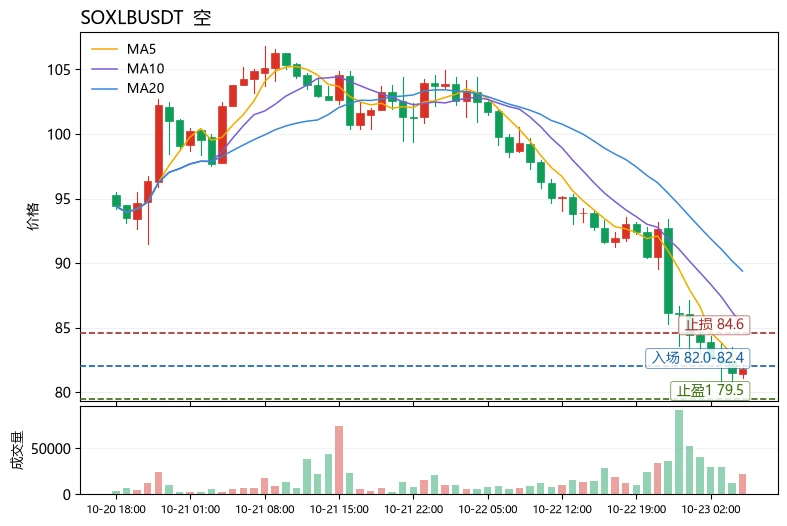
$SOXL Current price: 81.77, down 20.11% in 24h, but MA5=82.394 remains below MA20=89.379, with mid-term moving-average resistance still intact; RSI=21.5 has entered oversold territory, while the MACD histogram at -0.7014 shows bearish momentum still playing out. The lower Bollinger Band at 79.3449 is the only nearby support for now. Struc
post-image
$QQQB
$QQQBQQQB
Pump.Fun
MC:$2.84KHolders:0
0%
GRAM-3.15%
Like and RT this tweet.
Follow me and join my Telegram group.
$100 each to 3 people
post-image
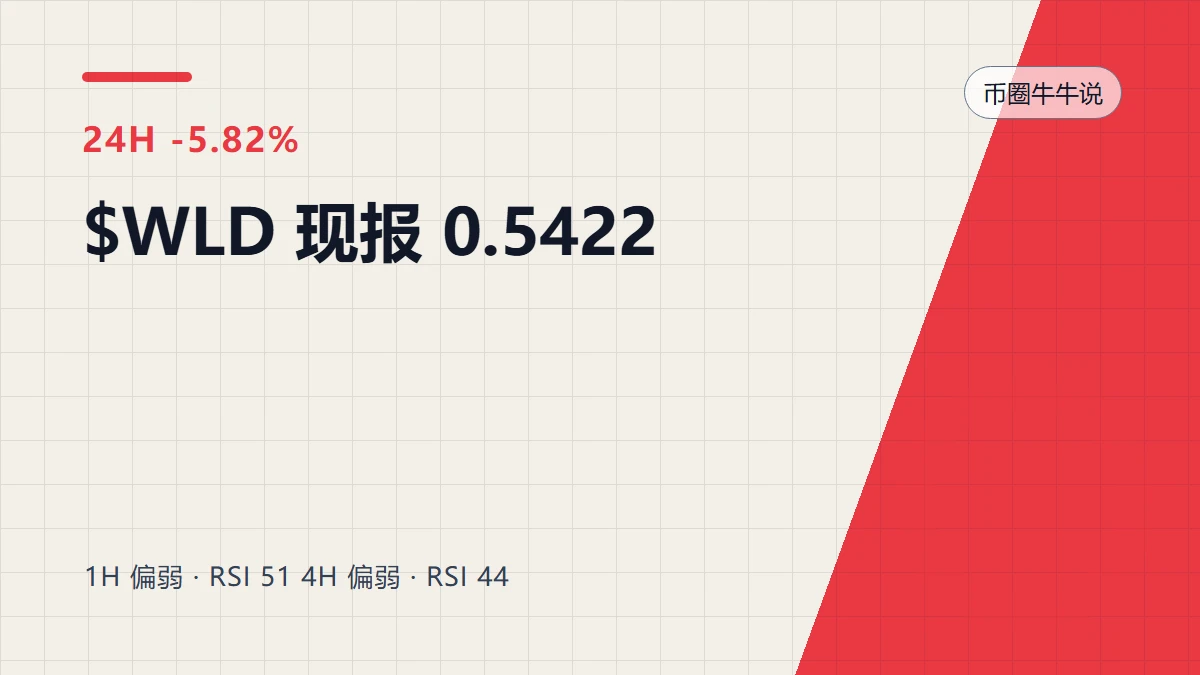
$WLD is currently at 0.5422, down 5.82% over 24 hours, with volume at 0.35 times the average of the last 20 bars. Taken together, these numbers highlight the key point: $WLD’s price has already moved, but trading activity and volume have not followed.
The direction may be trusted for now, but continuation shouldn’t be assumed in advance; a move without follow-through can be reversed at any time. Price shows direction, while volume shows participation. When price has moved but volume is well below average, the chances of a breakout or decline continuing should be discounted.
Near-term levels to
post-image
WLD-5.25%
With a bearish moving average crossover and RSI nearing 30, should you buy the dip at this “can’t fall much further” level or keep waiting? My answer: first determine whether the trend is healthy, then decide whether to enter.
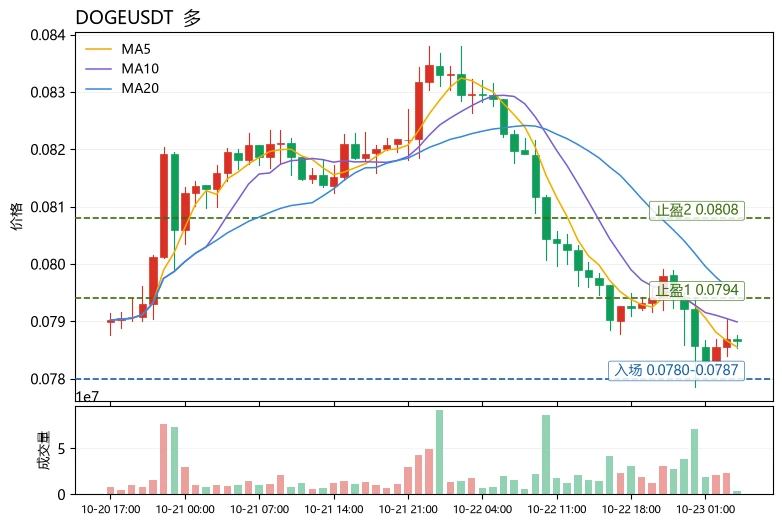
Here’s a reusable approach using $DOG as an example: use the moving average alignment to determine direction, and RSI and Bollinger Bands to determine position. MA5=0.078552 is currently below MA20=0.0794465, with the short-term moving average below the longer-term one and the trend structure leaning bearish; RSI=31.5 is nearing oversold territory, and the price at 0.07
post-image
PEPE-6.00%
XRP memes are back????????????????
post-image
XRP-5.01%
$AGT . Momentum is weakening, and the sell-off has begun.
post-image
AGT+20.08%
wtf is going on???
Tesla Roadster Suddenly “Takes Off,” Meme Coins Get Caught Up in the Frenzy! How Many More Days Can This Party Last?
Who would have thought that before the car even entered mass production, Meme coins would already have floored the accelerator!
As Tesla’s next-generation Roadster showcased rocket propulsion technology and a liftoff maneuver, the market instantly went into excitement mode. FTR surged on the hype, while trading interest in TSLA- and SPCX-related assets also heated up. Musk hasn’t even put the car on the road, but traders are already eager to send the price charts to the moon.
Bu
GBPUSD+0.00%
🚨 Bitcoin Dominance Hits 60% — Altcoins Take the Hit
Bitcoin’s grip on the crypto market is strengthening as traders favor BTC over riskier altcoins.
Bitcoin dominance reached 60%, its highest level since May, while BTC slipped below $82,000 after briefly breaking above $84,000.
Meanwhile, altcoins faced heavier losses:
• Memecoin Index: down over 5%
• Computing Select Index: down 3.5%
• DeFi Select Index: down 2.5%
For me, When Bitcoin dominance rises while smaller tokens fall harder, the market is signaling caution, not broadbased strength.
The next catalyst could determine whether capital
post-image
BTC-3.86%
MEME-5.83%
Every on-chain entrepreneur should learn from this project
The approach isn’t sophisticated, but it works well enough
I looked at the on-chain contract: 95,000 units, plus 5,000 reserved for the team
There are 6 main contracts, with 3,345 buy order IDs so far
At the current price of 13U, the market cap will be 1.3M once sold out
The effective amounts in the order book up front are tiny
A small horse pulling a big cart: a few thousand U can build a 1M market, with another 1% fee to collect
post-image
MMM+0.00%
$BTC 61,800 BTC — Should the Market Fear a Potential Sell-Off?
Seized Bitcoin doesn’t mean Bitcoin is being sold. The 61,800 $BTC remain subject to legal proceedings, and an immediate sell-off is not confirmed.
The real risk is future supply pressure, not the headline itself. Until a sale is confirmed, traders should separate legal uncertainty from actual market selling.
Is the market anticipating a real supply shock or overreacting to uncertainty?
#Bitcoin #BTC #CryptoMarket
post-image
BTC-3.86%
MARKET OVERVIEW
live-cover
LIVE1,419
I can't sleep every day! $SNDK has me so excited!
post-image
SNDK-8.74%
  • 1
Market update BTC
live-cover
LIVE1,011
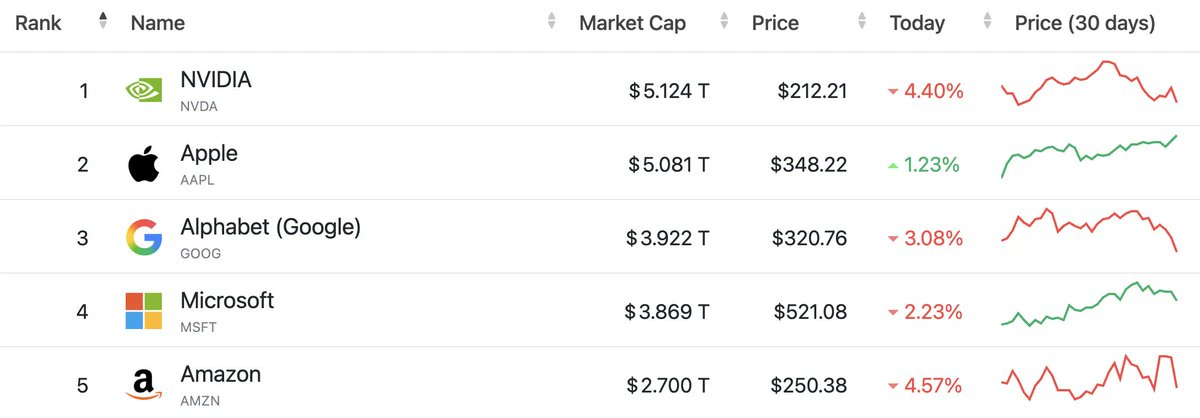
#BREAKING: $AAPL closed at an all-time high and crossed $5 trillion in market cap again.
While the rest of mega-cap tech sold off, Apple finished the day up 1.23% and reclaimed the $5 trillion mark.
post-image
AAPL+1.22%
Load More

Join 40 M users in our growing community

⚡️ Join 40 M users in the crypto craze discussion

💬 Engage with your favorite top creators

👍 See what interests you

Trending Topics

GateQ3ReportReleased

9.05k Views3.63k Discussing

Gate released its Q3 2026 report, with September derivatives trading volume reaching $396 billion, up 38.2% MoM, while spot trading volume reached $48.8 billion. The platform now covers more than 12,800 global stocks and ETFs. With trading and broader financial services expanding together, what could drive Gate’s next phase of growth? [👉 Full report](https://www.gate.com/announcements/article/102375)

MetaEarningsBeatExpectations

9.2k Views584 Discussing

USAIAndCryptoStocksRise

35.4k Views8.53k Discussing

View More