
Square
Following
Hot
News
Profile

KatyPaty

vip
Futures Trading Strategist
Active for: 3.1y
Peak Tier 6
I am a streamer and content creator. My only rule: any crypto income I show is transparent, verifiable, and earned fairly.
234
Following
22.6k
Followers
47.9k
Liked
Michael Saylor Hints at Another BTC Purchase
live-cover
LIVE2,586
I've joined #WCTCS9 ! Click the link to join my team—let's share a 3,200,000 USDT prize pool and fight for glory! https://www.gate.com/competition/wctc-s9?page=teamCompetition&teamId=65443&ref_type=165&utm_cmp=tgv0wayw&ref=gate-KatjjkaK
post-image
  • 5
#ShareWeekly #WillYouBuyDipInKoreanStocks
Korean Stocks Plunge as Samsung and SK Hynix Slide. Is It Time to Buy the Dip?
South Korean equities opened the week with a sharp sell-off on Monday, October 12. The benchmark KOSPI plunged 3.65% to close at 6,384.24, marking its first close below 6,400 in roughly two months and its largest single-day drop in about a month. The tech-heavy KOSDAQ followed suit, tumbling 4.83% to 849.19.
The Damage in Semiconductors
The two memory-chip giants bore the brunt of the selling. Samsung Electronics fell 4.39% to close at 250,500 won, equivalent to approximat
post-image
  • 11
  • 1
ETH/USDT Technical Analysis and Monday Outlook
Current Price: $2,552.75
24h Range: $2,496.52 to $2,578.45
Weekly Chart Analysis
The weekly timeframe shows the price has recovered from the lower Bollinger Band at $1,355. The asset is currently trading above the middle Bollinger Band, which sits at $2,139. The upper band is located at $2,923, marking a long-term resistance level. The MACD indicator remains in negative territory, but the downward momentum is decreasing.
Daily Chart Analysis
On the daily chart, the price is trading below the middle Bollinger Band at $2,640. The recent local high w
KatyPaty
Tom Lee: Ethereum may break $5,000 by the end of the year, and this cycle is expected to hit $50,000.
Tom Lee said in an interview that Ethereum could rise to $25,000–$50,000 in this cycle and may exceed $5,000 by the end of the year. According to him, ETH has been trading in the same range for five years, and prolonged accumulation could form the basis for a major breakout. If Bitcoin rises above $100,000, ETH could reach approximately $7,500.
It is important to understand: this is a forecast, not a guarantee. Traders, according to the prediction market, estimate the probability of reaching $5,000 by the end of 2026 at just 4%.
Weekly chart (1W): price below the Bollinger middle band
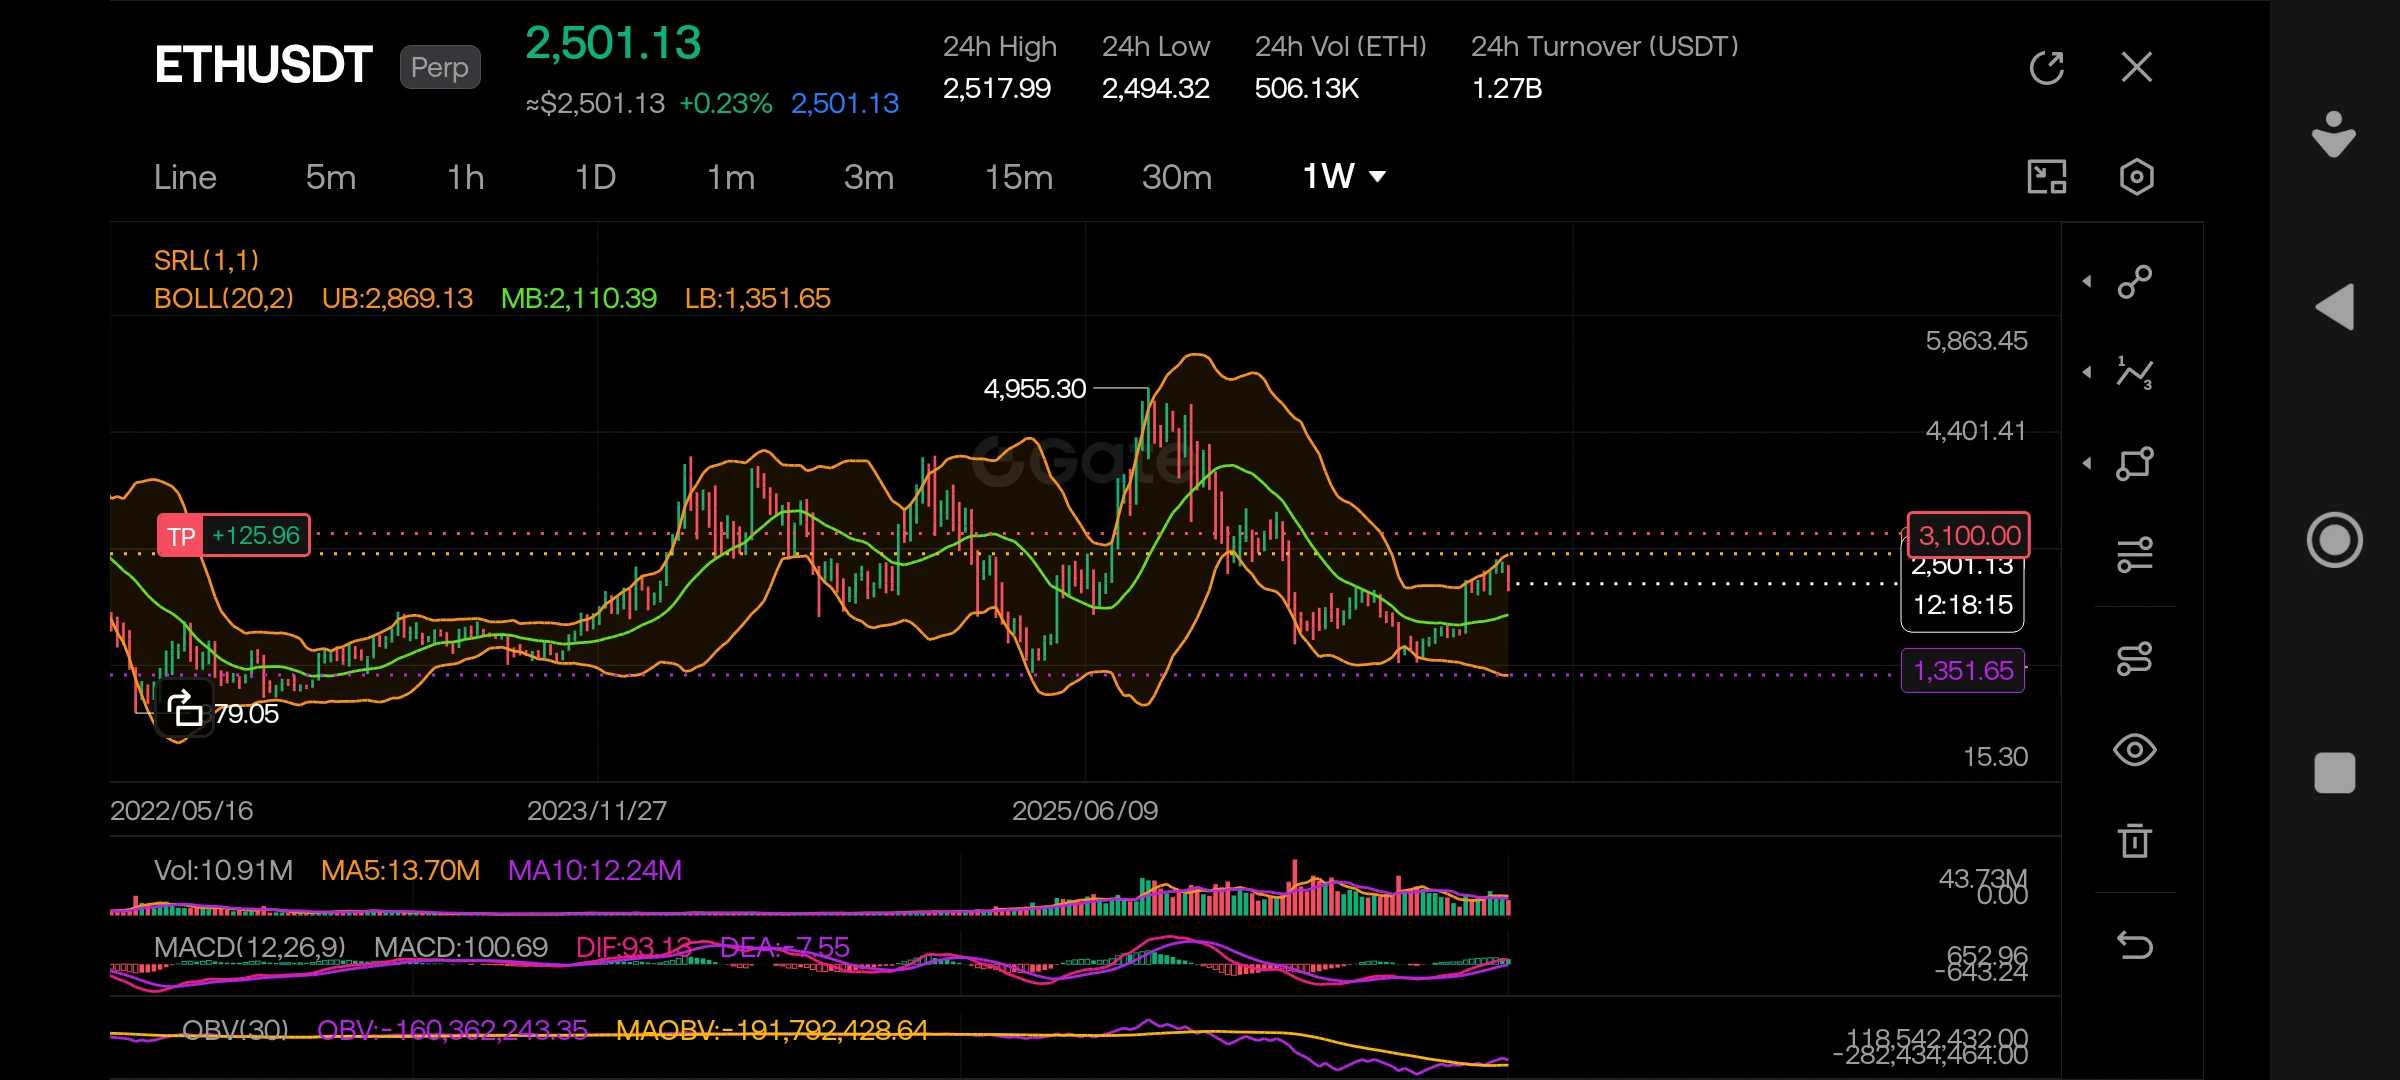
On the weekly timeframe, ETH is trading around $2,501. The Bollinger middle band (MB) is at $2,110, the upper band (UB): $2,869, and the lower band (LB): $1,351.
The price is holding above the middle band, preserving the global uptrend, but it is still far from the upper channel boundary. MACD on the weekly chart: the histogram is positive (100.69), while the DIF and DEA lines are near the zero mark, indicating weak but not negative momentum. Weekly OBV is declining, indicating a lack of significant inflows on this timeframe.
Daily chart (1D): attempt to hold above support
The daily timeframe provides a more precise picture. The price of $2,501 is below the Bollinger middle band ($2,648), which technically indicates weakness. The upper band: $2,818, and the lower band: $2,478.
MACD on the daily chart: the histogram is negative (-35.59), but the DIF and DEA lines are converging—the downward momentum is slowing. Daily OBV is also declining, indicating that selling is prevailing. The nearest support is the lower Bollinger band at $2,478; resistance is the middle band at $2,648.
4-hour chart (4H): consolidation near the lower band
On the 4-hour timeframe, the price of $2,501 is slightly above the Bollinger middle band ($2,496). The bands are: UB — $2,548, LB — $2,444.
MACD on the 4H chart is only beginning to form: the histogram is slightly positive (8.02), while DIF (-27.02) and DEA (-35.05) remain in negative territory. This indicates a possible reversal, but there is no confirmation yet. 24-hour volume is 506.13K ETH, which is below average. OBV on the 4H chart is declining, confirming the absence of aggressive buying.
Conclusion
The technical picture on the ETH charts looks neutral and cautious. The price is trapped between support at $2,444–$2,478 and resistance at $2,548–$2,648. For Tom Lee’s scenario to materialize, the upper boundary of the daily Bollinger channel ($2,818) must be broken with rising volumes. For now, the market is in a consolidation phase, and the forecast remains just a forecast and nothing more.
#EthereumUpOver71%inQ3
$ETH ‌
repost-content-media
ETH+0.98%
  • 8
  • 1
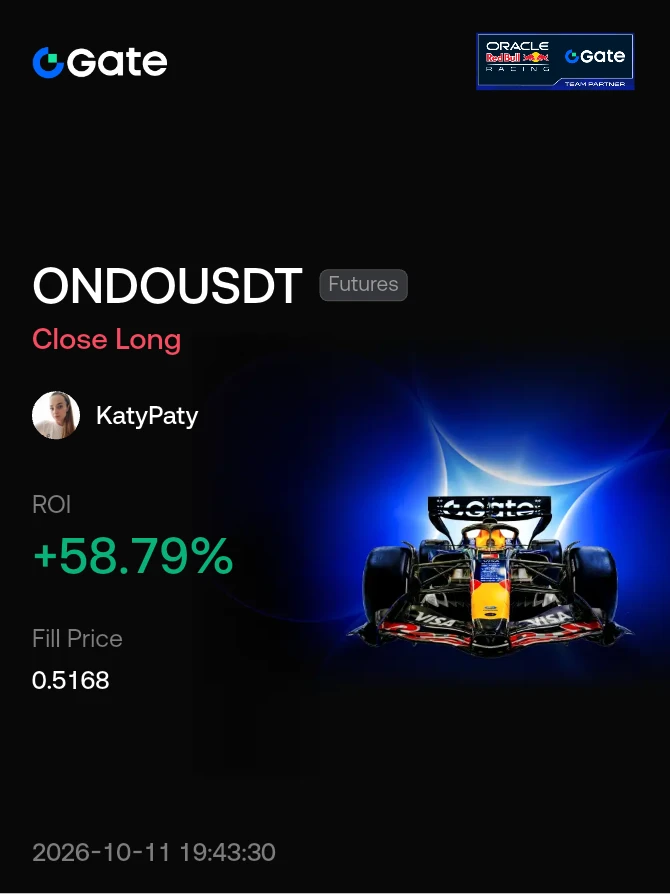
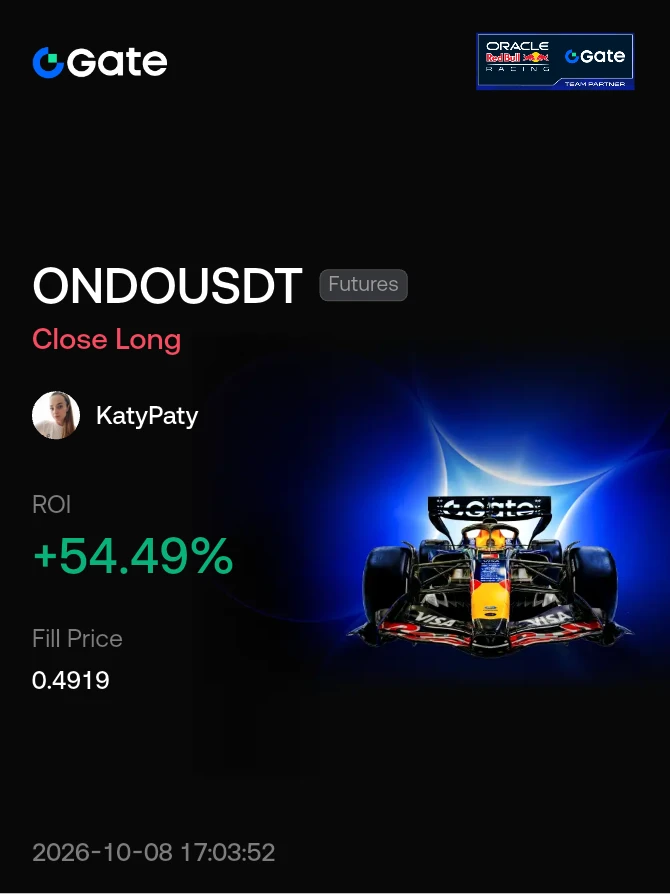
#ShareMyFuturesReturn
One love 🥰❤️ $ONDO ‌
post-image
ONDO+2.30%
  • 7
During the crypto market correction, whales increased their hold
live-replay-cover
1,717 views10-11 13:47
01:48:11
Tom Lee: Ethereum may break $5,000 by the end of the year, and this cycle is expected to hit $50,000.
Tom Lee said in an interview that Ethereum could rise to $25,000–$50,000 in this cycle and may exceed $5,000 by the end of the year. According to him, ETH has been trading in the same range for five years, and prolonged accumulation could form the basis for a major breakout. If Bitcoin rises above $100,000, ETH could reach approximately $7,500.
It is important to understand: this is a forecast, not a guarantee. Traders, according to the prediction market, estimate the probability of reaching $
KatyPaty
[Ended] Tom Lee: Ethereum may break $5,000 by the end of the year, and t
10-11 11:501,702 views
ETH+0.98%
  • 15
  • 3
Bitcoin Holds at $83,000: The Market Is Frozen in Anticipation, but Long-Term Holders Remain Calm
A day has passed since our previous analysis. The market situation has changed slightly, but the key narrative remains the same: after pulling back from the $87,380 highs, we have not seen panic selling. On the contrary, BTC has stabilized and is currently trading around $83,000. Let’s take a look at what has changed on the charts over the past 24 hours.
What the Charts Say: Consolidation Instead of a Drop
4-hour timeframe (4H):
Here we can see an attempt by the bulls to seize the initiative. The
KatyPaty
BTC Pulls Back From $87,000, but Long-Term Holders Aren't Budging! With veteran investors refusing to sell, how close is Bitcoin's next rebound?
Bitcoin has pulled back from the local high of $87,380 and is currently trading around $82,815. At first glance, this looks like a correction. But dig deeper, and the picture becomes much more interesting: while short-term traders are taking profits, those who have held BTC for years simply aren't budging.
Technical picture: where we stand
On the daily chart, the price has settled below the Bollinger middle band ($84,356), formally signaling weakness. However, the lower indicator band at $81,825 is acting as the nearest support—the price has already bounced from it. The MACD on the daily timeframe remains in negative territory, but the histogram is beginning to contract: downward momentum is weakening.
The weekly chart provides a more important signal. Despite the pullback, BTC is still trading significantly above the Bollinger middle band ($71,075) and is holding firmly in the upper half of the channel. The global uptrend remains intact; the current decline looks like a normal correction within a broader move, rather than a reversal.
Why the “old guard” isn't selling
The key reason I don't expect a deep decline is the behavior of long-term holders. According to the statistics, during the decline from $87,000, the inflow of coins to exchanges from wallets that had held BTC for six months or more remained minimal.
The figures confirm this: 81% of all existing Bitcoin supply has not moved for at least six months. That's about 16.3 million coins out of roughly 19.7 million in circulation, meaning that only a thin layer of 3–4 million BTC is actually being traded. When supply is this constrained, even a moderate inflow of capital can have a disproportionately strong effect on the price.
Institutions continue to enter
While retail investors are nervous, institutional money is at work. Spot Bitcoin ETFs attracted $240 million last week alone, while cumulative inflows since the beginning of 2026 reached $1.2 billion. In late September, U.S. ETFs experienced a nine-day inflow streak totaling around $3 billion, the strongest since October 2025. BlackRock, through IBIT, continues to collect the lion's share of this capital.
This dynamic creates an important structural backdrop: ETFs are forced to buy actual BTC on the market, while the available supply is becoming increasingly scarce.
How close is the reversal?
The market is currently caught between two forces: short-term pressure from liquidations and technical weakness, versus strong holding by long-term players and sustained institutional demand. Analysts' forecasts vary: one sees the risk of a move to $50,000 before a recovery but maintains a target of $100,000 by year-end, while another expects a 30–60% rebound from local lows within 3–6 months, with a move to $126,000.
My view: as long as the price holds $81,800–$82,000, a rebound to $86,000–$87,000 looks entirely realistic. If this level breaks, the next area of interest is around $74,000, but even there, long-term holders are unlikely to start exiting en masse. The real reversal will begin when demand from ETFs once again exceeds the supply available on exchanges, and the conditions for this are already taking shape.
$BTC ‌#BTCPullsBackTo81000
BTC-0.58%
  • 12
  • 2
Tom Lee: Ethereum may break $5,000 by the end of the year, and t
live-replay-cover
1,702 views10-11 11:50
01:41:51
  • 1
I've joined #WCTCS9 ! Click the link to join my team—let's share a 3,200,000 USDT prize pool and fight for glory! https://www.gate.com/competition/wctc-s9?page=teamCompetition&teamId=65443&ref_type=165&utm_cmp=tgv0wayw&ref=gate-KatjjkaK
post-image
  • 7
  • 3
Weekend market brief · BTC/ETH key bull-bear levels at a glance
live-replay-cover
923 views10-10 18:17
01:05:10
BTC Pulls Back From $87,000, but Long-Term Holders Aren't Budging! With veteran investors refusing to sell, how close is Bitcoin's next rebound?
Bitcoin has pulled back from the local high of $87,380 and is currently trading around $82,815. At first glance, this looks like a correction. But dig deeper, and the picture becomes much more interesting: while short-term traders are taking profits, those who have held BTC for years simply aren't budging.
Technical picture: where we stand
On the daily chart, the price has settled below the Bollinger middle band ($84,356), formally signaling weakness.
KatyPaty
[Ended] BTC Pulls Back From $87,000, but Long-Term Holders Arent Budging
10-10 18:043,260 views
BTC-0.58%
  • 9
  • 2
BTC Pulls Back From $87,000, but Long-Term Holders Arent Budging
live-cover
3,260 views10-10 18:04
Ended • No Replay
  • 1
BTC/USDT Weekend Trading Setup and Position Analysis
Current Market Data:
· Price: 82,843.8 USDT
· 24h High: 83,499.6
· 24h Low: 82,236.7
· 24h Volume: 38.81K BTC
Multi-Timeframe Technical Analysis:
1. Weekly Chart (Macro Trend):
· Price is trading above the middle Bollinger Band (71,076.8), indicating a broader uptrend.
· The MACD histogram is negative (-2,621.4) and the DIF (2,086.5) is converging toward the DEA (5,918).
· On-Balance Volume (OBV) is trending downward (MAOBV: -4,749,668.2).
· Upper resistance is located at 88,368.7. The macro trend shows decreasing buying momentum.
2. Daily C
BTC-0.58%
  • 8
  • 1
Friday BTC / ETH Market Updates
live-replay-cover
1,091 views10-09 19:04
01:11:23
Friday market brief : BTC/ETH key levels
live-replay-cover
2,989 views10-09 11:36
03:11:05
Crypto Market Analysis – October 9, 2026
Macro Backdrop
The market faced a hawkish repricing of Federal Reserve policy. The September FOMC minutes released on October 7 showed broad support for keeping rates elevated, with officials noting that a year-end hike remains on the table depending on incoming data. Fed Governor Waller reinforced this view on October 8, citing futures pricing that implied an 85% probability of at least one hike by December. Initial jobless claims came in at 197,000, below the 200,000 consensus, signaling a still-tight labor market and giving the Fed room to maintain a
BTC-0.58%
  • 8
  • 2
I've joined #WCTCS9! Click the link to join my team—let's share a 3,200,000 USDT prize pool and fight for glory! https://www.gate.com/competition/wctc-s9?page=teamCompetition&teamId=65443&ref_type=165&utm_cmp=tgv0wayw&ref=gate-KatjjkaK
post-image
  • 10
  • 2