Square
Following
Hot
News
Notifications
Profile
Share your thoughts
placeholder
Article
$TAO Aggressively short: After a sharp decline, TAO is facing strong resistance around $179–$181. A rejection here could trigger another leg down—with considerable profit potential if sellers push the price toward lower support levels. Short $TAO
Entry: 178–181
Stop loss: 185.50
Take profit 1: 174
Take profit 2: 171.50
Take profit 3: 168
Take profit 4: 165.50
Trade here $TAO : 👇
post-image
TAO+0.41%
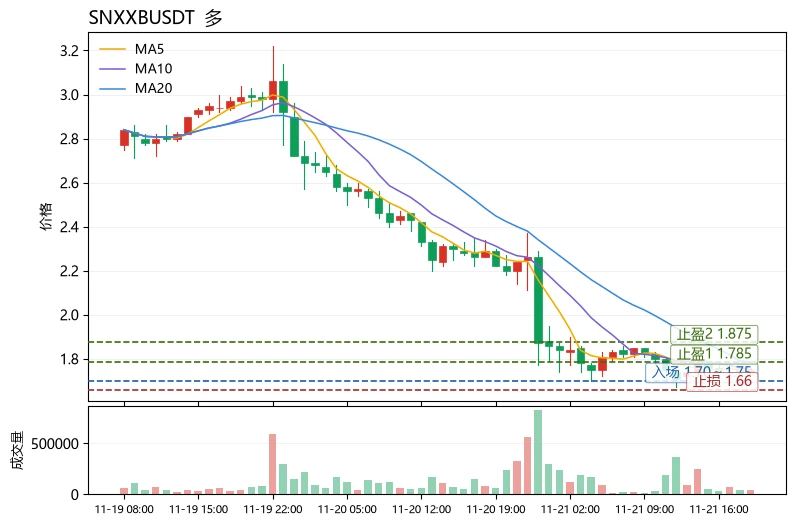
$SNXXB$SNXXB Conclusion first: This is an oversold bounce, not a trend reversal, and is only suitable for light-position short-term longs, not trend longs. The reason: The current price of 1.75 is still below MA20 (1.785). Although MA5 (1.744) is now close to the price, the moving averages have not yet formed a golden cross, and the medium-term trend has not recovered. However, the MACD histogram has turned positive (+0.02363), the price is near the lower Bollinger Band at 1.69478, and the RSI is only 32.0, in oversold territory. Combined with the extreme fear reading of 12 on the Fear & Greed
post-image
KERNEL-7.76%
BNB-0.76%
Trenches
FIONA
F
bade
b
FIONA
B34n...pump
Market Cap
$.
Change
.
24h Vol
$.
Holders
.
PIEVERSE
P
bade
b
PIEVERSE
0x0e...25a9
Market Cap
$.
Change
.
24h Vol
$.
Holders
.
mihao
m
bade
b
mihao
4Cxj...pump
Market Cap
$.
Change
.
24h Vol
$.
Holders
.
IDOL
I
bade
b
IDOL
0x3b...ab07
Market Cap
$.
Change
.
24h Vol
$.
Holders
.
CLAUDIA
C
bade
b
CLAUDIA
2j5S...W2ZM
Market Cap
$.
Change
.
24h Vol
$.
Holders
.
🚨 REKT: The overall crypto market shed $200B in under 24 hours.

$BTC ‌$ETH ‌#ShareWeekly
#BTCBreaksBelow60K
BTC-0.67%
ETH-1.26%
$LINK Are the bulls gearing up for a counterattack, with 9.9689 as the next stop?
LINK found support around 8.1060 and began showing signs of recovery. Two consecutive solid bullish candles indicate buying strength is returning.
Bullish setup entry range: 8.3647–8.4650; first target: 8.9663; second target: 9.4676; ultimate target: 9.9689; stop-loss: 7.9637
Once the price decisively breaks above 8.5380, further upside may open up, pointing to 9.4676 and even 9.9689. Conversely, a break below 8.1060 invalidates this thesis.
Is a new rally already underway?
Go long and hold $LINK$BTC $SOL
Risk
post-image
LINK-0.18%
BTC-0.67%
SOL-0.77%
Thanksgiving is in 5 days btw
post-image
  • 1
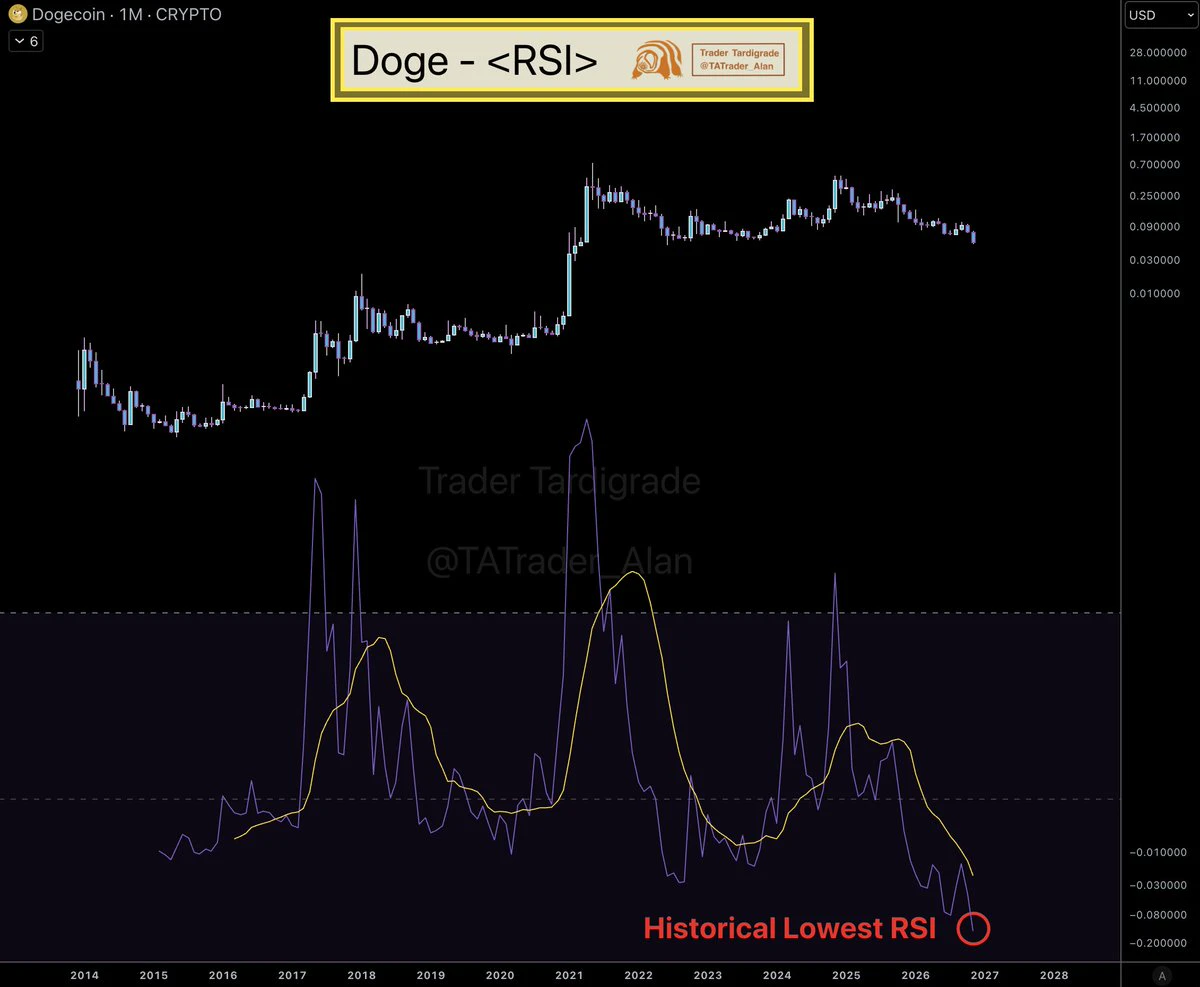
$DOGE /monthly
RSI is printing its lowest reading in history ❇️
Even the 2015 and 2022 lows never got this low. Price hasn't dropped into the oversold zone like this before.
No guarantee, but I won't sell here. I'm buying 🚀
post-image
DOGE-0.22%
Comrade, it's time to boost your energy
post-image
#ai + bots goin mental with detections
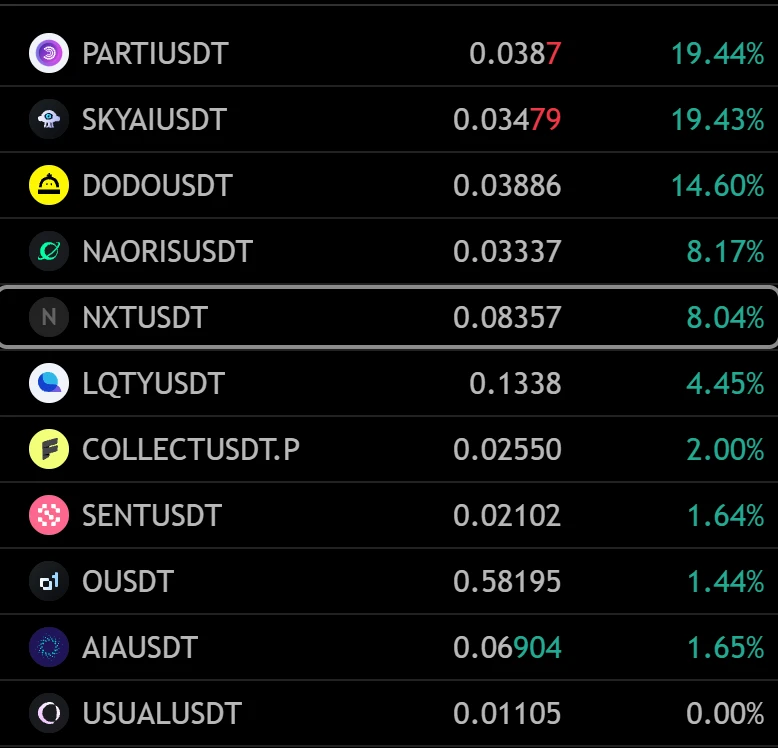
$NXT looks nice at 100D demand
$sent also combo detection
post-image
NXT-11.34%
  • 1
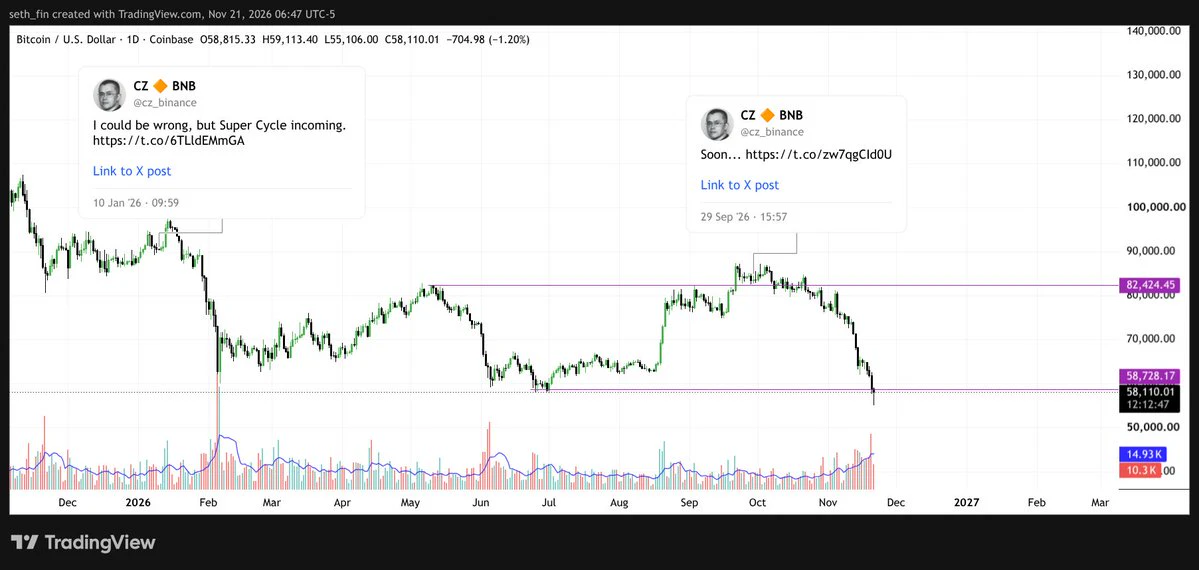
I can't believe MM managed to do this.
Pump $BTC above May high to $87K and make a higher high before dumping it back down to make a lower low to $55K.
CZ posts to his 12 million followers are spectacular.
"Super Cycle" "Soon..."
post-image
BTC-0.67%
$1000PEPE$Sun Yuchen is trapped in 1000PEPE, and the big players who bought the dip afterward are trapped too. It's okay to enter now, right?
post-image
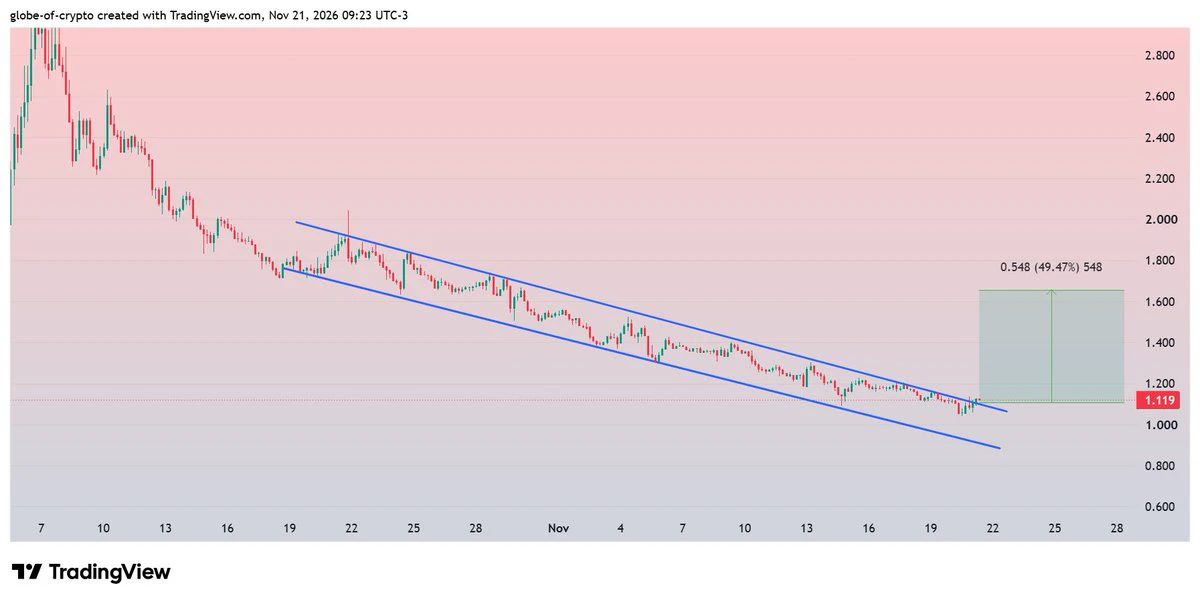
$ORCA #ORCA
Broken Descending Channel on 4H chart.
Successful retest could provide 45-50% recovery move✍️
post-image
ORCA-5.19%
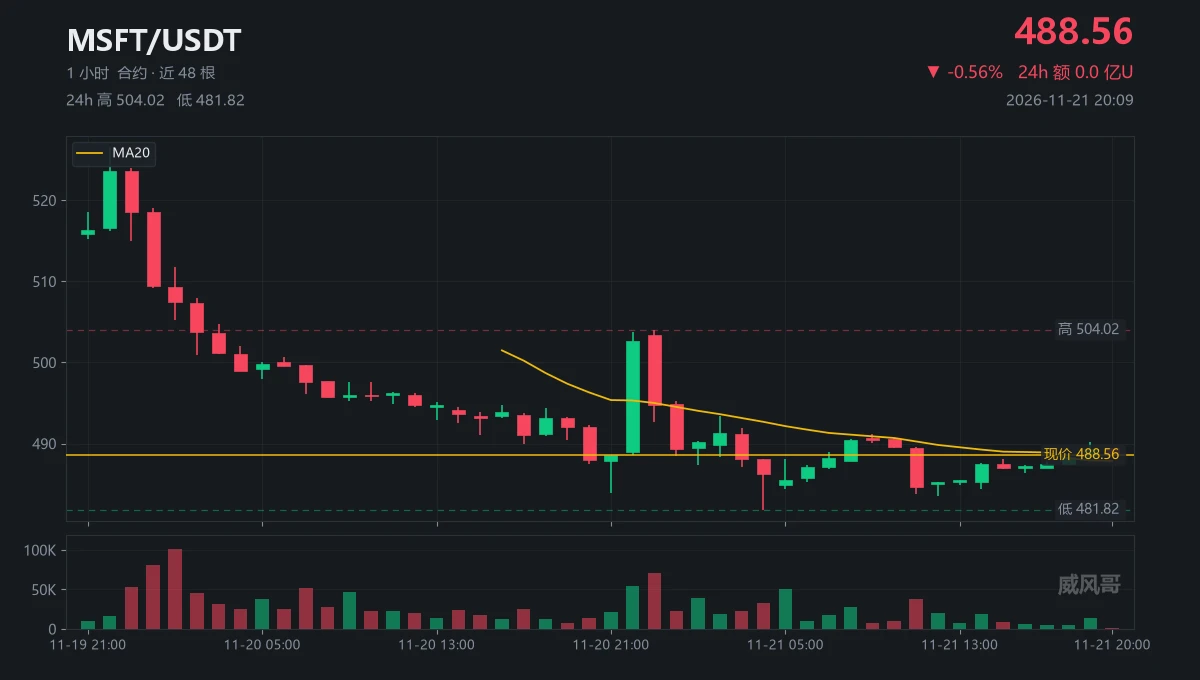
Next door, $ETH moved 100 overnight; over here, $MSFT moved 44.77 in a day.
Who’s moving, and who’s asleep?
At 22:00, that 54,000-contract candle pushed up to 503.72. Why didn’t I catch the follow-through?
At 23:00, another 70,000 contracts reached 504.02. Why did it still close at 494.81?
Two consecutive surges, neither one held. Was it a breakout, or did the train leave without picking anyone up?
When it slid to 481.82 at 04:00, where was the volume?
From 17:00 to 19:00, 24,000 contracts over three hours. Was the market closed, or was nobody watching?
Was 2.6 million U in 24-hour total vol
post-image
MSFT+0.59%
  • 1
  • 1
Arbitrum One’s Stablecoin Market Cap Increased by $327.4 Million Over the Past 7 Days
live-cover
LIVE4,403
ETH-1.26%
BTC-0.67%
SOL-0.77%
ZEC+1.16%
HYPE+0.24%
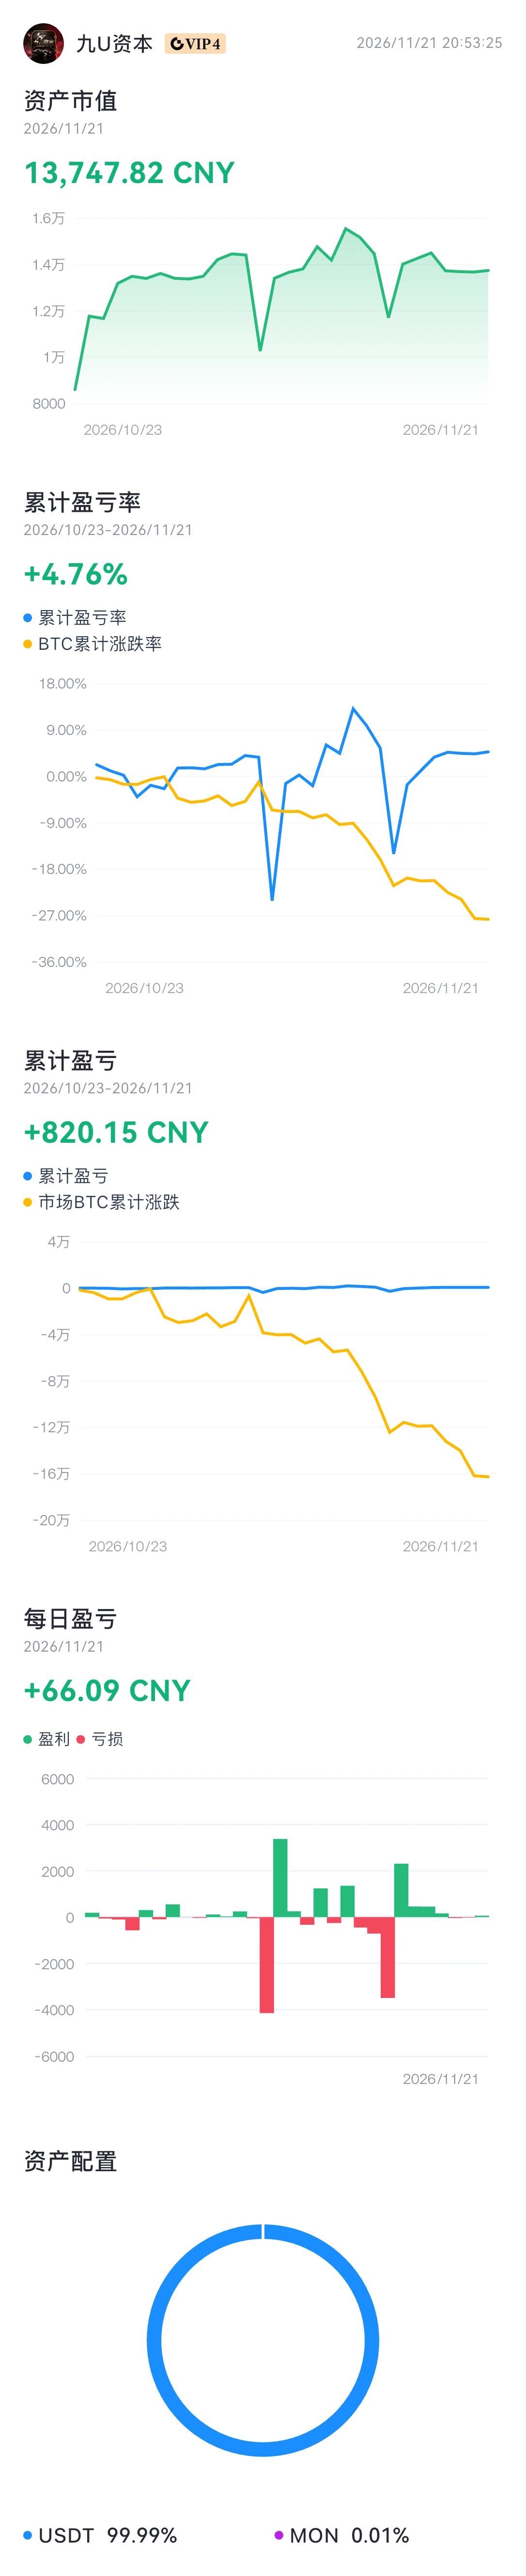
#资产分析 https://www.gate.com/wallet/assetsAnalysis
This market is so simple, so why do I have to work so hard
post-image
Finally flipped that MA99 on $JCT . Glad to see this chart finally showing some real life. Hot tokens:
$ELSA : Current price 0.0666 - 24-hour change: +12.56%
$ZEC : Current price 747.11 - 24-hour change: -10.02%
post-image
JCT-3.26%
ELSA+5.80%
ZEC+1.16%
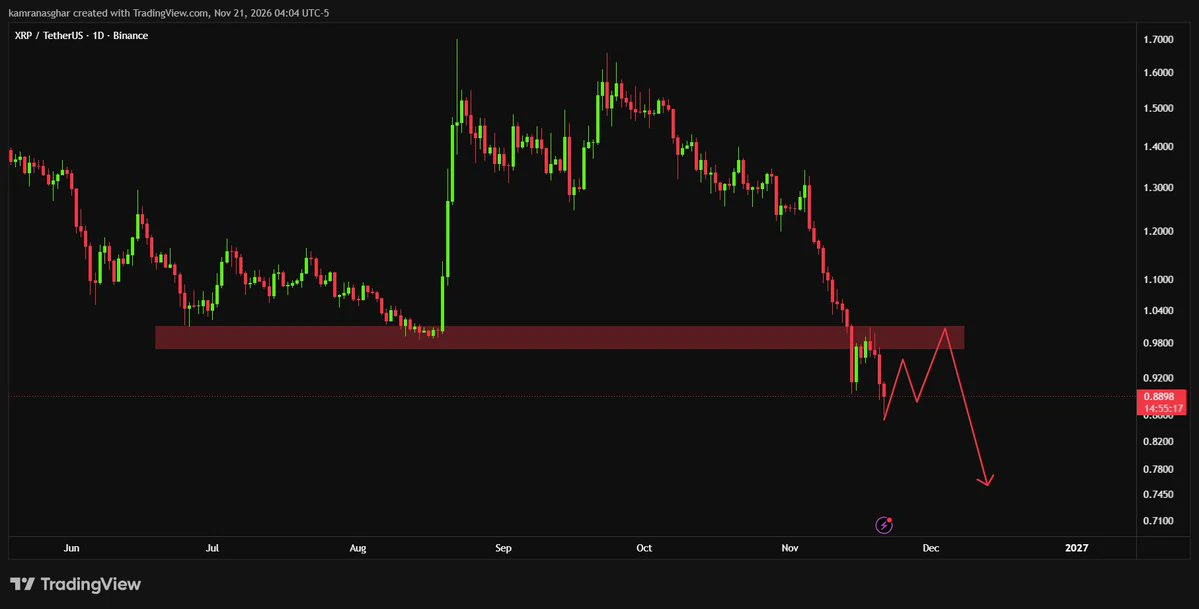
🔥 $XRP retesting broken $0.98–$1.04 supply as resistance; rejection points down toward $0.745.
post-image
XRP-1.15%
#NvidiaDropsNearly14Percent
When The Closing Bell Rang On Friday, Nvidia Was At $125.53: 14.01% Gone In One Day

When the closing bell rang on Friday, the screen showed $125.53. A day before, the close was $145.98. The gap in between was $20.45. In rate terms, 14.01%.

The day had opened at $143.52. The intraday low was $124.50. So the fall ran all day. It did not ease even in the last hour.

This is not the story of one day. This was the hardest day of a fall that has run for seven weeks.

What Happened On Friday?

On Friday, November 20, Nvidia shares fell 14.01%. This fall means a loss of
post-image
NVDA-13.84%
BTC-0.67%
  • 7
[New Streamer] Market Prediction
live-cover
LIVE1,484
BTC-0.67%
Load More

Join 40 M users in our growing community

⚡️ Join 40 M users in the crypto craze discussion

💬 Engage with your favorite top creators

👍 See what interests you

Trending Topics

BTCBreaksBelow60K

2.1M Views29.5K Discussing

BTC fell below $60,000 on November 20 for the first time since July, alongside a tech stock selloff and broader pressure on risk assets. Will $60K become resistance, or can BTC quickly reclaim it? What price or volume signals would convince you that selling pressure is easing?

GateDirectIPOPhase3ANTAllocates92100Shares

758.6K Views4.8K Discussing

NvidiaDropsNearly14Percent

318.4K Views7.5K Discussing

View More