Share crypto content and earn up to 60% commissions through content mining.
placeholder
gatefun
Ants moving house, empty empty empty$XLM
XLM is currently quoted at $0.19194, down 3.06% over the past 24 hours, but still up 25.56% over the past 7 days, indicating a high-level pullback and consolidation after a strong rally. Technically, the RSI at 42.47 is in the neutral range, while the MACD has turned negative and the price has fallen below the short-term MA7/MA30/MA120 moving averages, signaling weak short-term momentum; however, the price remains above MA200 ($0.1807), so the medium-term trend remains intact. The overall market Fear and Greed Index is as high as 81 (extreme greed), so
XLM-2.64%
View Original
post-image
XLMUSDT
Short
Cross 30X
Return %
+91.12%
Entry Price(USDT)
0.19723
Mark Price(USDT)
0.19068
  • Reward
  • Comment
  • Repost
  • Share
$ETH Signal】Go long - Buy on a confirmed pullback
$ETH 1H downside momentum is narrowing, with the current price at 2471 above the 4H EMA20. RSI is 48.26 on 1H and 62.99 on 4H. The 4H MACD histogram is at -11.7, while the 1H negative value is narrowing. Order book bid depth imbalance is -71.91%, with thick sell orders, but the price has not broken below 2450. In this structure, buying the pullback offers a clearer risk-reward ratio. Personal view: Thin bids do not necessarily mean the decline will continue; as long as key support holds, bears lack follow-through.
🎯Direction: Long
⚡Entry/limi
ETH-0.44%
View Original
post-image
  • Reward
  • Comment
  • Repost
  • Share
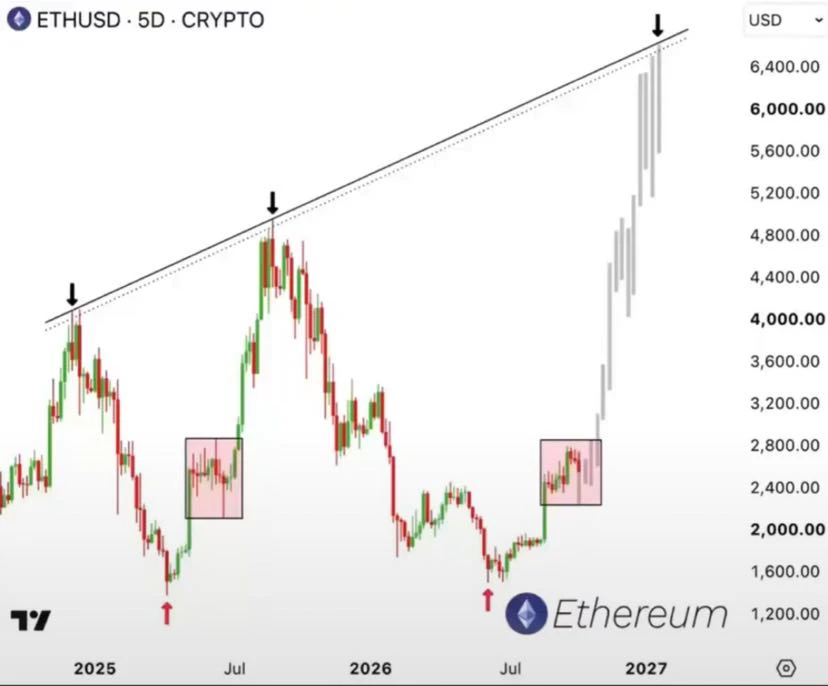
At the beginning of the rally, #Ethereum, which broke the downtrend before Bitcoin, has now also broken the 2400$ resistance. Looking at Bitcoin, it has a more bullish structure and can continue this rally up to 2950$. It will be important to hold the 2400$ level during this process. #ETH
Not investment advice.
BTC0.03%
ETH-0.34%
View Original
post-image
  • Reward
  • Comment
  • Repost
  • Share
$SUI — THE TREND IS AT A DECISION POINT
$SUI ‌
SUI is no longer fighting for momentum.
It is fighting to protect the entire rally structure.
After exploding from $0.6353 to $0.9540, SUI has entered a clear cooling phase. The rejection from the $0.95 area created a sequence of lower highs, with price now pressing directly against the most important short-term support.
The key number is:
$0.7953
That is where the battle gets serious.
THE BULL CASE
SUI needs to defend the $0.7934–$0.7953 region on a 4H closing basis.
If buyers absorb the selling and reclaim the nearby moving-average resistance,
SUI-4.75%
BTC0.03%
post-image
  • Reward
  • 1
  • Repost
  • Share
Yusfirah:
To The Moon 🌕
🔥8.25 Gold Midnight Analysis: The strategy of selling on the rebound was accurately executed in the evening, with the resistance level successfully holding and prices pulling back. The timing and entry levels were all spot on.
From the chart, the 1-hour Bollinger Bands are narrowing downward, with gold trading below the middle band; the 30-minute chart remains in consolidation, while bearish momentum in the indicators has slightly eased. Short-term movement is weak and range-bound, but the bullish structure on the larger time frame has not been completely broken.
Upper resistance: 4652‑4668
L
GLDX0.41%
PAXG-0.36%
XAU-0.30%
View Original
post-image
  • Reward
  • Comment
  • Repost
  • Share
Is this XRP pullback a fakeout or a real drop?

$XRP /USDT - SHORT

Trading plan:
Entry: 1.4633 – 1.4753
SL: 1.5265
TP1: 1.4264
TP2: 1.3978
TP3: 1.3549

Why pay attention to this setup?
- A clear SHORT signal on the 4-hour timeframe, but the 1D timeframe is still ranging. Don’t treat it as a trend trade.
- The current price of 1.4693 is hugging the EMA, while RSI (15m) is at 52.37. Neither bulls nor bears have gained momentum; wait for direction.
- Key levels: TP1 at 1.4264 below and SL at 1.5265 above, with approximately 4% room. The risk-reward ratio is decent.
- Why now? Because the 4h S
XRP-2.48%
View Original
post-image
post-image
  • Reward
  • Comment
  • Repost
  • Share
DOGE 4-hour chart, are the bears loaded?

$DOGE /USDT - SHORT

Trading plan:
Entry: 0.08837 – 0.08911
SL: 0.09225
TP1: 0.08611
TP2: 0.08435
TP3: 0.08172

Why pay attention to this setup?
- Direction: SHORT, but confidence is only 55%—this isn't the time to go all-in with a heavy position; it's time to open a small probe position.
- The 1D trend is “range-bound,” meaning don't expect a one-way waterfall; take TP1 (0.08611) and run.
- The 15-minute RSI=39.66, just entering the weak zone but not oversold, indicating that downward momentum is still being released and it hasn't reached a rebound
DOGE-2.63%
View Original
post-image
  • Reward
  • Comment
  • Repost
  • Share
#跟单日记 Six Fatal Traps That Can Lead to Liquidation in Copy Trading
1. Being Misled by a Fake Win Rate—The Illusion of a High Win Rate Created by “Stubbornly Holding”
Many lead traders display win rates of 90% or even higher, but behind them is a strategy of not closing losing positions and stubbornly holding them to the end.
While a position is being held, the unrealized loss is not counted as a realized loss, making the win-rate data look good. But once the market continues moving against you, the copy trader’s margin runs out first—the lead trader may have enough capital to hang on, while yo
4-0.43%
View Original
post-image
  • Reward
  • 2
  • Repost
  • Share
Falcon_Official:
LFG 🔥
View More
$SOL V Signal】Long, volume contracts on pullback, 1H support holds
$SOLV 1H rallied and retreated, with insufficient support above 2.8440; current quote is around 2.8440. The 4H MACD bullish momentum is contracting, and the 1H is weakening in sync. The 4H RSI remains warm at 61.25, but the 1H RSI has weakened to 56.03. The order book bid-ask depth ratio is 0.95, with selling pressure slightly prevailing. The funding rate is 0.0050%, and market sentiment is neutral. Volume surged to 1.18 billion before shrinking sharply, cooling short-term chasing interest. Long-short divergence is increasing a
SOLV4.49%
BTC0.03%
ETH-0.34%
SOL2.01%
NVDA1.78%
View Original
post-image
  • Reward
  • Comment
  • Repost
  • Share
#$SNDK #SNDK
SNDK has entered a major correction after an extraordinary rally, dropping around 9.7% from the previous close of $1,596.08 to approximately $1,441 in premarket trading.
The stock is still up roughly 507% year to date and nearly 2,982% over the past year, but the recent five-day decline of around 19.3% shows that momentum has changed sharply.
The key question now is whether $1,441 is a temporary reset or the beginning of a much deeper correction.
The first price zone to watch is $1,450–$1,440.
If buyers can stabilize SNDK around these levels, the stock could attempt a quick re
SNDK0.20%
post-image
  • Reward
  • Comment
  • Repost
  • Share
market updates
gate liveLIVE
1,459
  • Reward
  • Comment
  • Repost
  • Share
The evening market indeed tested support near 4600 on the downside. It will most likely continue fluctuating within the 4600—4645 range tonight. For tonight’s trading, you can try selling high and buying low within the range; do not chase rallies or sell in panic! #黄金 #伦敦金 $XAUUSD
XAUUSD-0.16%
View Original
post-image
  • Reward
  • Comment
  • Repost
  • Share
$93.9 billion “safety net” — NBM is rewriting the script for memory chips
What is the biggest headache in the memory chip industry? Not outdated technology, not insufficient demand—it’s cyclicality.
When prices soar, profits are enormous; when prices plunge, losses are painful. At its worst in history, SNDK’s gross margin fell below 20%. But this time, SNDK may have genuinely found a way to break the cycle—NBM’s new business model.
Put simply, NBM means long-term agreements—signing contracts with customers for more than four years to lock in minimum purchase volumes and floor prices. It has cu
SNDK0.20%
View Original
post-image
post-image
  • Reward
  • Comment
  • Repost
  • Share
#GateStockInsightsChallenge
$NAS100 is recovering, but the chart still needs confirmation before I would call this a fresh bullish leg. The index is trading around the 29,100–29,200 area, after defending the lower 29K region and rebounding from Monday's weakness. The seven-day structure is still slightly negative because NAS100 remains below the 29,500 area where the previous breakdown developed. For me, the current market is less about predicting direction and more about watching which side wins the next liquidity battle.
The first major resistance sits between 29,300 and 29,500. Today's rec
NAS1000.11%
post-image
  • Reward
  • Comment
  • Repost
  • Share
#GoldmanSachsBullishOnCXMT
CXMT (688825.SS) has delivered one of the most explosive semiconductor rallies of 2026.
From its ¥8.66 IPO price, the stock surged more than 465% on its first trading day, closing near ¥49.01, and subsequently pushed toward the ¥61.80 all-time high. From the IPO price to ¥56.60, the gain is approximately 554%, meaning investors who bought at ¥8.66 saw the stock rise by nearly ¥47.94 per share. This is no longer a normal post-IPO move; CXMT has entered a high-momentum, high-volatility phase where fundamentals, AI-memory demand, valuation and China’s semiconductor st
post-image
  • Reward
  • Comment
  • Repost
  • Share
$SOL
$SOL — THE $100 BATTLE ISN’T OVER YET
Solana is showing something important in a mixed market: relative strength.
After surging from $75.21 to $103.14 in just seven days, SOL experienced a sharp rejection near the psychological $100 area and briefly dropped to $94.79. Instead of collapsing, however, buyers stepped back in and pushed price toward $98.
That reaction matters.
The pullback looks more like profit-taking and leverage cleanup than a confirmed trend reversal.
THE KEY ZONE
The first level bulls need to defend is $97.72, where the 4H EMA10 sits.
Holding this area keeps the recov
SOL2.01%
post-image
  • Reward
  • 1
  • Repost
  • Share
Yusfirah:
To The Moon 🌕
Grayscale launches first Zcash ETF with direct ZEC exposure
Grayscale has launched the first exchange-traded fund offering direct exposure to Zcash, bringing the privacy-focused cryptocurrency to NYSE Arca under the ticker ZCSH.
Grayscale said Tuesday that the Zcash ( $ZEC ) ETF began trading as a conversion of its existing Grayscale Zcash Trust, giving investors access to ZEC through an exchange-traded product without requiring them to directly hold the cryptocurrency.
The fund carries a 2.5% annual sponsor fee. A Grayscale spokesperson said revenue collected from the fee will be directed bac
ZEC-3.02%
post-image
  • Reward
  • Comment
  • Repost
  • Share
Support at $1,400 and resistance at $1,600—what does technical analysis tell us?
Having discussed the fundamentals, let's take a look at the technicals. After all, even the best stock can be painful if you buy at the wrong price.
SNDK has fallen all the way from its $2,354 high. During the trading session on August 24, it briefly wicked down to around $1,419. But interestingly, buying support was very evident around $1,420. After breaking below $1,500, the price did not continue its breakdown and selloff, but instead quickly rebounded to around $1,526.
What does this tell us? It tells us that
SNDK0.20%
View Original
post-image
post-image
  • Reward
  • Comment
  • Repost
  • Share
$8.97 billion in revenue, 84.6% gross margin—how strong are SNDK’s fundamentals really?
Now that we’ve covered who’s selling, let’s take a look at whether SNDK’s fundamentals are really worth catching this falling knife for.
SanDisk has just delivered an absolutely terrifying earnings report. Fourth-quarter fiscal 2026 revenue was $8.97 billion, up 372% year-over-year and 51% quarter-over-quarter, far exceeding market expectations of $8.4 billion. Adjusted earnings per share came in at $39.25, nearly 18% above the expected $33.28. Full-year revenue was $20.25 billion, up 175% year-over-year. G
SNDK0.20%
View Original
post-image
post-image
  • Reward
  • 1
  • Repost
  • Share
Blessedpikin:
this is insightful. keep it coming
Load More

Join 40 M users in our growing community

⚡️ Join 40 M users in the crypto craze discussion
💬 Engage with your favorite top creators
👍 See what interests you
  • Pinned