Square
Following
Hot
News
Notifications
Profile
Share your thoughts
placeholder
Article
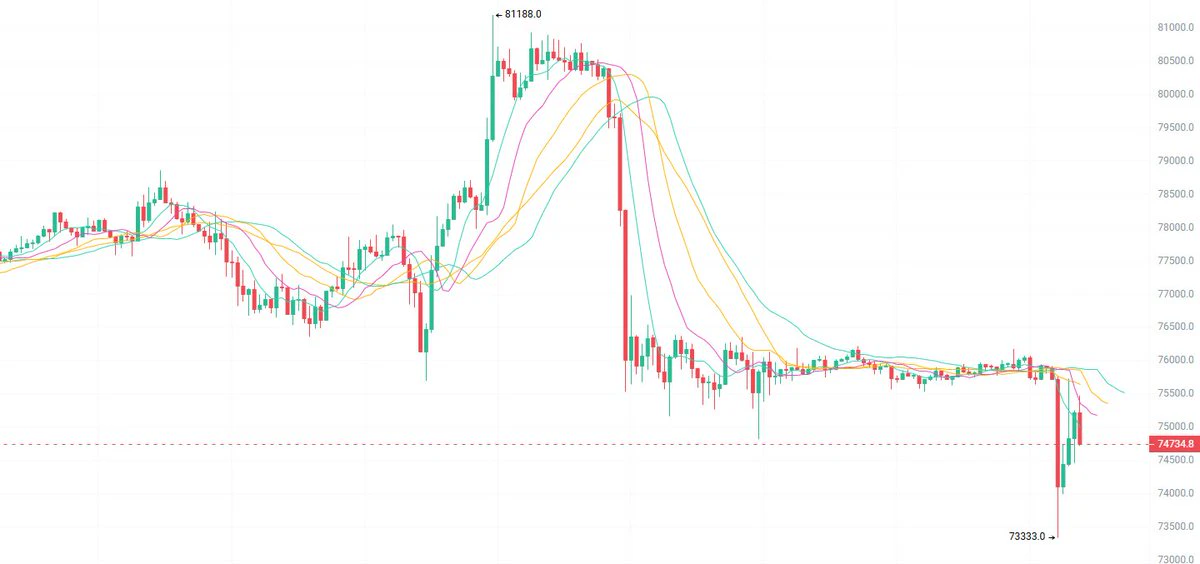
On Nov. 9, BTC’s rebound is facing resistance around 75,500. Look for a move down to 74,000/73,300.

For those looking to go long, wait for price to stabilize near 73,300 before entering. Set a stop at 72,800, with targets at 74,500/75,000.

On the 1-hour chart, price has plunged from the high of 81,188. The previous consolidation support at 75,800 has given way. After briefly dipping to 73,333, price rebounded.

However, the moving averages remain bearishly aligned, and 75,000/75,500 are short-term resistance. For now, treat the rebound as a corrective bounce. $BTC #BTC
post-image
BTC-0.67%
I used to worry about whether AI would take people's jobs. If AI can truly work independently, how should it collect the money it earns?
Have an Agent write code, create designs, analyze data—it can indeed get things done. But what happens afterward?
Who assigns it work? How does it set prices? How do clients pay? If the deliverable is unsatisfactory, who handles it?
This is the hurdle an Agent must clear to go from “a tool that can do work” to “a service provider that can make money.”
I recently saw an update from @termix_ai, and I think it addresses exactly this problem.
TermiX has launched
post-image
Trenches
ZIG
Z
bade
b
ZIG
0x8c...1145
Market Cap
$.
Change
.
24h Vol
$.
Holders
.
BTC
B
bade
b
BTC
C5xp...pump
Market Cap
$.
Change
.
24h Vol
$.
Holders
.
STONK
S
bade
b
STONK
6GmA...UNgx
Market Cap
$.
Change
.
24h Vol
$.
Holders
.
ANSEM
A
bade
b
ANSEM
9cRC...pump
Market Cap
$.
Change
.
24h Vol
$.
Holders
.
CLAUDIA
C
bade
b
CLAUDIA
2j5S...W2ZM
Market Cap
$.
Change
.
24h Vol
$.
Holders
.
#美国10月CPI即将公布 #WCTCS9 If October CPI comes in above expectations, the market will further scale back rate-cut expectations, but this time the more important question is whether there will be a rate hike in December. Interest rate futures are currently pricing in nearly an 80% chance of a December rate hike.

What’s special about this data
Only month-over-month figures will be released: The government shutdown last October left no price base for comparison, so no official year-over-year figure will be published. The focus is entirely on the month-over-month numbers.
Market expectations: Headlin
NAS100-0.07%
SPX+0.33%
BTC-0.67%
GLDX-0.40%
PAXG+0.37%
  • 4
I hadn’t checked in for a few days, and Magpie has already gone through 375 versions. Absolutely insane.
post-image
Jensen Huang: I just made the mistake every man in the world makes
post-image
Why does trading more frequently make profits easier to erode?

Some traders believe that constantly looking for opportunities can increase their chances of making a profit.

But in reality, every trade can incur new costs. The more trades you make, the more these costs can accumulate.

Even a strategy that is fairly good at predicting market direction may fail to deliver the desired net returns if it trades too frequently.

I. Fees: They may seem small each time, but can add up

Suppose the combined cost of buying and selling each time is 0.10% of the trade's notional value.

If the notional
post-image
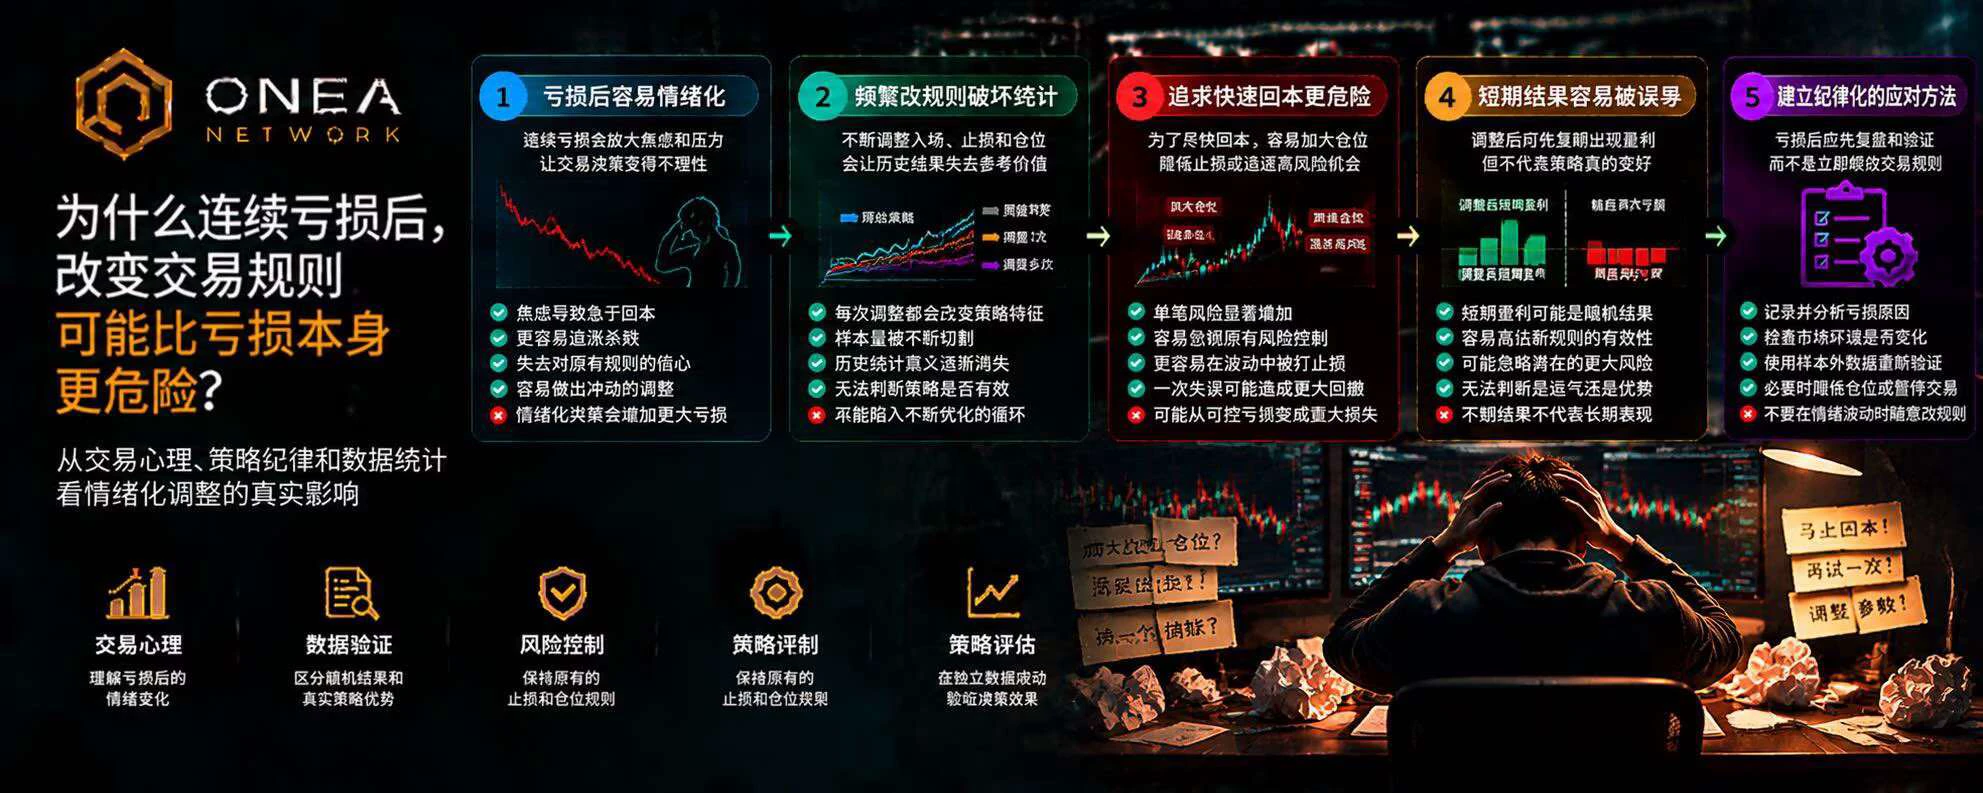
Why can changing trading rules after consecutive losses be more dangerous than the losses themselves?

Many traders don't lose to the market; instead, after consecutive losses, they gradually abandon the trading discipline that originally worked.

First loss: They think it was just bad luck.

Second loss: They start to doubt the strategy.

Third loss: They change their stop-loss, adjust parameters, and increase their position size.

Fourth loss: They completely overturn their original trading system.

The question is: Are you optimizing your strategy, or trying to escape the discomfort of losi
post-image
🔹Democrats Sweep Congress: Is a Major Shift Coming for Crypto? Tighter SEC Oversight and Prediction
live-cover
LIVE2,608
  • 1
#70%OfAltcoinsFallBelow200DMA #ShareWeekly
70% of Altcoins Fall Below the 200-Day Moving Average: A Market Warning or Opportunity?

The Altcoin Market Faces Growing Technical Pressure
The cryptocurrency market is experiencing a challenging period as approximately 70% of altcoins fall below their 200-day moving average (200DMA). This development highlights increasing weakness across the altcoin sector and raises important questions about the market's long-term direction.
The 200-day moving average is one of the most widely followed technical indicators in financial markets. It helps investors
BTC-0.67%
How do you set a reasonable risk-reward ratio in BTC trading? Win rate isn’t everything!
In BTC trading, many people focus heavily on win rate, believing that as long as they make the right call often enough, they can keep making money. But in reality, win rate isn’t the only factor that determines trading results. A trading system with a lower win rate but a reasonable risk-reward ratio may still maintain positive expectancy over the long term.
So, what is the risk-reward ratio?
First, understand the concept of risk-reward ratio. It is the ratio between the potential profit and potential loss
post-image
BTC-0.65%
A blood-curdling cry: Anyone telling you to buy the dip now is either stupid or bad—not just bad, but downright evil. Who knows what level of the eighteenth-tier hell the bottom is at! Around Chinese New Year, after the Democratic Party takes the stage at the Two Sessions, Bitcoin will definitely be in the 40s. Remember, I’m not saying it’s possible—I’m saying it’s certain.......
post-image
BTC-0.67%
$ETH
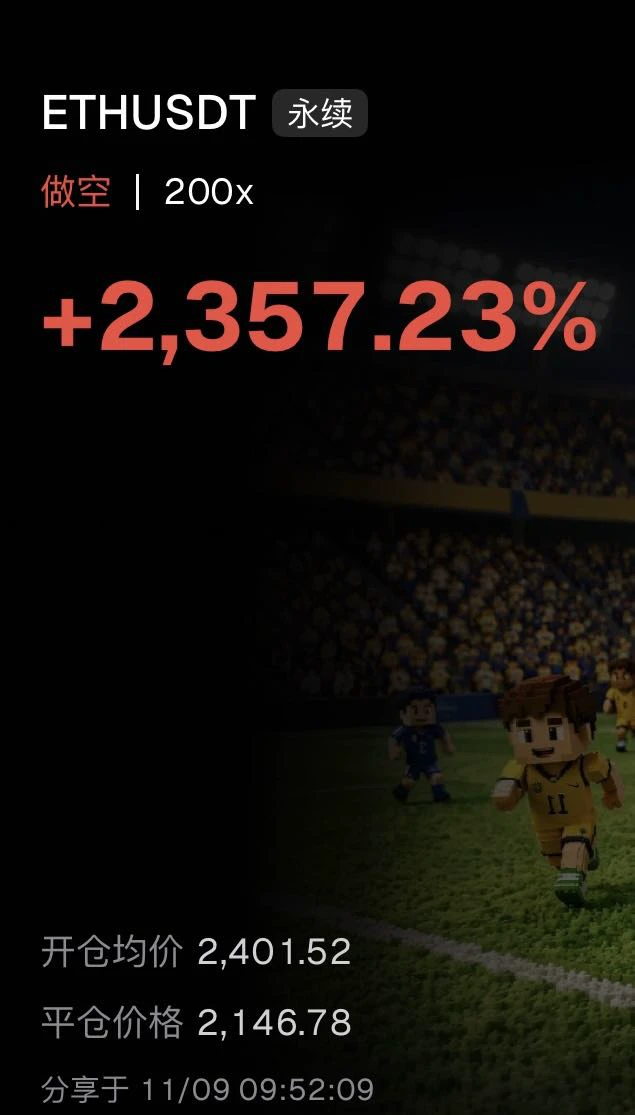
Another win in the bearish market, with a single trade returning 23x
The major downtrend channel fully opened up. We positioned short around 2401.52 on the rebound, trading with the trend. The market remained under pressure and continued to weaken, allowing us to take profit at 2146.78 and capture the full decline of over 250 points. The 200x leveraged short trade earned a 2357.23% return in a single trade.
#70%山寨币跌破200日均线
Support levels have been breached one after another, and the bearish trend is far from over. Every rebound is an opportunity to enter short at a higher level.
Identif
post-image
ETH-1.26%
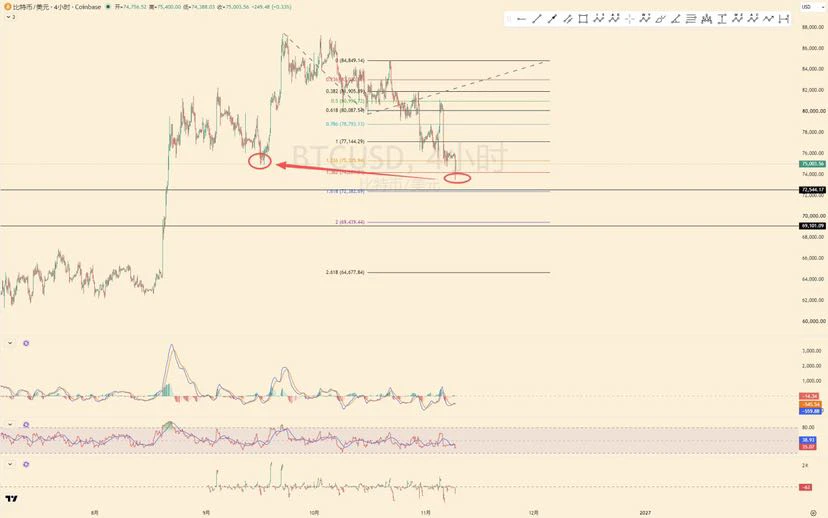
From the perspective of the corrective structure (if this is a correction), I think BTC has basically completed the move:
#BTC闪崩插针
1, The first leg down was 87-80, followed by a rebound; the second leg down was 85-735;
$BTC
2, ① The second leg down has already exceeded a 1:1 move relative to the first leg down. The wick has now reached 1.382; if it drops further and hits 1.618, the structure will be invalidated; ② The wick to 735 broke below the Wave 4 low of the previous upward move, where there should be a large number of stop-loss orders.

The corrective pattern has played out fully, and
post-image
BTC-0.65%
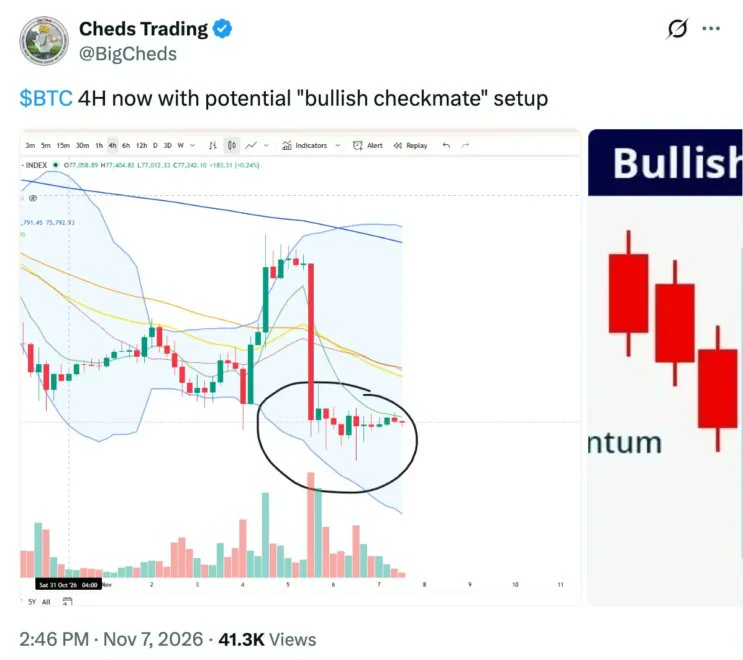
Bitcoin Technical Analysis: Bullish Checkmate Setup Near $76K
Bitcoin is going quiet after a violent week, and chart watchers think that calm could be the setup for the next move higher.
Our Bitcoin technical analysis shows that currently, BTC is trading at $75,865, down 0.41% on the day, inside a tight range between $75,645 and $75,979. That is a 0.4% daily range after a week in which Bitcoin was knocked back to the critical $76,000 level by the AI-driven sell-off.
⚠️ Personal market analysis only. NFA — manage risk and DYOR.
Educational content, not investment advice or a recommendation to b
post-image
BTC-0.67%
#USAIStocksHitHard
A 5% Nasdaq collapse is not merely a correction; it is a stress test for the entire AI investment thesis.

Thursday’s historic sell-off, which saw the Nasdaq Composite plunge over 5% with semiconductor leaders like NVDA and AMD leading the decline, marks a pivotal moment in market psychology. This was not a routine pullback driven by minor earnings misses or seasonal rotation. It was a broad-based liquidation event that forces investors to confront a critical question: Is this short-term deleveraging after an extended rally, or are we witnessing the beginning of a fundament
post-image
NVDA-0.35%
AMD+3.29%
SPX+0.33%
  • 1
Apple is also stepping up its AI arms race! The CEO is personally urging the software team, and Siri
live-cover
LIVE1,724
A brief analysis of BTC’s short-term trend through Dow Theory, Chan Theory, Elliott Wave Theory, volume-price analysis, order flow, and price action
The 74,791 defense has officially failed! After the November 5 fakeout top #2 at 80,838 (-4.716 billion/36 billion in epic selling), BTC broke below 75,000 on November 6, reaching 74,791. After two days of “ultra-low-volume consolidation” on November 7–8 (3.7 billion + 4.9 billion), the market broke down: early on November 9, it fell to 74,394, officially breaking below the 74,791 panic low. The C-wave target of 72,000–74,000 is now within range,
BTC-0.67%
The washout is completely over, and the main rally could ignite at any moment. Don’t hesitate any longer, folks🤩
Current strategy: Go long directly🔥🔥
First target: 0.21 Second target: 0.25 Third target: 0.3-0.5 Stop-loss level: 0.141
$JCT $AIOT should also remain on your watchlist.
Risk warning: The above is solely my personal market opinion and does not constitute investment advice. Contract trading carries extremely high risk, so please be sure to manage your position size.
post-image
GTC
GTC芝麻币
Gate.Fun
MC:$0.1Holders:1
0%
JCT-3.26%
AIOT-2.28%
  • 1
Backtest profits, live trading losses: How can you tell whether it’s an execution problem or the strategy has stopped working?

Why does a strategy that performs well on historical data produce completely different results once real money is put to work?

After incurring losses, many traders’ first reaction is to change parameters, add indicators, or even scrap the entire strategy.

But the problem could lie at different stages. Making blind adjustments without identifying the cause may only make the strategy increasingly complex.

I. Step One: Compare Key Backtest and Live Trading Metrics

Fi
post-image
Load More

Join 40 M users in our growing community

⚡️ Join 40 M users in the crypto craze discussion

💬 Engage with your favorite top creators

👍 See what interests you

Trending Topics

USCPIDataIncoming

21.09k Views1.72k Discussing

The U.S. October CPI report will be released on November 10 at 8:30 a.m. ET. September CPI came in at 3.7% year over year, and markets will be watching closely for signs that inflation is cooling, especially in core CPI. A softer-than-expected reading could strengthen rate-cut expectations, while hotter inflation may pressure risk assets through higher Treasury yields and a stronger dollar. How do you think this CPI print will move $BTC, U.S. stocks and gold?

BTCFlashCrash

11.44k Views66.03k Discussing

USAIStocksHitHard

31.15k Views3.75k Discussing

View More