









#WCTCS9 BTC Market Analysis
Bitcoin Price Nears $75.6k Danger Zone as ETF Investors Pull $398 Million
On Tuesday (November 3), the leading cryptocurrency BTC was trading at around $76,585 as investors assessed the decline in inflows into spot Bitcoin exchange-traded funds (ETFs) and the potential market impact of stolen assets moving between blockchain networks. Technical indicators also show that Bitcoin's rebound remains fragile, with analysts closely watching support at $75,597 for signs of a deeper correction.
Bitcoin ETF outflows signal weakening institutional investor interest
Institutional demand for Bitcoin appears to be losing momentum as investors continue to reduce their exposure to crypto investment products. According to SoSoValue, U.S. spot Bitcoin ETFs recorded net outflows of about $202.59 million in the final week of October. Outflows continued this week, with $398.26 million leaving the funds on Monday, reflecting cautious positioning by institutional investors. The outflows come as overall ETF demand deteriorated this month. October ended with net outflows of $515.03 million, breaking a three-month streak of monthly inflows. This reversal suggests institutional investors are becoming less willing to accumulate Bitcoin amid rising market uncertainty.
For Bitcoin, weakening institutional demand and uncertainty around stolen assets are creating an unfavorable environment for a sustained rebound.
Bitcoin weekly chart shows $75,597 as key support. After four consecutive weeks of declines, Bitcoin's technical outlook remains cautious. Bitcoin fell about 2.25% last week, and the decline continued into Tuesday's session, with the price currently trading around $76,500.
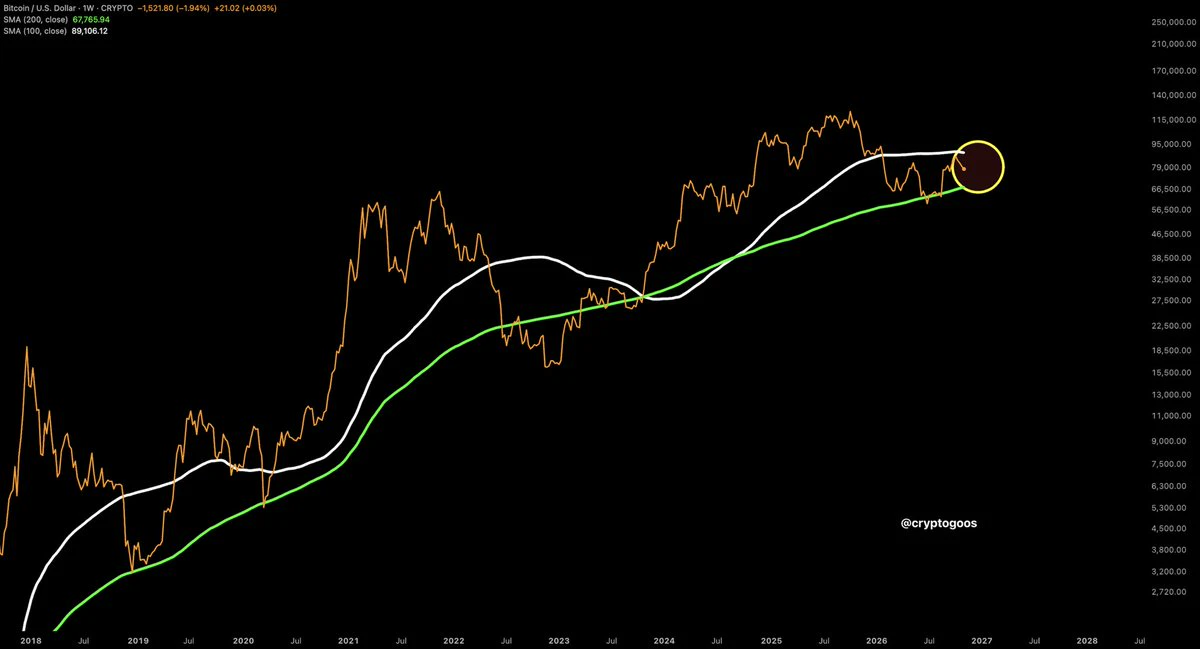
On the weekly chart, the next major downside target is near $75,597, corresponding to the 50-week simple moving average (SMA). A sustained break below this level, especially a weekly close below it, could accelerate bearish momentum and put the 200-week SMA (around $67,776) at risk.
Momentum indicators also show buyers are weakening. The weekly Relative Strength Index (RSI) is near 49, slightly below the neutral threshold of 50. While this reading does not confirm strong bearish momentum, it indicates that the previous bullish advantage has substantially diminished.
Meanwhile, the Moving Average Convergence Divergence (MACD) histogram remains in positive territory, but its bars are shrinking, indicating that upward momentum is fading.
Overall, these indicators show that buying momentum is weakening, rather than confirming a long-term bearish reversal. On the positive side, Bitcoin must first reclaim the 61.8% Fibonacci retracement level at around $78,661. A sustained recovery above this resistance could pave the way toward the 50% Fibonacci retracement level at $87,823, followed by the 100-week simple moving average near $89,134. However, buyers may need stronger institutional participation and improved market sentiment to support such a move. Bitcoin's daily chart presents a relatively more balanced outlook, although bearish momentum remains evident.
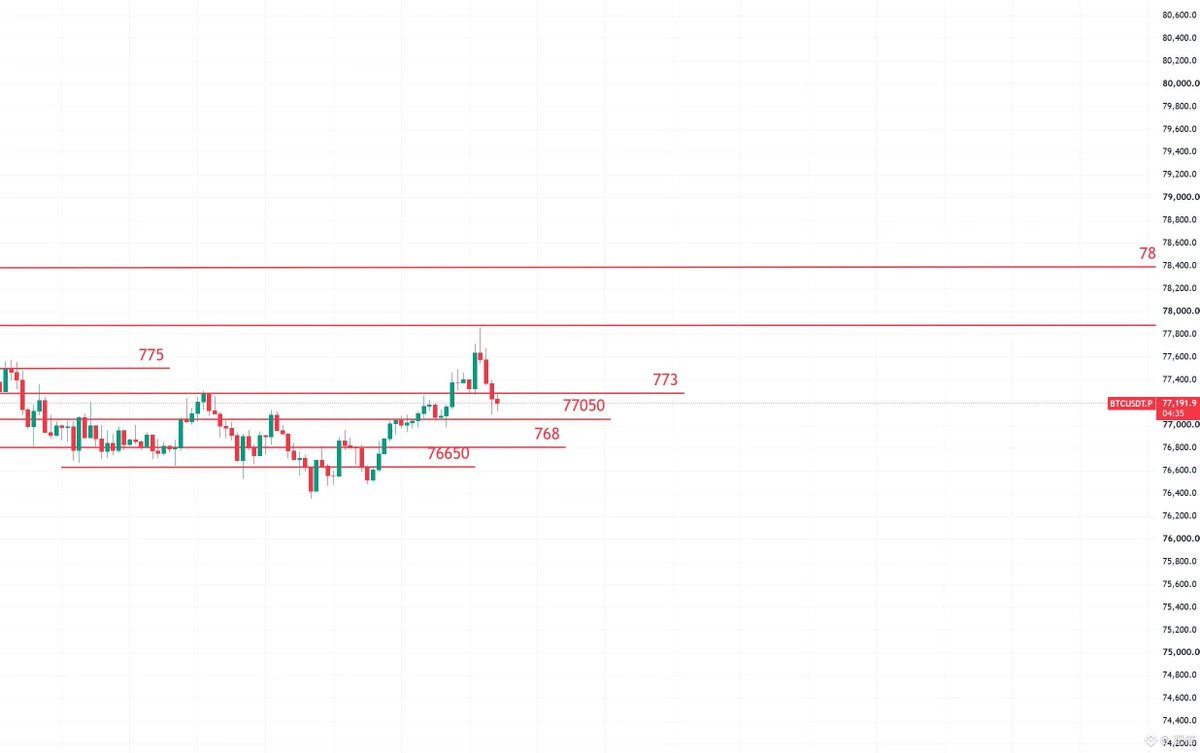
Bitcoin is currently priced around $76,587, slightly above its 200-day exponential moving average (EMA) of about $76,466. This moving average provides significant support and could prevent a deeper correction.
In addition, Bitcoin remains below the 100-day exponential moving average (EMA) at $77,821 and the 50-day EMA at around $80,287, indicating that sellers continue to dominate the short-term trading range. The daily RSI is near 34, reflecting weak buying momentum and intensifying bearish pressure.
Likewise, the MACD histogram remains below zero, indicating that downward momentum has not fully faded. For a meaningful rebound, Bitcoin needs to reclaim the $80,287 resistance level. A successful break above it could encourage bulls to target the psychological $85,000 level.
Bitcoin's current price has fallen below the 100-day EMA at $77,821, making the 200-day EMA (around $76,466) the next key support. A break below the 200-day EMA would further weaken Bitcoin's medium-term technical structure and increase the likelihood of a broader correction. A recovery above $78,661 could provide an initial sign that buyers are returning; but reclaiming $80,287 would be stronger evidence that momentum is improving. On the other hand, continued ETF outflows, further escalation in market uncertainty, or a break below $76,466 could prompt sellers to target weekly support near $75,597.#广场交易达人 $BTC
Bitcoin Price Nears $75.6k Danger Zone as ETF Investors Pull $398 Million
On Tuesday (November 3), the leading cryptocurrency BTC was trading at around $76,585 as investors assessed the decline in inflows into spot Bitcoin exchange-traded funds (ETFs) and the potential market impact of stolen assets moving between blockchain networks. Technical indicators also show that Bitcoin's rebound remains fragile, with analysts closely watching support at $75,597 for signs of a deeper correction.
Bitcoin ETF outflows signal weakening institutional investor interest
Institutional demand for Bitcoin appears to be losing momentum as investors continue to reduce their exposure to crypto investment products. According to SoSoValue, U.S. spot Bitcoin ETFs recorded net outflows of about $202.59 million in the final week of October. Outflows continued this week, with $398.26 million leaving the funds on Monday, reflecting cautious positioning by institutional investors. The outflows come as overall ETF demand deteriorated this month. October ended with net outflows of $515.03 million, breaking a three-month streak of monthly inflows. This reversal suggests institutional investors are becoming less willing to accumulate Bitcoin amid rising market uncertainty.
For Bitcoin, weakening institutional demand and uncertainty around stolen assets are creating an unfavorable environment for a sustained rebound.
Bitcoin weekly chart shows $75,597 as key support. After four consecutive weeks of declines, Bitcoin's technical outlook remains cautious. Bitcoin fell about 2.25% last week, and the decline continued into Tuesday's session, with the price currently trading around $76,500.
On the weekly chart, the next major downside target is near $75,597, corresponding to the 50-week simple moving average (SMA). A sustained break below this level, especially a weekly close below it, could accelerate bearish momentum and put the 200-week SMA (around $67,776) at risk.
Momentum indicators also show buyers are weakening. The weekly Relative Strength Index (RSI) is near 49, slightly below the neutral threshold of 50. While this reading does not confirm strong bearish momentum, it indicates that the previous bullish advantage has substantially diminished.
Meanwhile, the Moving Average Convergence Divergence (MACD) histogram remains in positive territory, but its bars are shrinking, indicating that upward momentum is fading.
Overall, these indicators show that buying momentum is weakening, rather than confirming a long-term bearish reversal. On the positive side, Bitcoin must first reclaim the 61.8% Fibonacci retracement level at around $78,661. A sustained recovery above this resistance could pave the way toward the 50% Fibonacci retracement level at $87,823, followed by the 100-week simple moving average near $89,134. However, buyers may need stronger institutional participation and improved market sentiment to support such a move. Bitcoin's daily chart presents a relatively more balanced outlook, although bearish momentum remains evident.
Bitcoin is currently priced around $76,587, slightly above its 200-day exponential moving average (EMA) of about $76,466. This moving average provides significant support and could prevent a deeper correction.
In addition, Bitcoin remains below the 100-day exponential moving average (EMA) at $77,821 and the 50-day EMA at around $80,287, indicating that sellers continue to dominate the short-term trading range. The daily RSI is near 34, reflecting weak buying momentum and intensifying bearish pressure.
Likewise, the MACD histogram remains below zero, indicating that downward momentum has not fully faded. For a meaningful rebound, Bitcoin needs to reclaim the $80,287 resistance level. A successful break above it could encourage bulls to target the psychological $85,000 level.
Bitcoin's current price has fallen below the 100-day EMA at $77,821, making the 200-day EMA (around $76,466) the next key support. A break below the 200-day EMA would further weaken Bitcoin's medium-term technical structure and increase the likelihood of a broader correction. A recovery above $78,661 could provide an initial sign that buyers are returning; but reclaiming $80,287 would be stronger evidence that momentum is improving. On the other hand, continued ETF outflows, further escalation in market uncertainty, or a break below $76,466 could prompt sellers to target weekly support near $75,597.#广场交易达人 $BTC