Square
Following
Hot
News
Notifications
Profile
Share your thoughts
placeholder
Article
Copy Trading Live Profit Show
live-cover
LIVE14
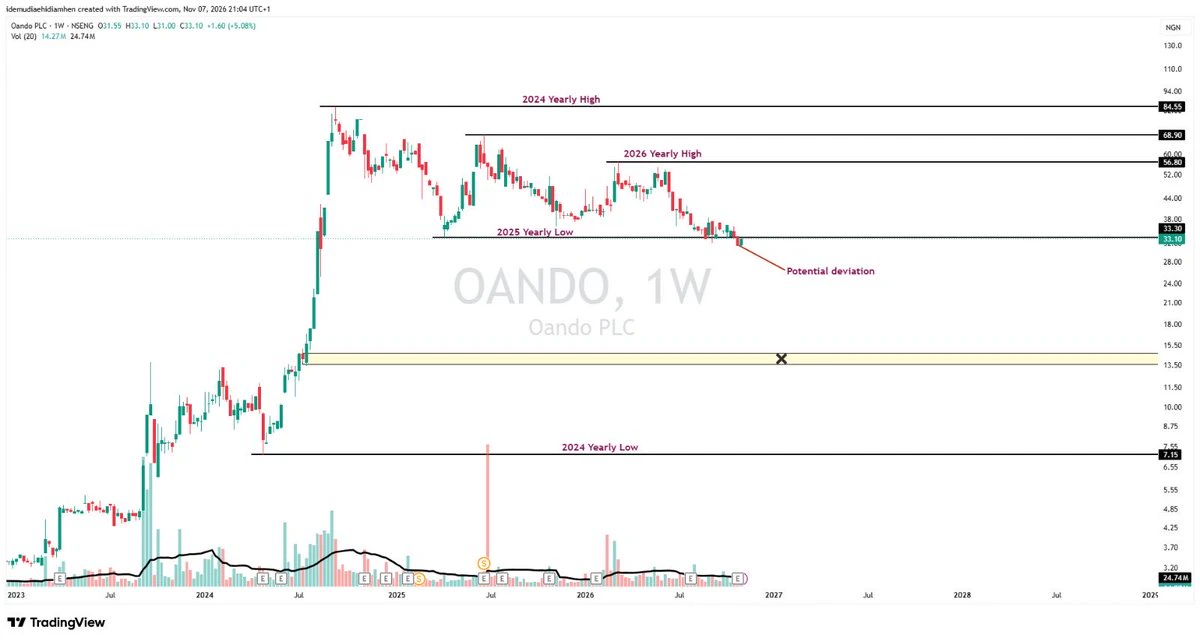
OANDO
Warning: OANDO's fundamentals are shite; I am gonna only focus on technicals.
Last week, we formed a potential deviation, and I expect a potential bounce to come next week. All I wanna see is the bulls reclaiming the 2025 yearly low of N33.1/share.
Failure to reclaim the 2025 yearly low; then the next zone is the X market zone in the region of N13.6-N14.7 per share, which I doubt the market makers of OANDO will want to happen.
Personally, I will never trade this company till I see the right momentum, but this is a memestock
#NFA
post-image
Trenches
ZIG
Z
bade
b
ZIG
0x8c...1145
Market Cap
$.
Change
.
24h Vol
$.
Holders
.
BTC
B
bade
b
BTC
C5xp...pump
Market Cap
$.
Change
.
24h Vol
$.
Holders
.
STONK
S
bade
b
STONK
6GmA...UNgx
Market Cap
$.
Change
.
24h Vol
$.
Holders
.
José
J
bade
b
José
87CQ...1UJT
Market Cap
$.
Change
.
24h Vol
$.
Holders
.
IDOL
I
bade
b
IDOL
0x3b...ab07
Market Cap
$.
Change
.
24h Vol
$.
Holders
.
Digging through Hyperliquid whale positions again in the early hours
The short positions are stacked pretty aggressively
BTC shorts: around $890–920 million
Longs: around $450–480 million
Shorts are roughly twice the longs
Net short: around $350–470 million
The most bearish positioning since October 2025
The largest single short is around $178.5 million
Entry price around 76390
There are also shorts of around $155 million and $101.8 million
Quite a few are above $60 million
They flipped to net short around October 27 and have kept adding since
BTC perpetual open interest on the platform is aro
post-image
BTC-0.65%
Crypto is all about contrarian thinking. Once everyone has exited, it can really take off. I’m still buying the dip
post-image
Bro, go long on $UNI and $MET ♥️🤝$UNI . Long trade entry price: $7.10–$7.15 Take-profit 1: $7.30 Take-profit 2: $7.50 Final take-profit: $7.70 Stop-loss: 6.85 MET long trade entry price: 0.320–0.326 Take-profit 1: 0.335 Take-profit 2: 0.345 Final take-profit: 0.355 Stop-loss: 0.312
post-image
UNI+3.05%
MET-0.33%
BTC ETH MARKET PREDICTION
live-cover
LIVE74
Allowlisted for @torpornet (tier A). Applicant 24904. 4,444 frogs, built to sit. Check yours:
This trade on $ACT was profitable. Take the money and run. Another victory. Profit: $ 656 Today's highlights:
‍$XRP and $AKE .
post-image
ACT-1.19%
XRP-1.15%
AKE+6.07%
$Bull Run is staging a strong bullish rebound, up more than 10% and nearing the $0.0600 resistance level! If the breakout is confirmed, the rally could extend to $0.0630. Trading plan (long): Entry: $0.0585 – $0.0593 Target levels: $0.0600 / $0.0615 / $0.0630 Stop-loss: $0.0570
post-image
牛来-1.82%
World Liberty Financial's USD1 has 640,195 holders, more than 3.5 times the 181,039 holding PayPal's PYUSD.
USD1 also has 380,148 monthly active addresses, more than 3 times PYUSD's 115,565.
@worldlibertyfi
USD1+0.00%
PYUSD-0.09%
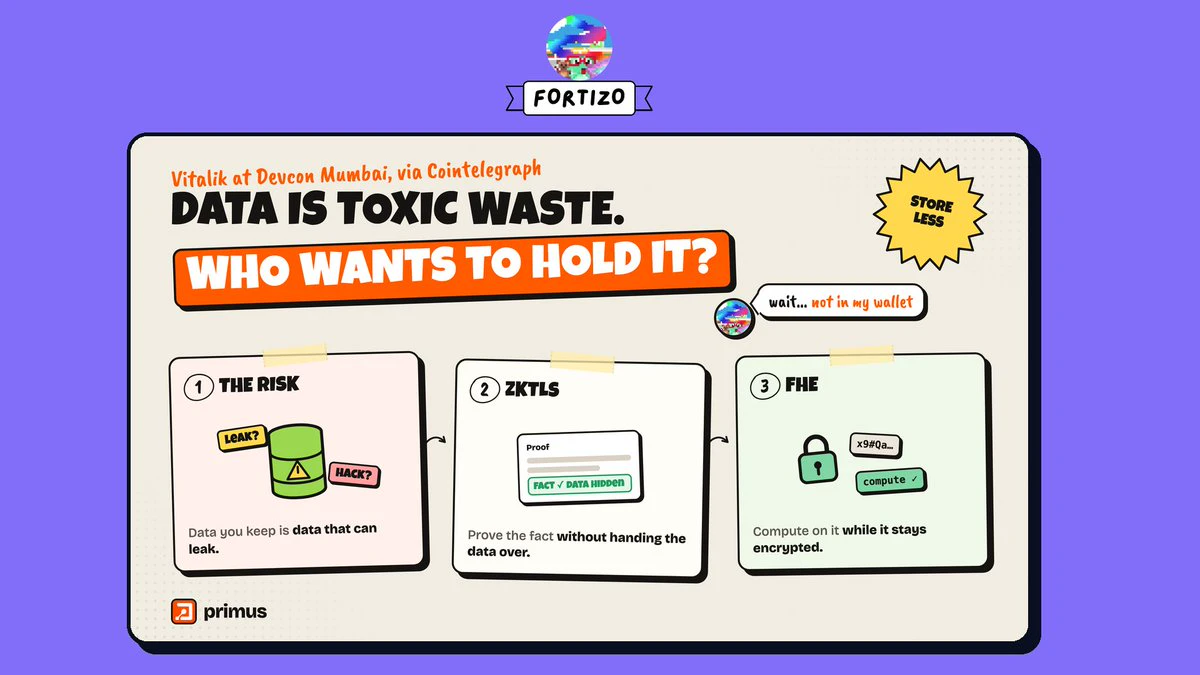
Vitalik says treat data as toxic waste. So who wants to hold it?
Institutions still have to prove things.
@primus_labs' answer: zkTLS proves the fact, FHE computes on it encrypted. Store less, expose less, still verify.
➙
post-image
FHE-3.50%
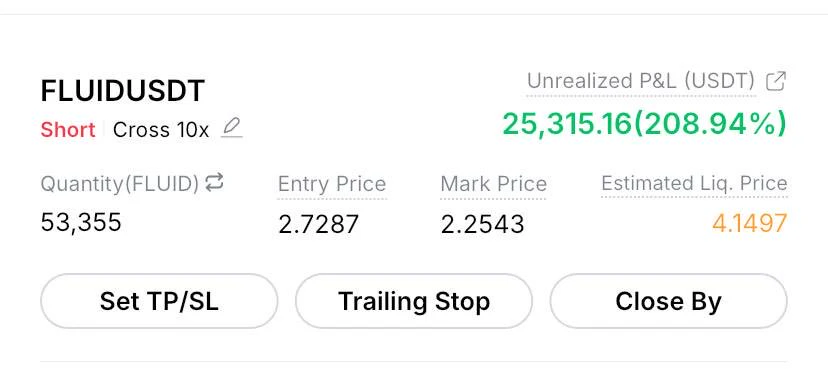
$FLUID approaching target now
Join our telegram channel for live trades
post-image
FLUID-1.92%
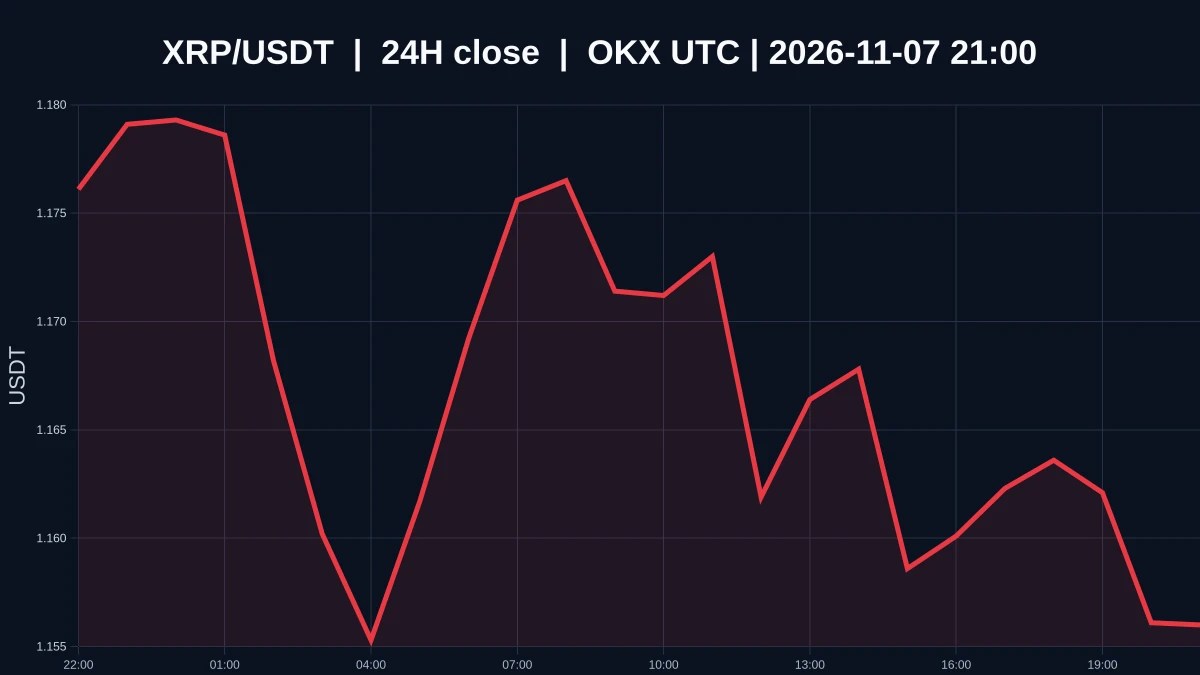
$XRP Is Weak on Low Volume at 1.1567. What’s Still Missing Between Oversold and a Bottom?
$XRP is currently priced at 1.1567, down about 1.44% over the past 24 hours, with an intraday low of 1.151 and high of 1.1853. The 1-hour and 4-hour trends are both weak, and the volume ratio is around 0.0429, indicating low market participation. Oversold describes a condition; a bottom is a confirmed outcome. A steep decline only shows that selling pressure has occurred. It does not automatically mean the price is cheap, much less prove that buyers are actually defending the area around 1.151. Demand for
post-image
XRP-1.15%
I just added another entry trade on $IDOL targeting 0.0305-0.0270
post-image
IDOL-6.71%
$TRX Short, sellers need to hold 0.320 on the 4H chart. Price is right below EMA50. I’d like to see a wick that spikes up and gets rejected, rather than price slowly breaking through it. That’s the whole idea. Quick read: - Price is 0.320 on the 4H chart, below EMA50 at 0.320; sellers still control the trend - 1H RSI is 68; the hourly timeframe is overheated - The daily price is below EMA200 at 0.326; the higher timeframe also supports this view. Short 0.3202–0.3204 Take profit 0.3199 / 0.3196 / 0.3192 Stop loss 0.3210 Not financial advice; do your own research.
post-image
TRX+0.42%
Load More

Join 40 M users in our growing community

⚡️ Join 40 M users in the crypto craze discussion

💬 Engage with your favorite top creators

👍 See what interests you

Trending Topics

USAIStocksHitHard

21.24k Views3.67k Discussing

U.S. stocks sold off sharply on Thursday, November 5 (UTC). The Nasdaq closed down around 5.5%, entering correction territory, while the Philadelphia Semiconductor Index plunged roughly 12%, with chip stocks including $NVDA and $AMD posting steep losses. Beyond profit-taking, investors are growing concerned about the pace of AI data center construction, capital spending, and future returns on investment. The key question now is whether the AI sector’s lofty growth expectations need to be repriced. Where do you think the next opportunities will emerge: chip stocks, tech giants, or other sectors?

USNonfarmPayrolls

34.98k Views4.34k Discussing

StakeOnLaunchpoolToShare450KVLX

10.25k Views828 Discussing

View More