Share crypto content and earn up to 60% commissions through content mining.
placeholder
gatefun
$ZEC Keep holding it—make sure you achieve financial freedom.
ZEC2.08%
View Original
post-image
post-image
  • Reward
  • Comment
  • Repost
  • Share
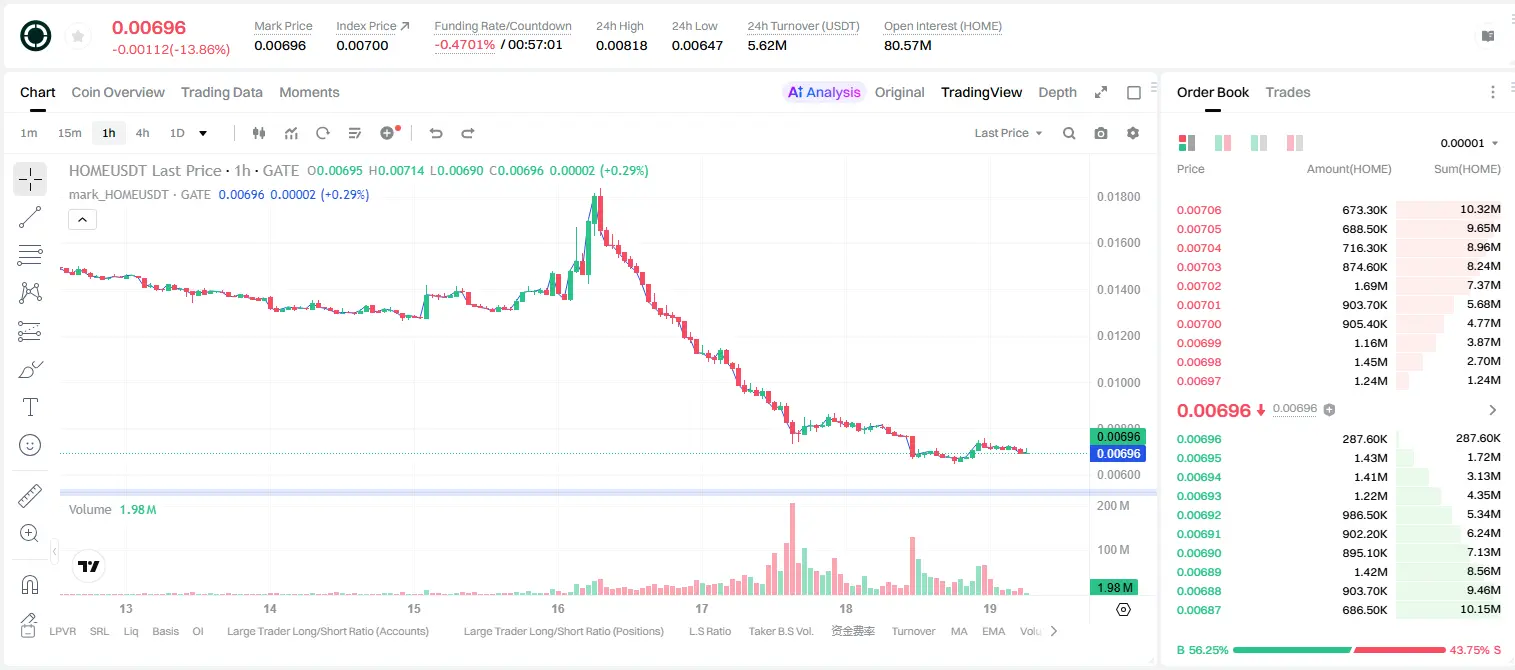
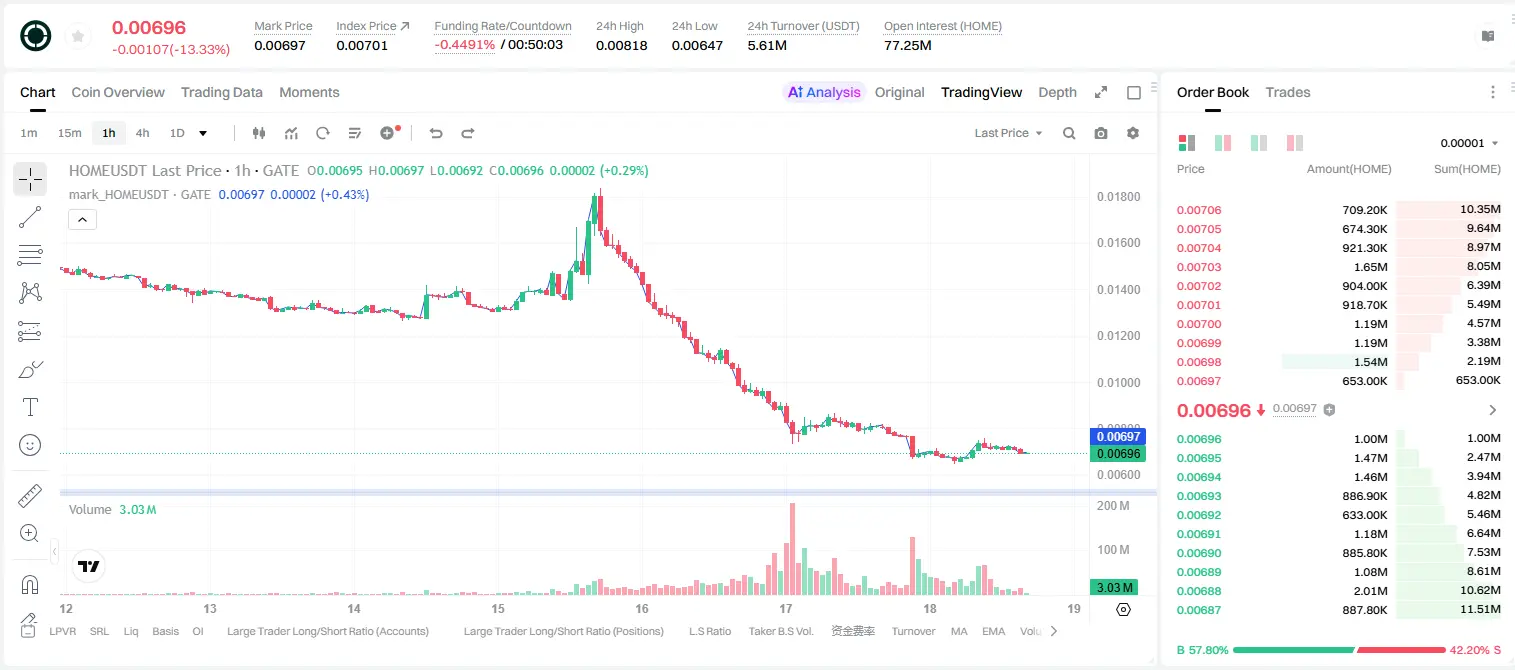
$HOME /USDT shows an 84% bullish signal on the 4-hour chart, but the daily trend is bearish—an opportunity hides in the contradiction.

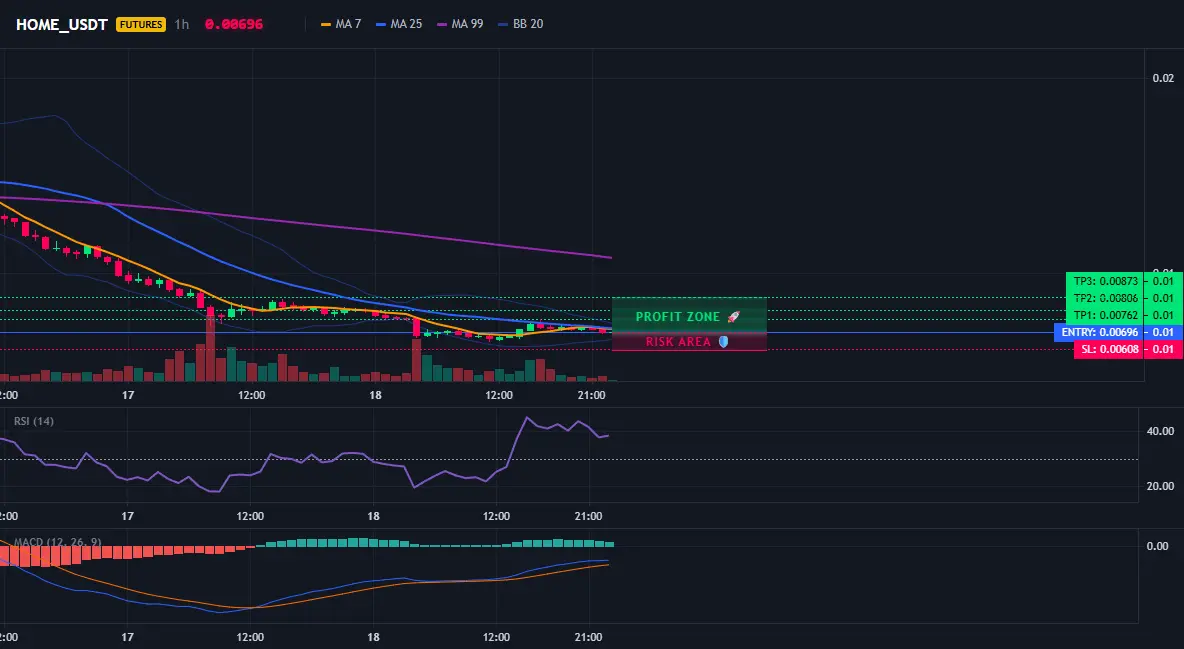
$HOME /USDT - Go LONG

Trading plan:
Entry: 0.00689 – 0.00703
SL: 0.00608
TP1: 0.00762
TP2: 0.00806
TP3: 0.00873

Why focus on this setup?
- 4-hour LONG signal: entry at 0.00696, TP1 at 0.00762, TP2 at 0.00806, SL set at 0.00608.
- The 15-minute RSI is only 38.17, in the oversold zone, with short-term rebound momentum building.
- The 1-hour ATR is 0.000283, with moderate volatility. The current 0.00696 is a support level, suitable for buying the dip.
HOME-11.23%
View Original
post-image
post-image
  • Reward
  • Comment
  • Repost
  • Share
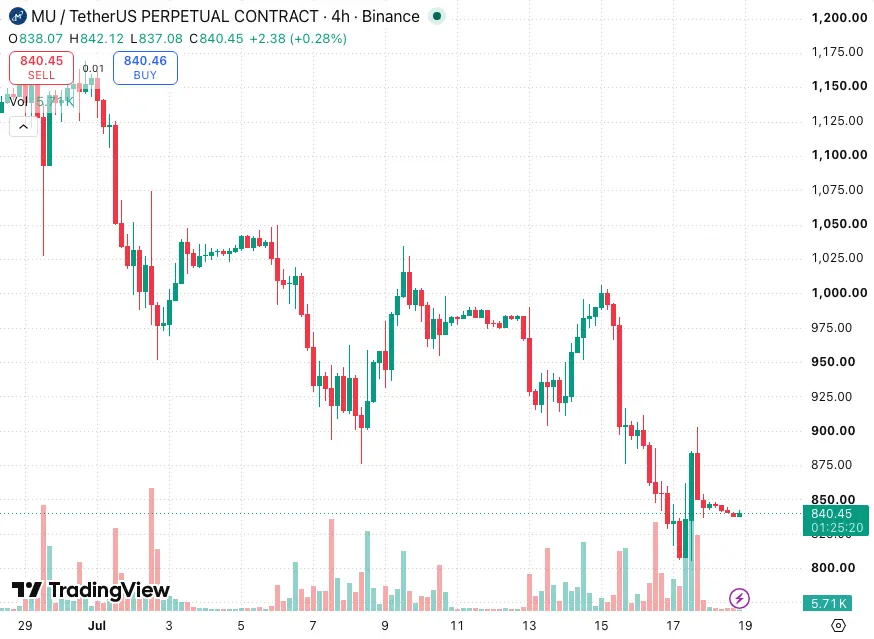
$MU Watch for short opportunities. The market is chasing a rebound right now, but I’m more inclined to look short from this level. The 4-hour short trend is still in place; the daily overall is ranging, and price has clearly been hitting resistance in the 840.19 to 840.89 range. The 15-minute RSI is around 56, with momentum leaning neutral—there may still be room to move lower. Volume data also confirms participation from sellers. You can watch for entry opportunities near 840.19 to 840.89, looking down to 837.27 and even 831.82. Put the defense level around 844.90. Don’t chase too aggressive
MU-0.73%
View Original
post-image
  • Reward
  • Comment
  • Repost
  • Share
ADAM BACK: "IF THE U.S. STRATEGIC BITCOIN RESERVE BECOMES A REALITY, GET READY FOR 7-FIGURE BITCOIN." 🚀
WILD TIMES AHEAD.
BTC1.35%
post-image
post-image
  • Reward
  • Comment
  • Repost
  • Share
This rally wasn’t sudden—what really triggered it was the earlier period of price pressure. A lot of people got worn down until they had no temper left. I, on the other hand, feel that something is already off here. $XPIN repeatedly tested around 0.0012342; the key level didn’t keep sliding lower. When it was slammed, no one kept panicking and rushing to sell. This suggests the shorts’ pressure is starting to dissipate.

At the time, I was paying attention to XPIN’s follow-through, not whether a single candle looks good. Once the order book shifts from being passively beaten to actively push
XPIN-3.66%
BTC1.37%
ETH1.06%
View Original
post-image
  • Reward
  • Comment
  • Repost
  • Share
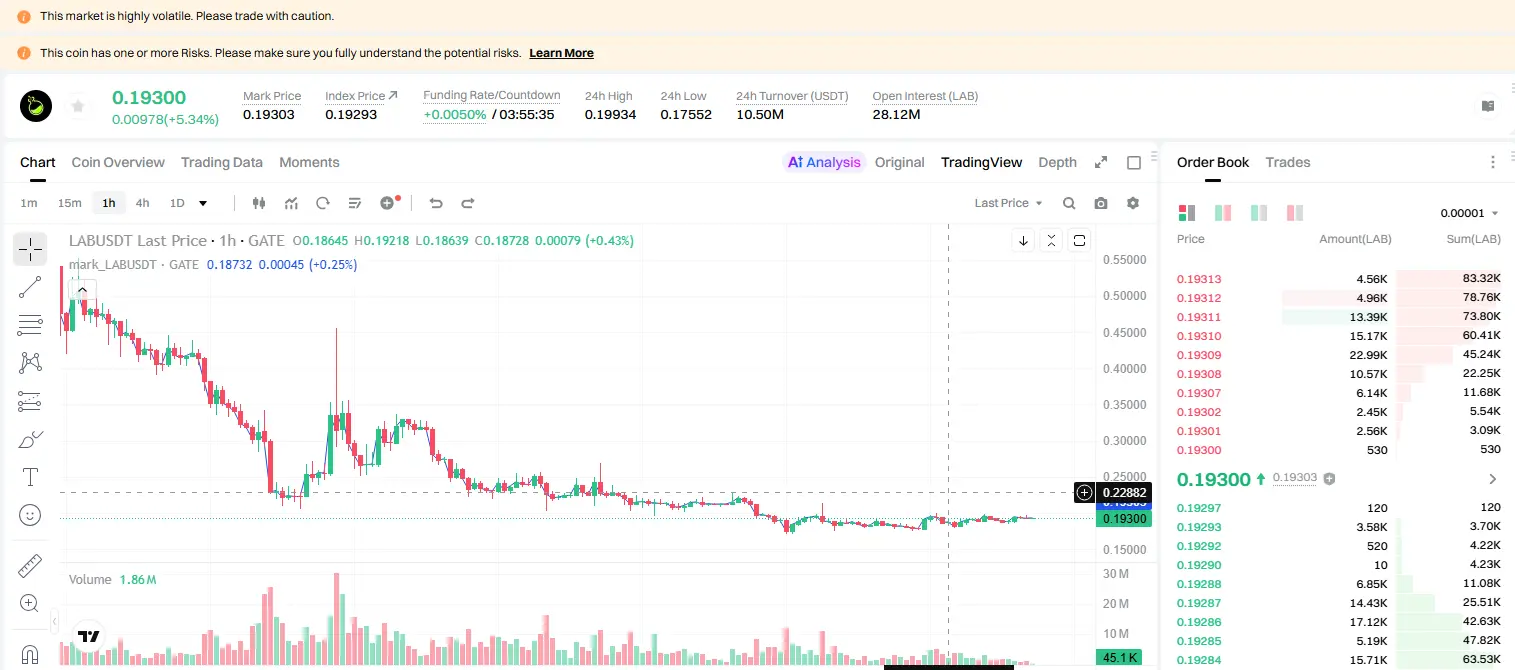
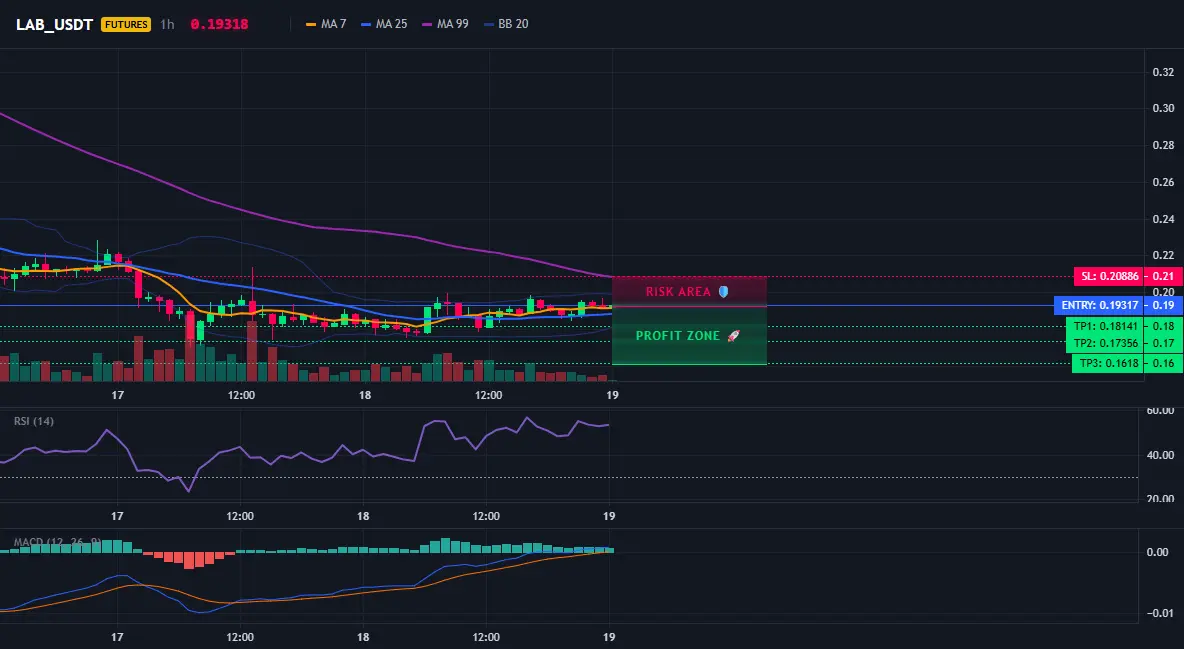
LAB/USDT 4-hour signal is out — is it a reversal or a trap?
$LAB /USDT - Go SHORT
Trading plan:
Entry: 0.19154 – 0.19480
SL: 0.20886
TP1: 0.18141
TP2: 0.17356
TP3: 0.16180
Why pay attention to this structure?
- Direction: SHORT, confidence 55.4. The 1D trend shows range-bound movement, and the 4-hour level signal is clear.
- Why now? RSI (15 minutes) is 54.41, neutral but slightly weak. 1-hour ATR is only 0.006536, volatility is tightening, and a breakout is imminent.
- Entry reference: 0.19317, TP1 0.18141, TP2 0.17356, SL 0.20886 — risk is controllable.
Discussion:
Will this move hit TP2 fir
LAB5.21%
View Original
post-image
post-image
  • Reward
  • Comment
  • Repost
  • Share
Morning Crypto Market Update
gate liveLIVE
856
  • Reward
  • Comment
  • Repost
  • Share
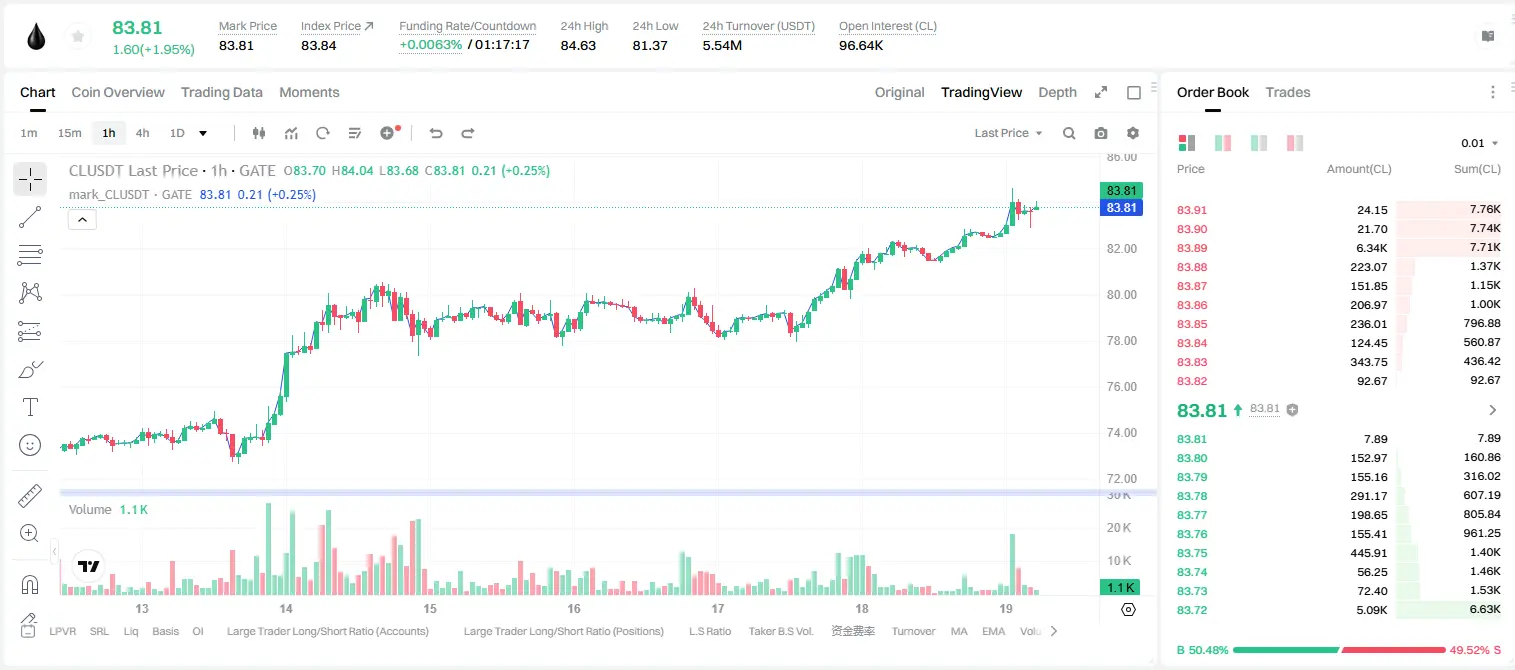
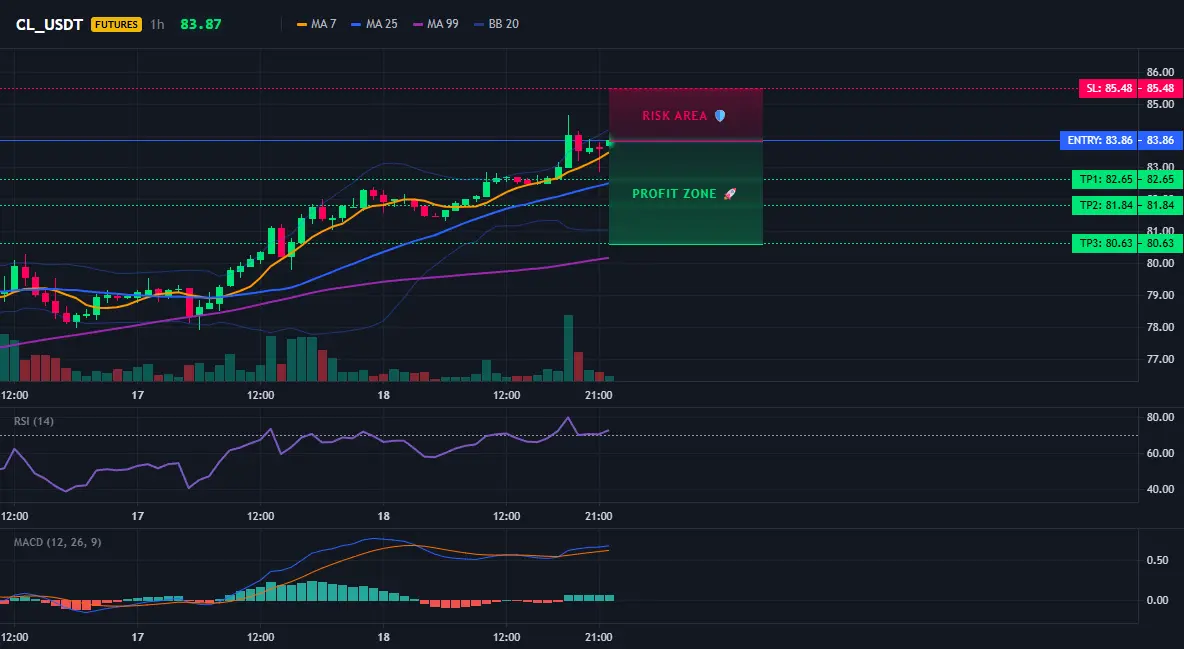
$CL /USDT’s 83.86: is it a short trap or a reversal signal?
CL_USDT - go short SHORT
Trading plan:
Entry: 83.73 – 83.99
SL: 85.48
TP1: 82.65
TP2: 81.84
TP3: 80.63
Why focus on this structure?
- 4h-level SHORT signal, confidence 77.4%, EMA trend downward, and 1D is in a ranging area.
- RSI on 15m is 61.63, not overbought, but RSI on 1h is 83.86, close to the highs—there is downside pressure for a short-term pullback.
- ATR on 1h is 0.518, moderate volatility; with entry near 83.86, TP1 82.65, TP3 80.63, SL 85.48.
- Why now? High 1h RSI + 4h bearish structure—wait for confirmation of a breakdown
CL1.88%
View Original
post-image
post-image
  • Reward
  • Comment
  • Repost
  • Share
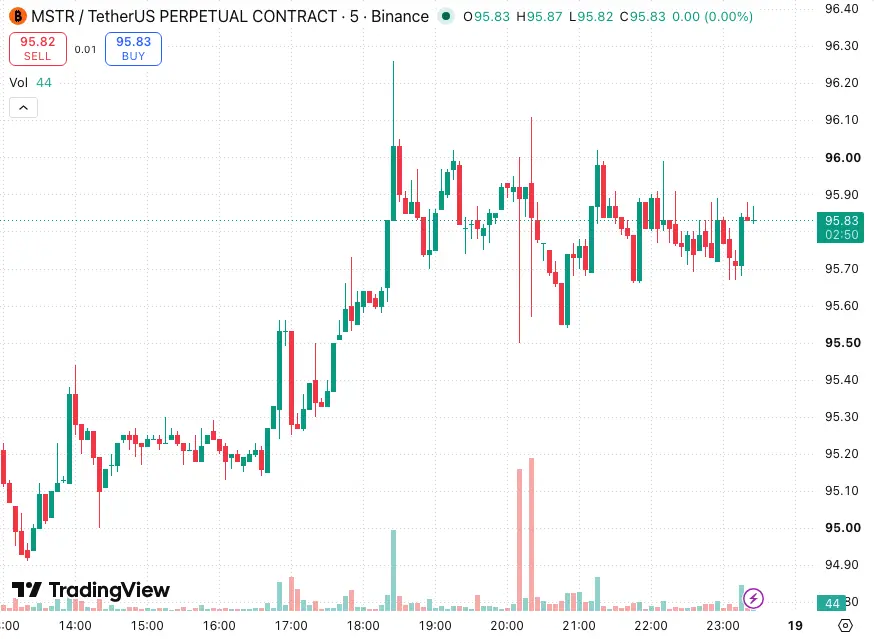
$MSTR Follow the long-side direction. Many people skip it because they think the chart looks messy, but that may be exactly where the opportunity is hiding. The 4-hour long structure is still intact. Although the daily chart is ranging, the price has already shown clear reactions in the 95.64 to 95.74 area. On the 15-minute chart, the RSI is right at the neutral 50 level, and there is room for further upside. Also, the 15-minute trading volume has increased by about 4 times—buy-side capital has genuinely flowed in. For entry, focus on the 95.64 to 95.74 range. The first upside target is 96.06
View Original
post-image
  • Reward
  • Comment
  • Repost
  • Share
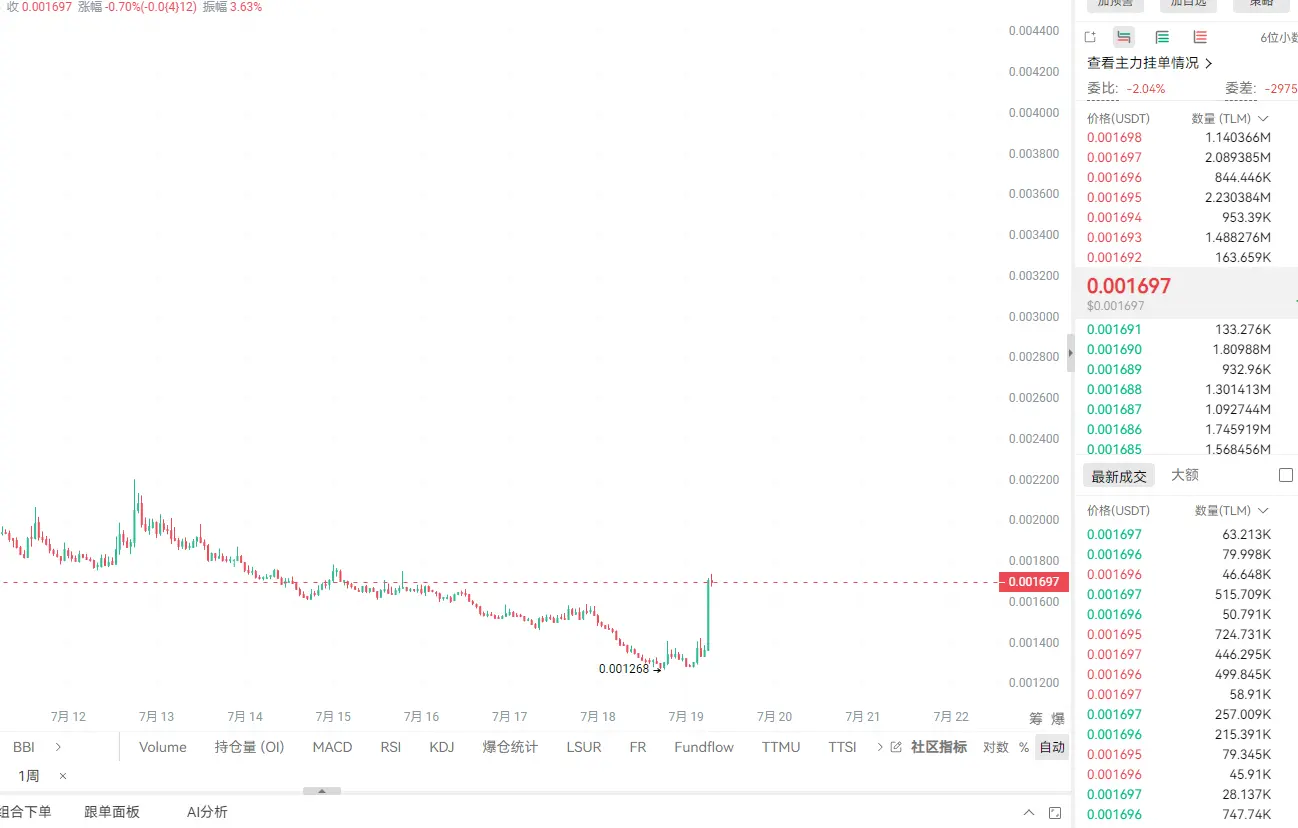
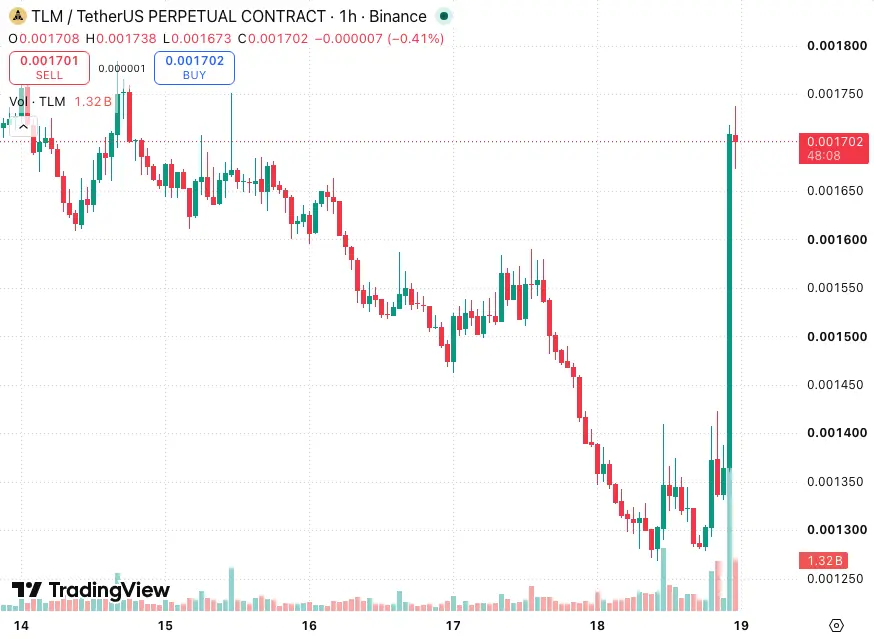
TLM is now 0.00166u. We analyzed it before and said it was an old on-chain game mining pattern—sure enough, it didn’t hold up.
It only hit a new all-time low on July 1, dropping to 0.0008u, just a little over ten days ago. Now it has rebounded more than 2x from that bottom, but it’s still far from its all-time high of 0.9197u, with a drawdown of over 99%.
The coin’s longstanding problems haven’t changed at all: the first thing players do with the tokens they mine is sell them, and the long-term outlook is ongoing sell pressure. This kind of game mining model has been hard to truly turn around
TLM26.13%
View Original
post-image
  • Reward
  • Comment
  • Repost
  • Share
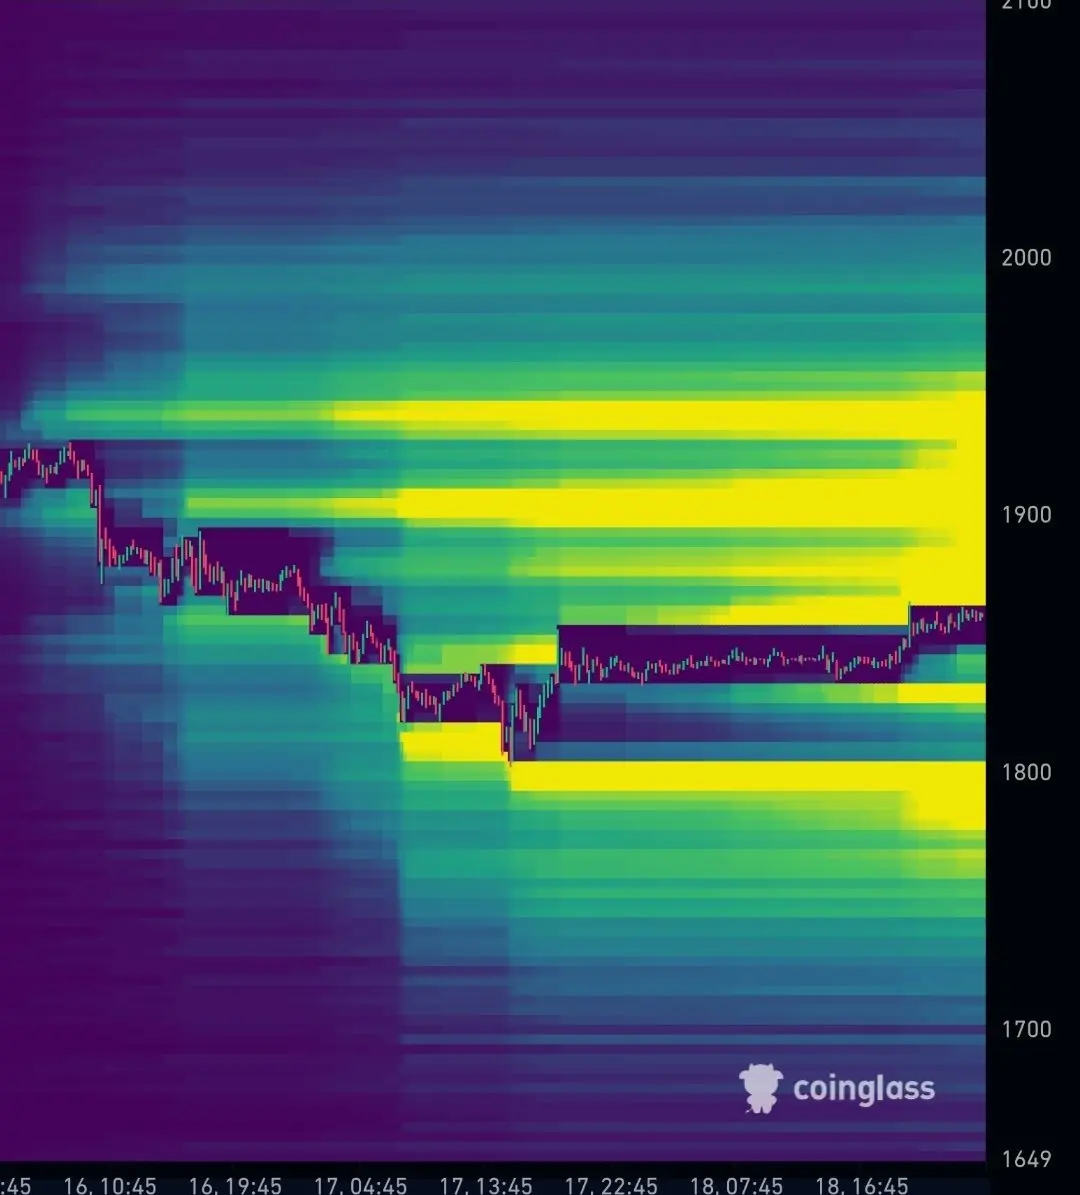
$ETH LOOKS PRIMED FOR A PUMP LEAVING THE $1800 ZONE.
LOOKS YUMMY FOR MM?
ETH1.06%
post-image
  • Reward
  • Comment
  • Repost
  • Share
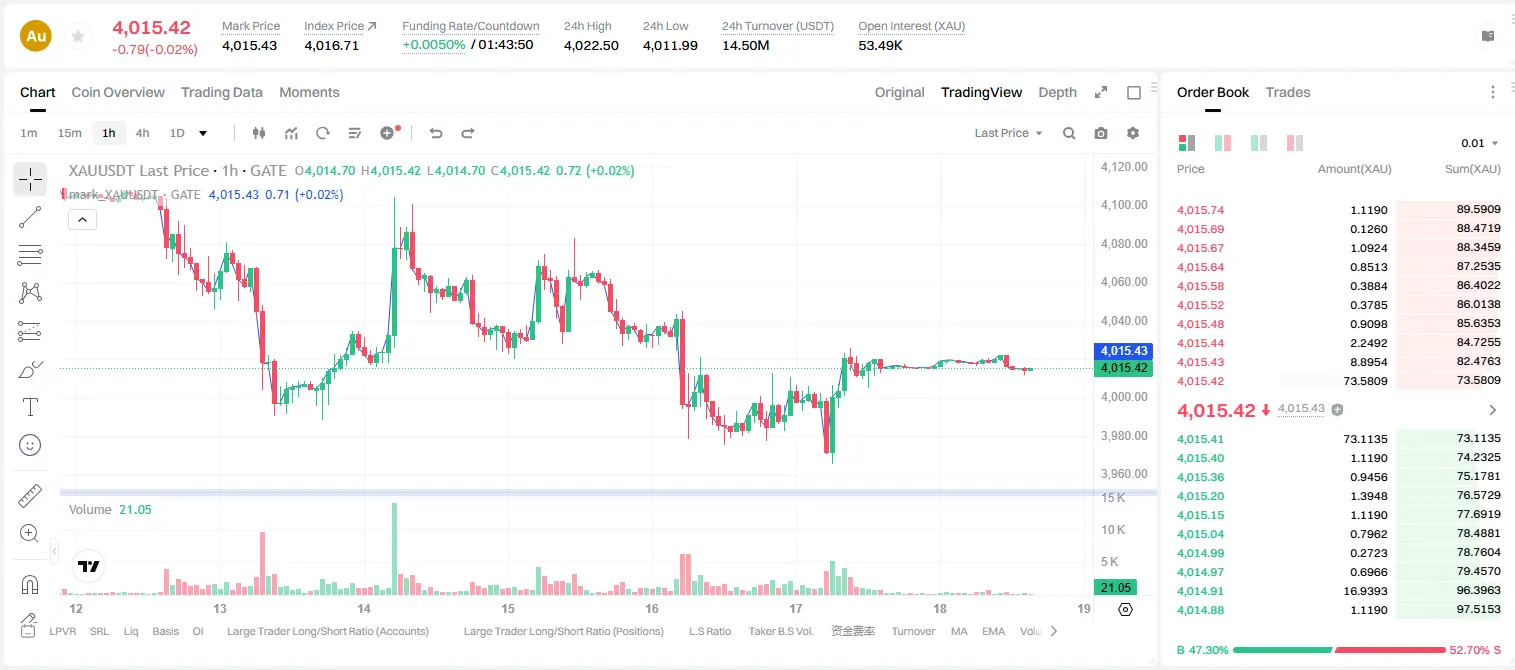
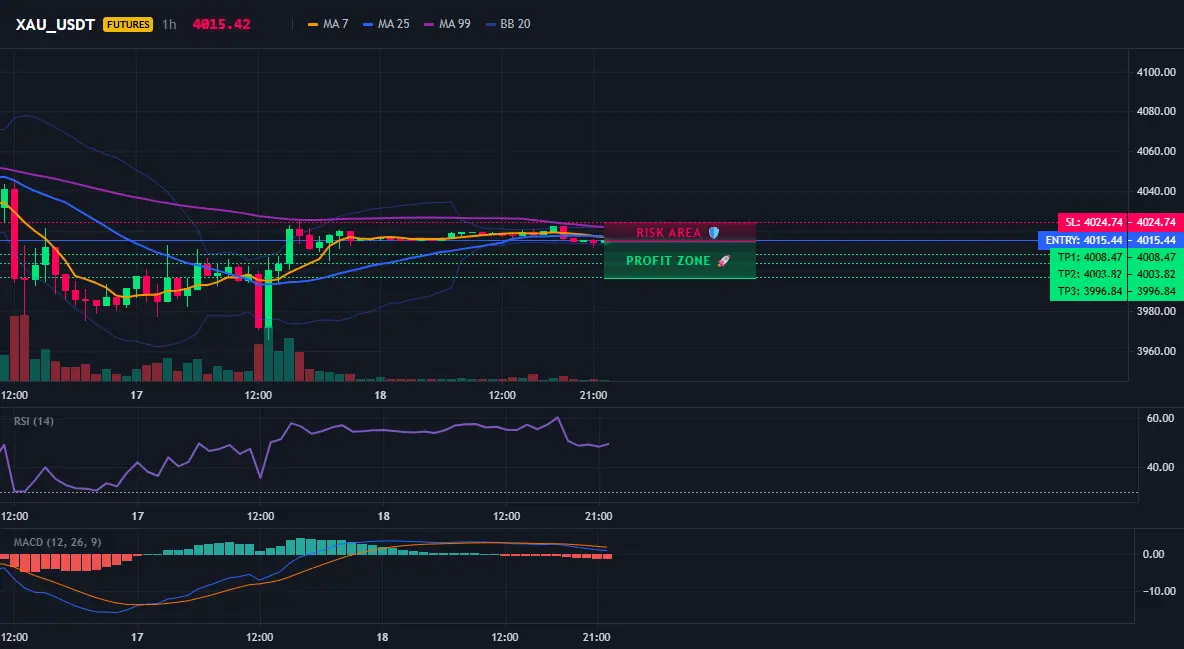
Are the gold bulls dead? $XAU /USDT bearish signals are coming in on the 4-hour timeframe.
$XAU /USDT - SHORT to sell
Trading plan:
Entry: 4014.47 – 4016.41
SL: 4024.74
TP1: 4008.47
TP2: 4003.82
TP3: 3996.84
Why focus on this structure?
The current gold price is 4015.44. On the 15-minute chart, RSI is only 43.75, and momentum is on the weaker side. The trend on 1D is range-bound, but the 4-hour bearish signal has been confirmed, and the entry point is 4015.44. TP1 looks at 4008.47, TP2 looks at 4003.82, with SL at 4024.74. Why now? RSI has not hit oversold, and bears still have r
XAU0.08%
View Original
post-image
post-image
  • Reward
  • Comment
  • Repost
  • Share
1. Today’s Market Overview
Bitcoin is currently ranging and consolidating in the $63,500–$64,800 band, with an approximately 1% gain over the past 24 hours. The intraday high is around $64,385 and the low is around $63,312. The market is locked in a stalemate between bulls and bears, with no clear direction.
---
$BTC
2. Today’s Headlines
1. The Iran–U.S. conflict continues to escalate
The Iran–U.S. conflict has entered its sixth day. Trump has threatened to attack Iran’s underground nuclear facilities, and tanker traffic through the Strait of Hormuz has fallen to a historic low. Bitcoin is
BTC1.37%
View Original
post-image
post-image
  • Reward
  • 1
  • Repost
  • Share
Poetry,Wine,AndCountryside:
All opportunities are earned by waiting, not by frequent trading.
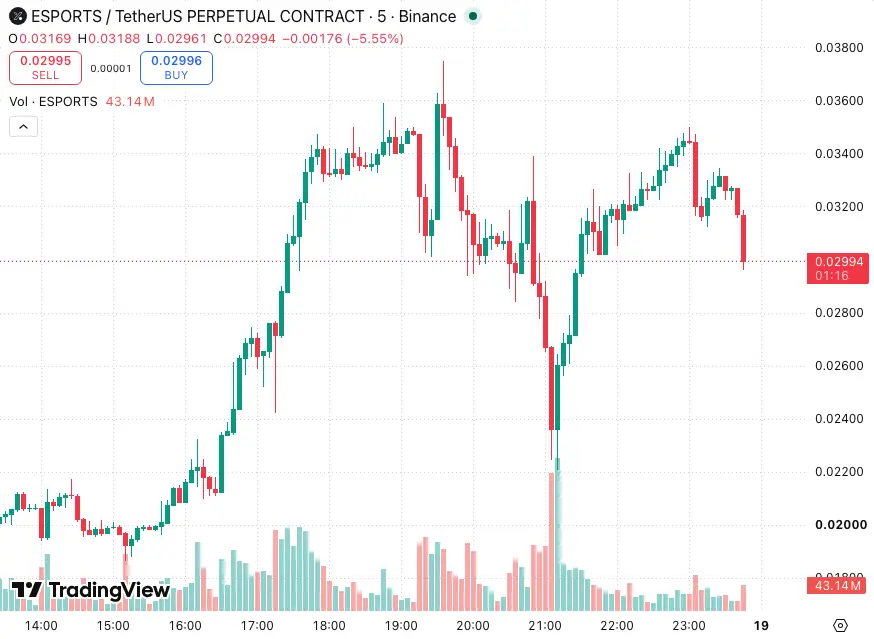
$ESPORTS Continue to be bearish. At 0.04, the sell wall is indeed a bit heavy; in the previous few times, once it reached around this area, it was smashed down. I think this move may still need to continue lower. Although I rode the momentum and managed to take the swings in the previous two times, if everyone keeps following through, you should still pay close attention to changes on the order book and control risk.
ESPORTS-5.39%
View Original
post-image
  • Reward
  • Comment
  • Repost
  • Share
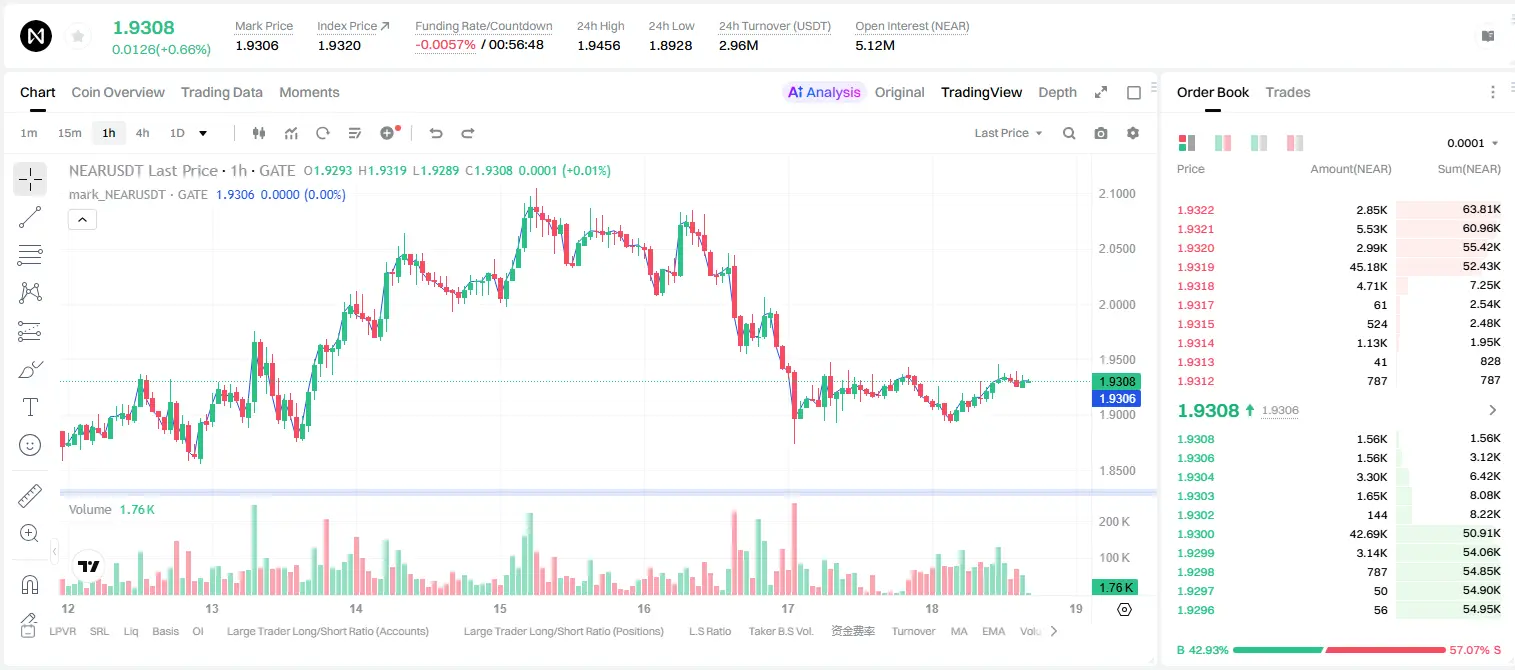
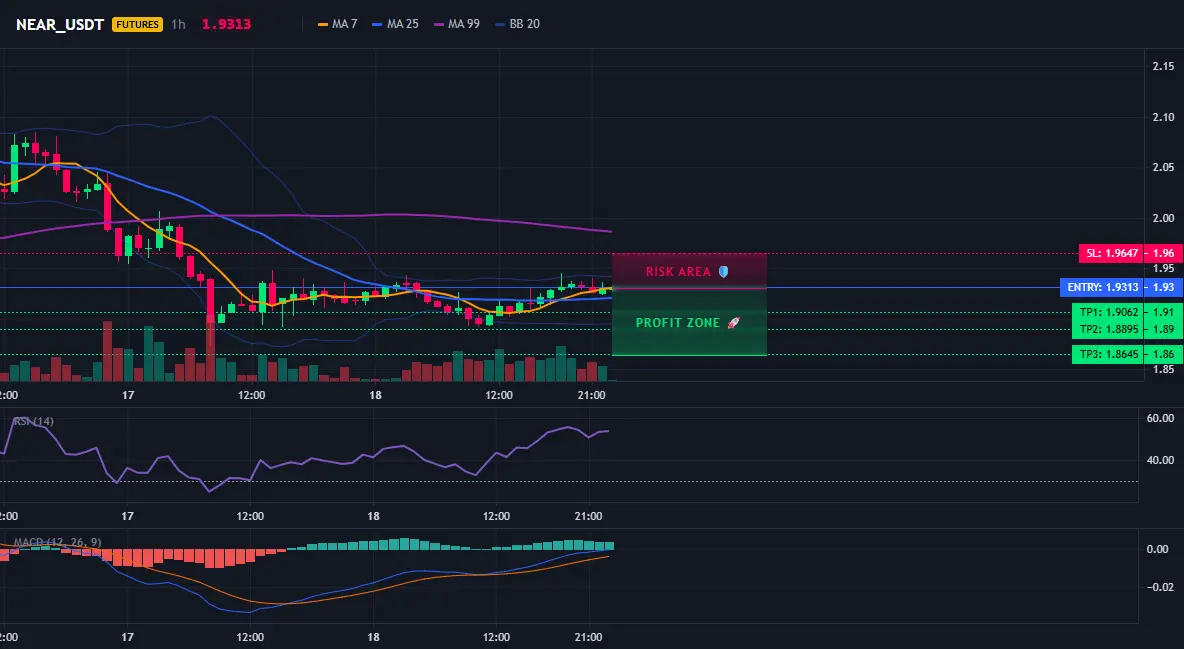
NEAR 4H bull trap? I’ve seen this signal three times.
$NEAR /USDT - SHORT to go short
Trading plan:
Entry: 1.9278 – 1.9348
SL: 1.9647
TP1: 1.9062
TP2: 1.8895
TP3: 1.8645
Why pay attention to this structure?
- RSI 15m 54.2: short-term rebound, but the trend hasn’t turned bullish.
- 1D range-bound action; a SHORT signal appeared on 4H with 55% confidence.
- Current price 1.9313, pressing right against EMA resistance; the short entry zone is 1.9278-1.9348.
- Why now? The top of the range + RSI neutral-to-weak, with high odds of a bull trap (liquidity sweep upward).
Discussion:
NEAR0.29%
View Original
post-image
post-image
  • Reward
  • Comment
  • Repost
  • Share
$TLM , $AKE , and $SOL are the key spots to prepare for a short.
The chart already shows signs of a parabola topping pattern; after this squeeze/forced-short sentiment fully releases, it will most likely face a pullback. In particular, for $TLM , the entry zone to focus on is between 0.00167 and 0.001712. Downside targets are 0.001566 and even 0.001466, with support set at 0.001798.
But you must pay close attention to risk in operations. The squeeze momentum is still very strong right now, and before it truly drops, it may still push up for a bit longer. Don’t get carried away and go all-in. M
TLM23.62%
View Original
post-image
  • Reward
  • Comment
  • Repost
  • Share
Tonight’s CPI: Full Coverage · Analysis
gate liveLIVE
3,999
  • Reward
  • 4
  • Repost
  • Share
MSTF30:
2026 GOGOGO 👊
View More
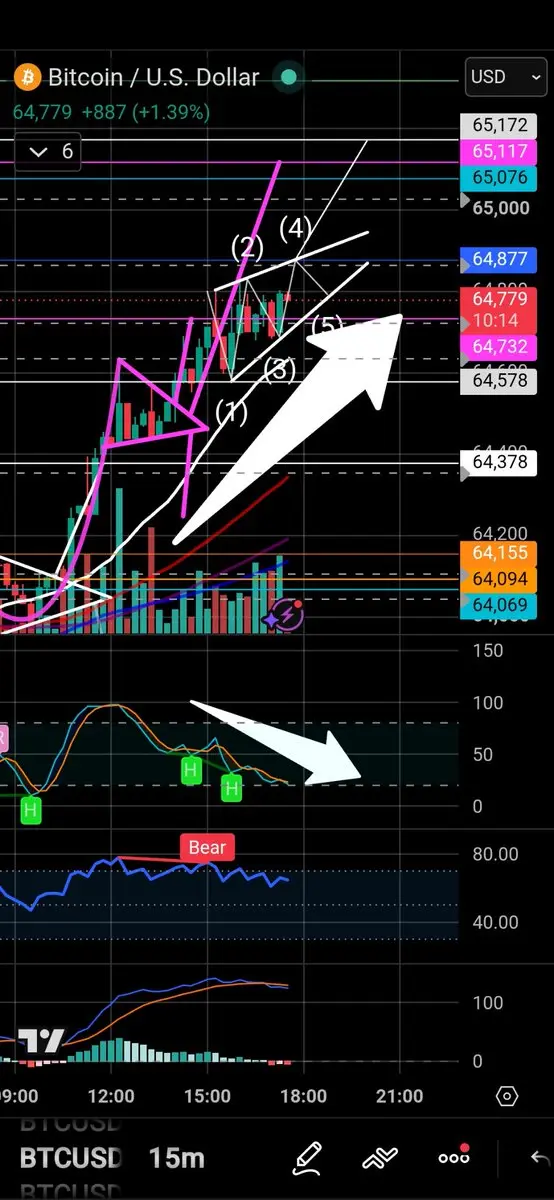
$BTC Another 15-Min Stochastic RSI Anomaly
This is a hidden bullish divergence.
Notice that price action slopes upwards while the Stochastic RSI slopes down?
The Stochastic RSI is nearly resetting just above the overso region of the indicator.
This has sent price action higher a few times now in the last two days.
Will we get the same results?
Would be nice to breakout above that white rising wedge.
NFA, DYOR ⚠️
#Crypto #Trading #BTC
BTC1.35%
post-image
  • Reward
  • Comment
  • Repost
  • Share
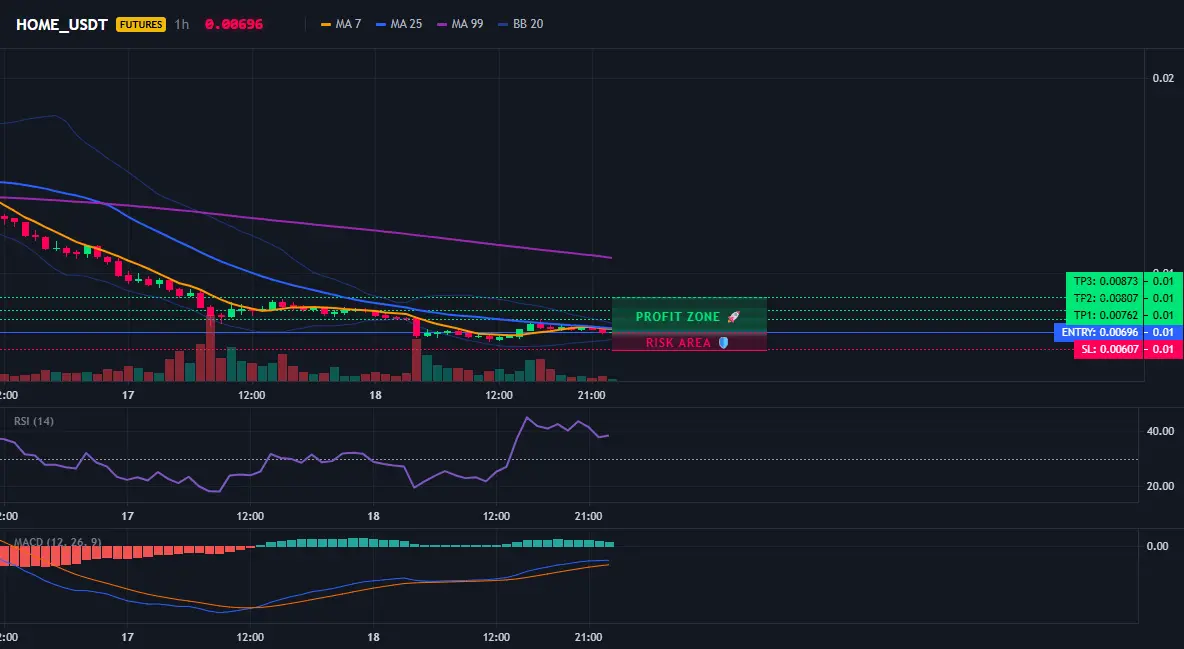
$HOME /USDT: Accumulation at the 4-hour bottom—will the whale push the market up?
$HOME /USDT - Go LONG
Trading plan:
Entry: 0.00689 – 0.00703
SL: 0.00607
TP1: 0.00762
TP2: 0.00807
TP3: 0.00873
Why focus on this structure?
- Current price 0.00696, and the 15-minute RSI is only 38.17—an oversold bounce is about to trigger.
- The 4-hour bullish signal score is 84, with dense EMA support; the entry zone is 0.00689-0.00703.
- TP1 target 0.00762 (+9.5%), TP2 0.00807 (+16%), with a stop loss set at 0.00607.
- Against the 1-day bearish trend, but it’s a high-probability short-term trade—why now? Beca
HOME-11.23%
View Original
post-image
post-image
  • Reward
  • Comment
  • Repost
  • Share
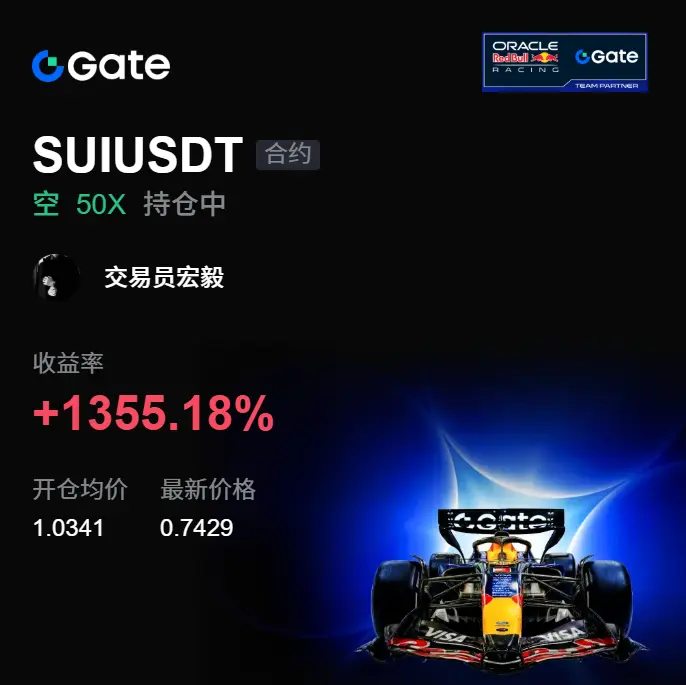
With this cut, the chart finally threw the answer out. $SUI It had been grinding in the high range for a while; a lot of people hesitated because it wouldn’t break. At the time, I wasn’t watching the surface of whether it would go up or down—I was watching how every time it bounced up, it got pushed back from above, and the buy-side couldn’t hold. Things here were already off.

What really caught my attention was when SUI hovered around 1.0341: the rebound strength kept getting shorter, while the sell pressure became clearer wave after wave. After opening the short, I didn’t rush to act—I wa
SUI0.34%
BTC1.37%
ETH1.06%
View Original
post-image
  • Reward
  • Comment
  • Repost
  • Share
Load More

Join 40 M users in our growing community

⚡️ Join 40 M users in the crypto craze discussion
💬 Engage with your favorite top creators
👍 See what interests you
  • Pinned