Square
Following
Hot
News
Notifications
Profile
Share your thoughts
placeholder
Article
ETFs saw $1.28 billion in outflows in a week, while $40.66 million flowed into Gate—who is selling, and who is buying?

These are the two sets of figures from the past week’s crypto market that are most worth considering together. U.S. spot BTC ETFs saw net outflows of about $1.28 billion over the five trading days through November 6, followed by another $412 million in outflows on November 7. BlackRock’s IBIT alone saw $403 million flow out. Over the same period, Gate recorded approximately $40.66 million in 24-hour net inflows, ranking third among global CEXs.‌

The $1.28 billion and $40.66
BTC-0.31%
💰 The market continues to fluctuate, while Gate's 24-hour net inflows rank among the top three globally

According to DefiLlama data, Gate recorded net inflows of about $40.66 million over the past 24 hours, ranking third among centralized exchanges worldwide. 🏆

Amid market volatility, fund flows have once again become a focus of attention.

Some believe inflows reflect trading demand and market confidence; others think short-term inflows may simply result from portfolio adjustments, margin top-ups, or waiting for the next trading opportunity.

Inflows are a positive signal, but more data i
GateSquare
💰 The market continues to fluctuate, while Gate's 24-hour net inflows rank among the top three globally

According to DefiLlama data, Gate recorded net inflows of about $40.66 million over the past 24 hours, ranking third among centralized exchanges worldwide. 🏆

Amid market volatility, fund flows have once again become a focus of attention.

Some believe inflows reflect trading demand and market confidence; others think short-term inflows may simply result from portfolio adjustments, margin top-ups, or waiting for the next trading opportunity.

Inflows are a positive signal, but more data is needed to determine whether they can translate into sustained buying pressure.

💬 What do you think will be more important to watch next: spot trading volume, sustained fund inflows, or BTC's price performance?

Join #Gate24小时净流入全球第三 on Gate Square to share your market observations, trading strategies, or ideas on fund allocation.

📖 Odaily reports:
https://www.odaily.news/zh-CN/newsflash/532275

repost-content-media
BTC-0.67%
Trenches
Libra
L
bade
b
Libra
0xd2...4444
Market Cap
$.
Change
.
24h Vol
$.
Holders
.
牛逼
牛
bade
b
牛逼
0x96...7777
Market Cap
$.
Change
.
24h Vol
$.
Holders
.
ZIG
Z
bade
b
ZIG
0x8c...1145
Market Cap
$.
Change
.
24h Vol
$.
Holders
.
BTC
B
bade
b
BTC
C5xp...pump
Market Cap
$.
Change
.
24h Vol
$.
Holders
.
STONK
S
bade
b
STONK
6GmA...UNgx
Market Cap
$.
Change
.
24h Vol
$.
Holders
.
$ONE Down 25% in one day, and at the current price of 0.0015, it’s hovering right at the 24h low. With this kind of wick-heavy action, I’m watching just two things: volume is still 127M with no drop-off, which means panic sellers are still unloading. My plan is simple—don’t catch the falling knife; wait for structure.
Entry: Place staggered limit orders in the 0.00135-0.00142 range. This is a 3%-5% buffer zone below the previous low; only buy a pullback, don’t chase a rebound. Keep the initial position at no more than 5% of total capital. Add another 5% if it breaks below 0.0013, keeping the t
if you're wondering why serious money still stays off chain, start here.
it's not cuz the liquidity isn't there. it's cuz the moment a fund puts size on a public chain, everyone can see its positions and reserves.
@primus_labs has been quietly stacking the pieces that fix this on BNB. here's the stack, layer by layer.
1/ verification
– primus zkTLS has been live on BNB Chain since june
– you can prove HTTPS data like a CEX balance, payment history or account age
– the raw data never leaves your device, only the proof goes onchain
2/ identity + credit
– ZKredit is co-built with @BNBCHAIN and @b
post-image
BNB-0.76%
BREV+7.05%
ETH-1.26%
Leaving aside whether he’s a spy, how did this turn into Jensen Huang supposedly punching above his weight with Huang Le??? What kind of twisted logic is that?
post-image
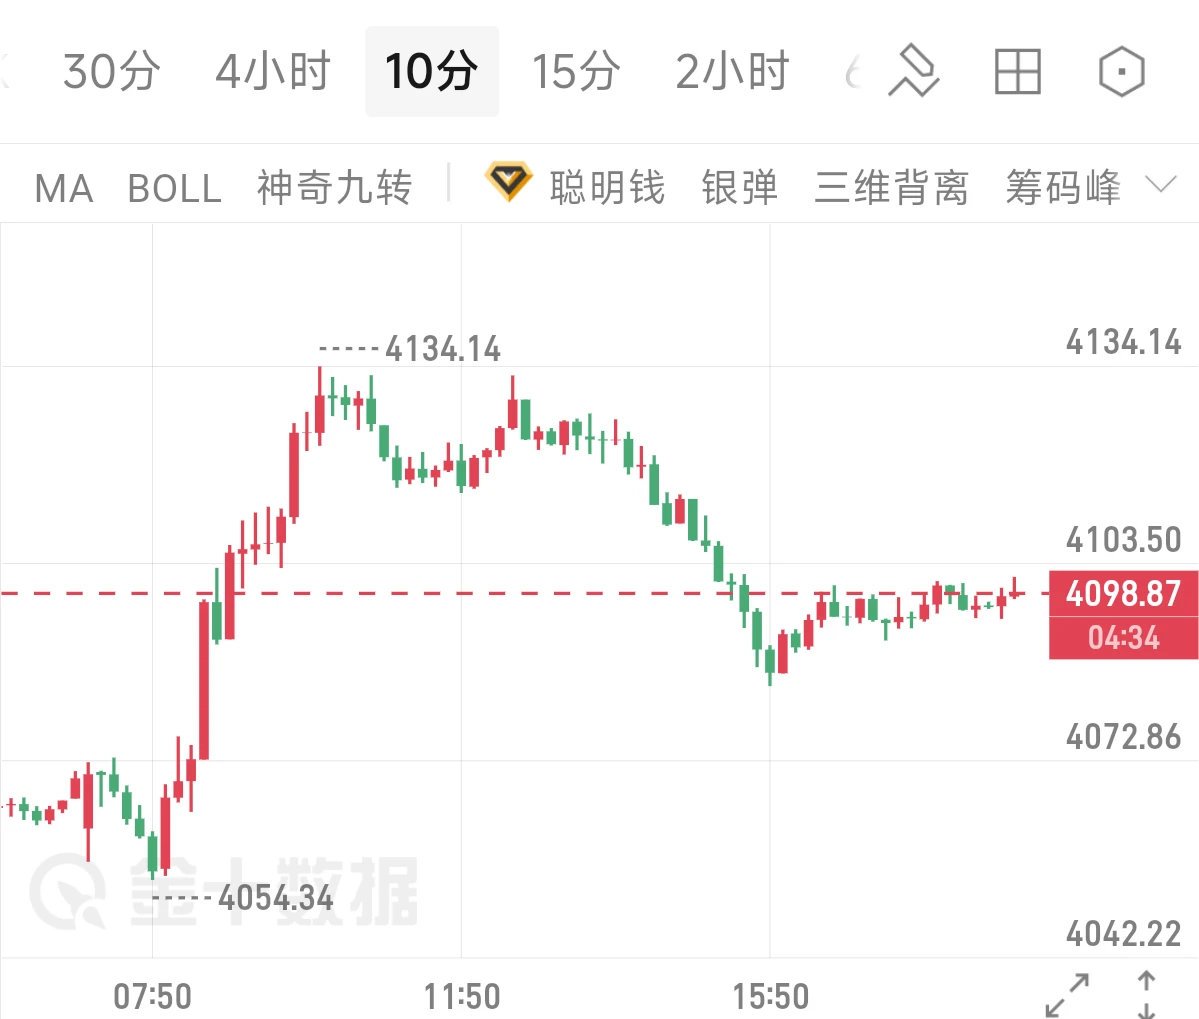
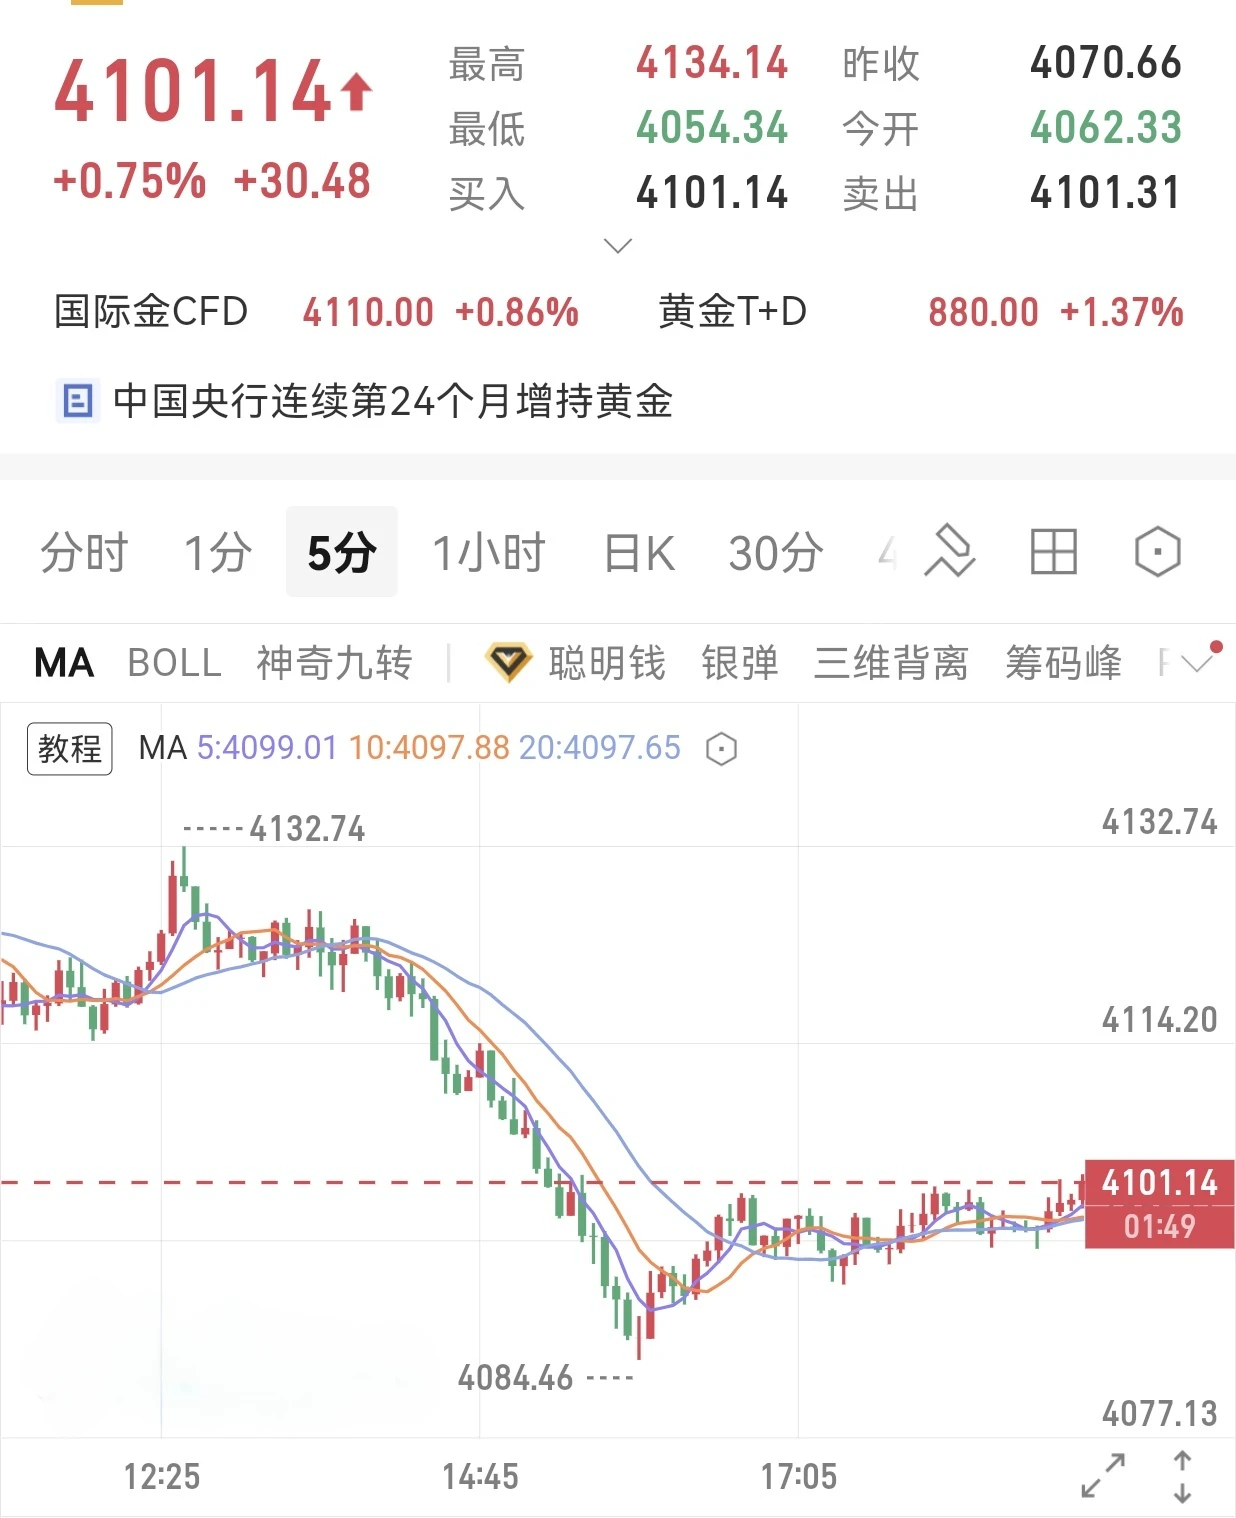
11.9 Gold Evening Review: Gold surged to 4134 before pulling back to consolidate; can it resume its rally after holding support at 4070?

Spot gold rose, then fell and recovered intraday. It rallied from a low of 4054 in the early session, with bulls quickly pushing it to an interim high of 4134. Profit-taking then emerged at the highs, sending prices lower in choppy trading. After testing support near 4072, prices stabilized and rebounded; the current quote is 4098. Bulls faced selling pressure after the intraday surge, and the market's center of gravity moved lower. In the short term, prices
post-image
XAUT+0.30%
Go long at the current price of 4101, with a unified stop at 4092 and targets at 4110 and 4125
Repeated failed attempts to break higher mean a big rally is coming! $XAU #BTC闪崩插针 #黄金 ‌
post-image
XAU+0.38%
📣 November 9 Daily Featured Posts: Great insights deserve to be seen
Does being oversold mean a reversal is coming? How can you tell a blocked rebound from support holding?
Today’s 6 posts cover market analysis and macro observations, as well as creators’ experiences with post red packets. Let’s take a look👇
🔹 @独领风骚必暴富: BTC, ETH, gold, and SanDisk: How to prepare for diverging market trends?
https://www.gate.com/zh/post/status/curated/25499385
🔹 @政和资本: How to respond to three scenarios: a blocked rebound, a stable retest
post-image
BTC-0.67%
ETH-1.26%
GLDX-0.40%
PAXG+0.37%
SNDK+3.53%
  • 8
  • 1
On the 4H chart, $AVAX is shorting at 7.985–8.008. Sellers must hold here, or I’m out. I want to see a rejection here, not a tug-of-war. A close above 8.13 invalidates this idea for me. Until then, I’ll just watch. Price at 8.00 is below the 4H EMA50 at 8.38, and sellers remain in control of the trend. The daily price is below the EMA200 at 8.77, so the higher timeframe is aligned too. BTC’s short-term bearish outlook supports this idea. Short at 7.985–8.008Take profit 7.914 / 7.860 / 7.778Stop loss 8.133Will price be rejected here, or will it hold above 8.13? Not investment advice; manage yo
post-image
AVAX-0.10%
#NvidiaCEOUnderInvestigation

NVIDIA CEO UNDER INVESTIGATION: JENSEN HUANG FACES A MAJOR CORPORATE AND NATIONAL SECURITY TEST

⚠️ THE NVIDIA BOARD HAS OPENED AN INDEPENDENT INVESTIGATION INTO ITS OWN FOUNDER AND CEO, JENSEN HUANG. The announcement on November 8, 2026, has placed one of the world's most influential technology companies under an entirely different kind of spotlight.

This is not simply another corporate controversy. The situation involves leadership responsibility, possible foreign intelligence activity, sensitive artificial intelligence technology, international chip trade, an
post-image
SPCX+8.74%
Jensen Huang embroiled in personal controversy, with Nvidia down over 2 in after-hours trading! Trum
live-cover
LIVE2,355
The weekly candle has closed—back to check our answers
$BTC ‌
Draw the chart first, then speak.

We agreed last night to compare answers today. First, one question: which of the three happens first? Reply 1 / 2 / 3.

1) The weekly candle closes back above the discipline line;
2) This week’s low is tested again;
3) Is the rebound’s volume greater or smaller than that of the decline.
My read hasn’t changed one bit: the downside extension isn’t over; the rebound is just a recovery. I’m not being stubborn—the bottom fractal hasn’t appeared, there’s no divergence, and the chart hasn’t shown anythi
BTC-0.65%
$UNI Buy more as it falls, buy more as it falls
post-image
UNI+3.05%
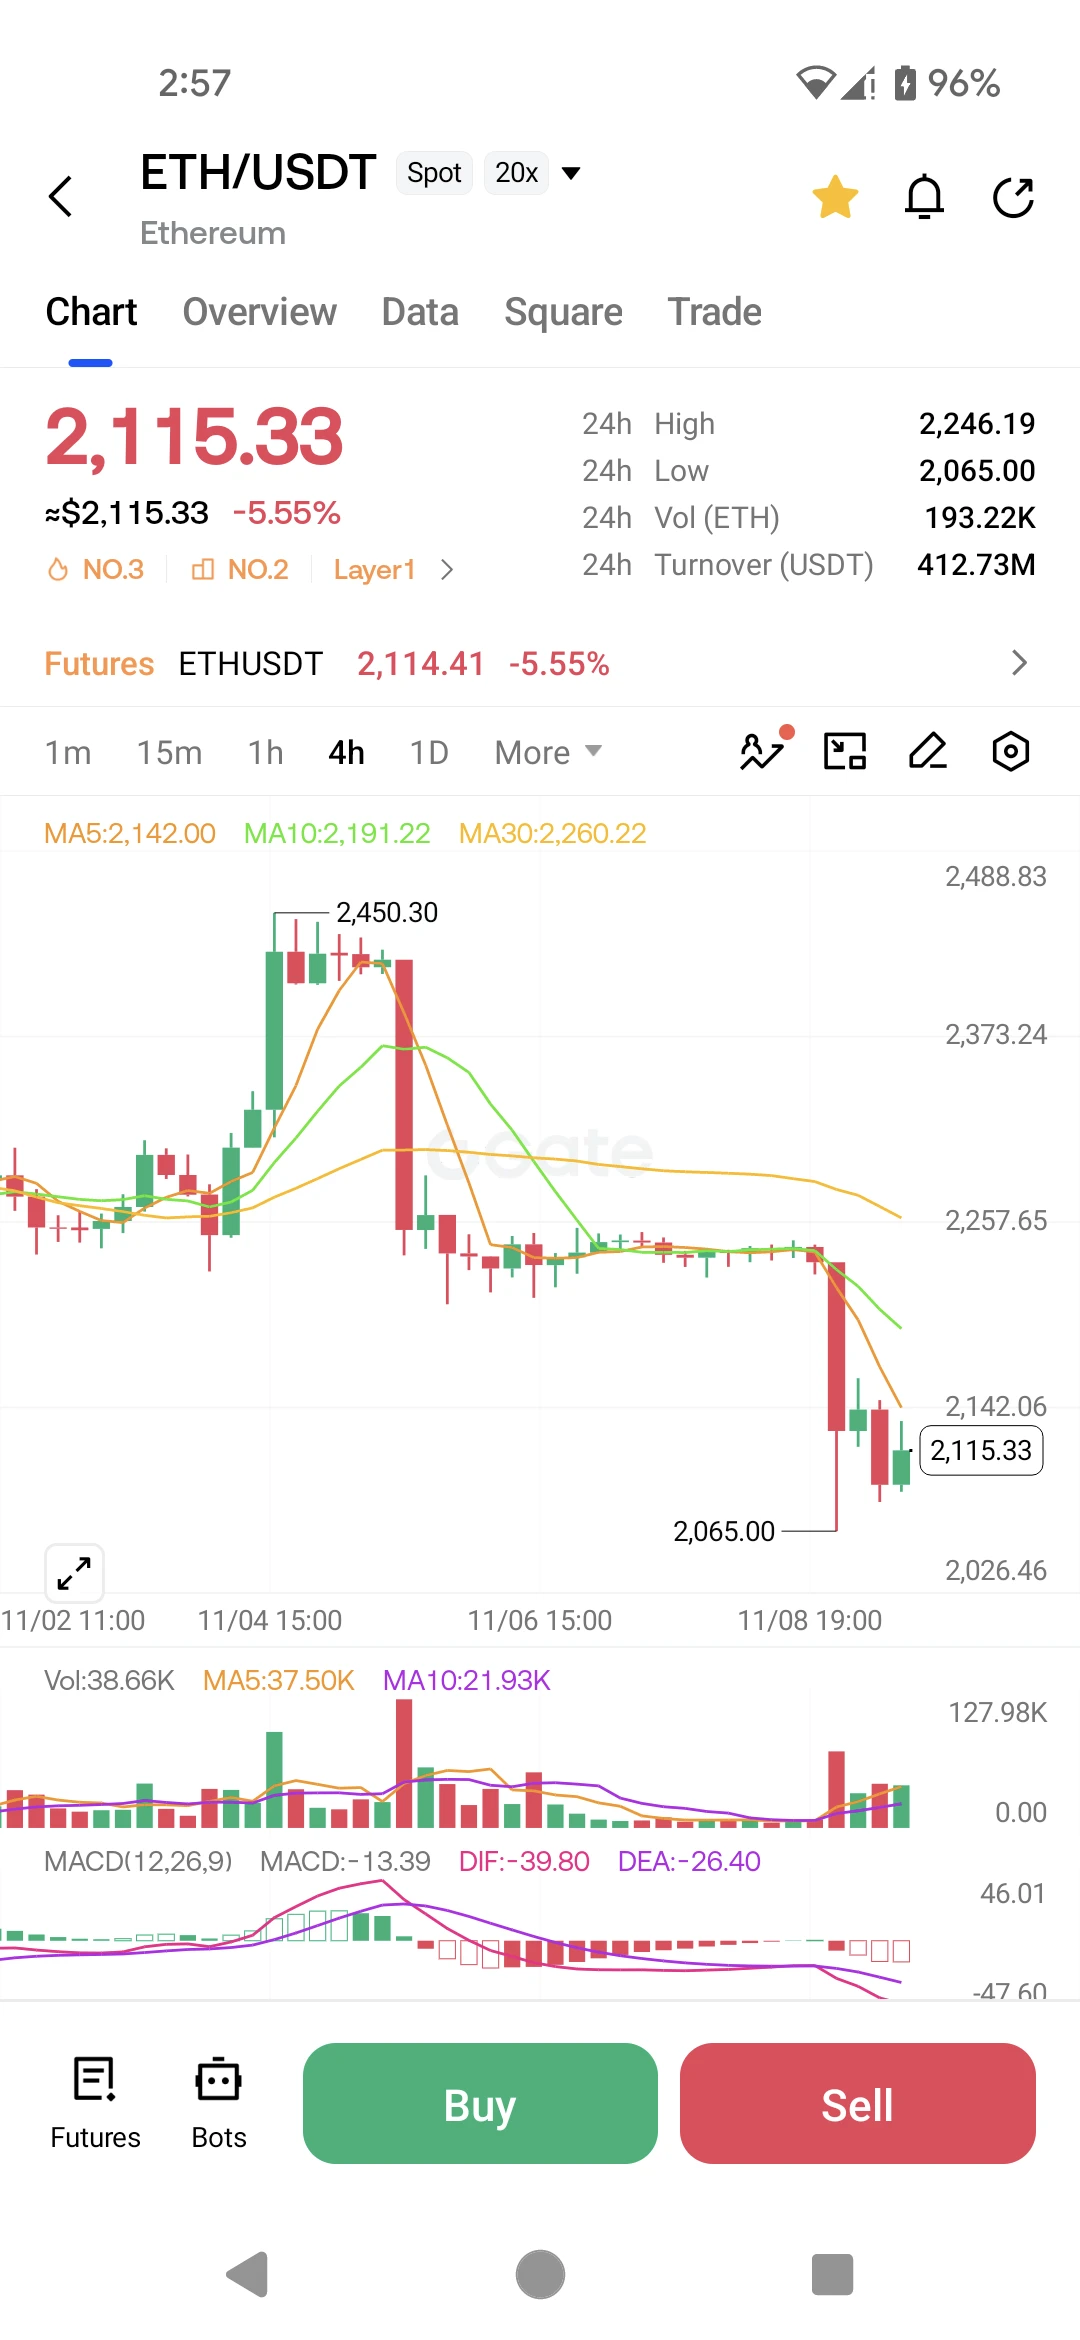
$ETH ‌SHORT: Ethereum is in a state of freefall, and the recent price action shows a complete capitulation of the bullish structure.

Trading Plan Short ETH
Entry: 2,110.00 - 2,130.00
SL: 2,200.00
TP1: 2,065.00
TP2: 2,020.00
TP3: 1,950.00

ETH is down a massive 5.55% today at $2,115.33, and the 4-hour chart is incredibly ugly for the bulls. Price has absolutely plummeted from the $2,450.30 high, slicing straight through all major moving averages. It currently sits far below the MA5 at $2,142.00, the MA10 at $2,191.22, and the MA30 at $2,260.22. This is a violent, wide-open bearish stack.

The
post-image
ETH-1.23%
Where does the money in futures contracts ultimately go?
This is a question well worth asking.
Because you’ll notice a strange phenomenon: almost everyone around you is losing money, but the “market” doesn’t seem to have made anyone any money either—so where does it all go?
The answer: It hasn’t disappeared; it’s being systematically drained. Futures trading isn’t a zero-sum game at all—it’s negative-sum.
First stop: Fees.
Every time you open or close a position, you pay. If you make 5 trades a day and 100 trades a month, fees alone can eat up several percent of your principal. High-frequency
post-image
BTC-0.65%
Who’s more of a scumbag, him or Jensen Huang?
Trump is the crypto world’s scumbag! Bah~
bitcoin:native
post-image
BTC-0.67%
Bitcoin ETFs saw a net outflow of $412 millionwith BlackRocks IBIT posting a net outflow of $403 m
live-cover
LIVE2,257
Wow $ETH is at $50,000 now
post-image
ETH-1.26%
Load More

Join 40 M users in our growing community

⚡️ Join 40 M users in the crypto craze discussion

💬 Engage with your favorite top creators

👍 See what interests you

Trending Topics

USCPIDataIncoming

34.28k Views1.91k Discussing

The U.S. October CPI report will be released on November 10 at 8:30 a.m. ET. September CPI came in at 3.7% year over year, and markets will be watching closely for signs that inflation is cooling, especially in core CPI. A softer-than-expected reading could strengthen rate-cut expectations, while hotter inflation may pressure risk assets through higher Treasury yields and a stronger dollar. How do you think this CPI print will move $BTC, U.S. stocks and gold?

RedBullDoublePodiumInBrazil

5.19k Views30.55k Discussing

BTCFlashCrash

135.82k Views66.35k Discussing

View More