Square
Following
Hot
News
Notifications
Profile
Share your thoughts
placeholder
Article
Short $XRP as the price approaches the 0.8904–0.8946 zone on the 4-hour chart. Sellers need to hold this area. If the price is clearly rejected here, it will continue downward. I’d rather wait than chase the market. Reasons: - The daily trend is down, with the price below the EMA200 at 1.287. - On the 4-hour chart, the price is 0.892, below the EMA50 at 0.978, and the trend remains bearish. - The 1-hour RSI is 40, leaving room for further downside before a rebound. 🔴 Short · Entry 0.8904–0.8946 · Take profit 0.8772 / 0.8670 / 0.8517 · Stop loss 0.9180Will sellers step in, or will buyers brea
post-image
XRP-1.15%
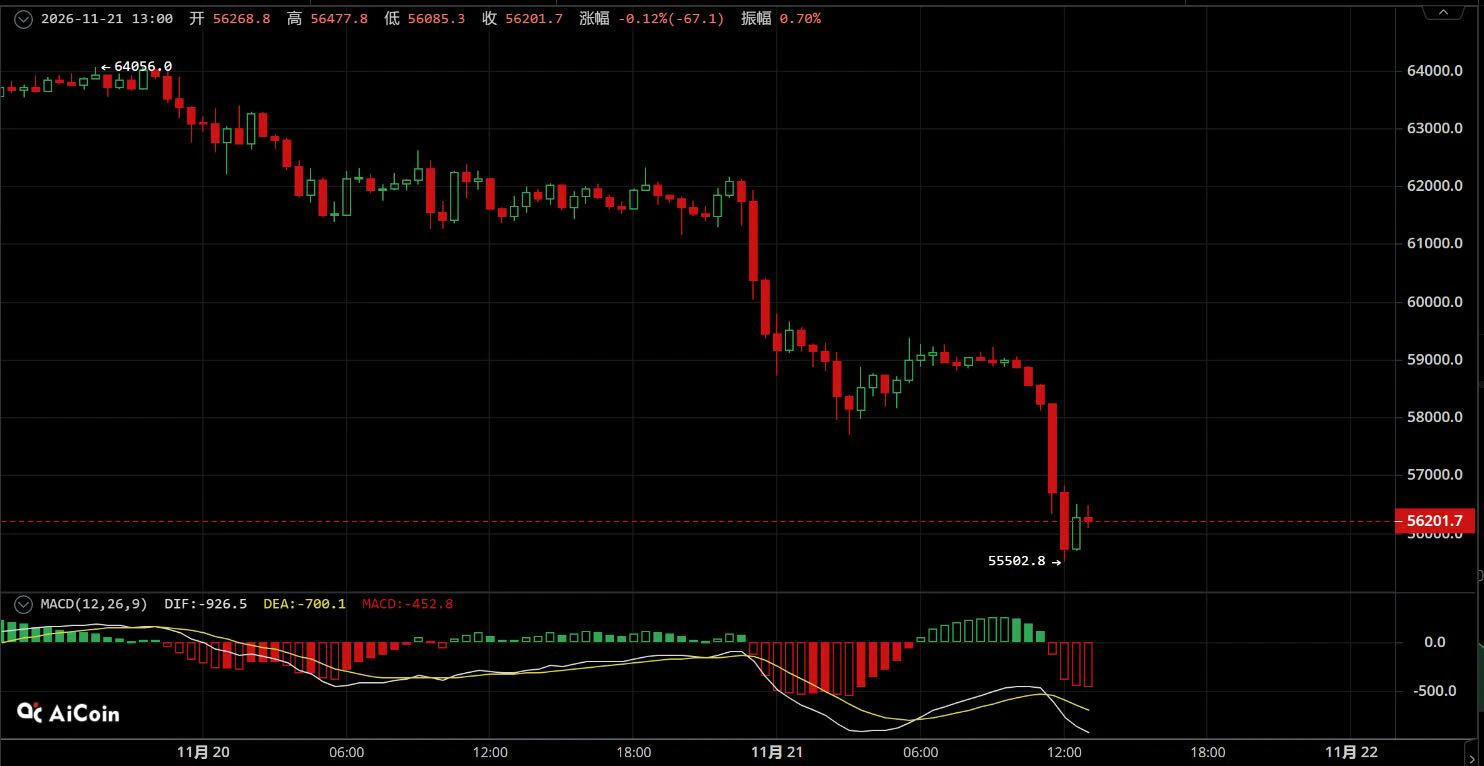
Nov 21 $BTC accelerated its plunge to set a new period low; short the rebound in line with the trend

【Trading Strategy】
Short entry range: Enter on a rebound to 56900-57300
Stop loss: Above 57800
Take-profit targets: First target 55600-55400, second target 55000-54700

【Core Logic】
On the 30-minute chart, two rounds of stair-step accelerated declines took price from a high of 64056 to a new period low of 55502.8. This was a concentrated wave of selling across the broader market, and the overall downtrend is now fully established.
The current move is merely a weak recovery after the sharp plun
post-image
BTC-0.67%
Trenches
FIONA
F
bade
b
FIONA
B34n...pump
Market Cap
$
Change
.
24h Vol
$.
Holders
.
PIEVERSE
P
bade
b
PIEVERSE
0x0e...25a9
Market Cap
$.
Change
.
24h Vol
$.
Holders
.
mihao
m
bade
b
mihao
4Cxj...pump
Market Cap
$.
Change
.
24h Vol
$.
Holders
.
CLAUDIA
C
bade
b
CLAUDIA
2j5S...W2ZM
Market Cap
$.
Change
.
24h Vol
$.
Holders
.
IDOL
I
bade
b
IDOL
0x3b...ab07
Market Cap
$.
Change
.
24h Vol
$.
Holders
.
$EVAA - Will do this soon 📉 Short now, huge profits are coming. Take profit: 0.50 🤫🤣
post-image
EVAA-0.49%
Does the child have the potential to debut
post-image
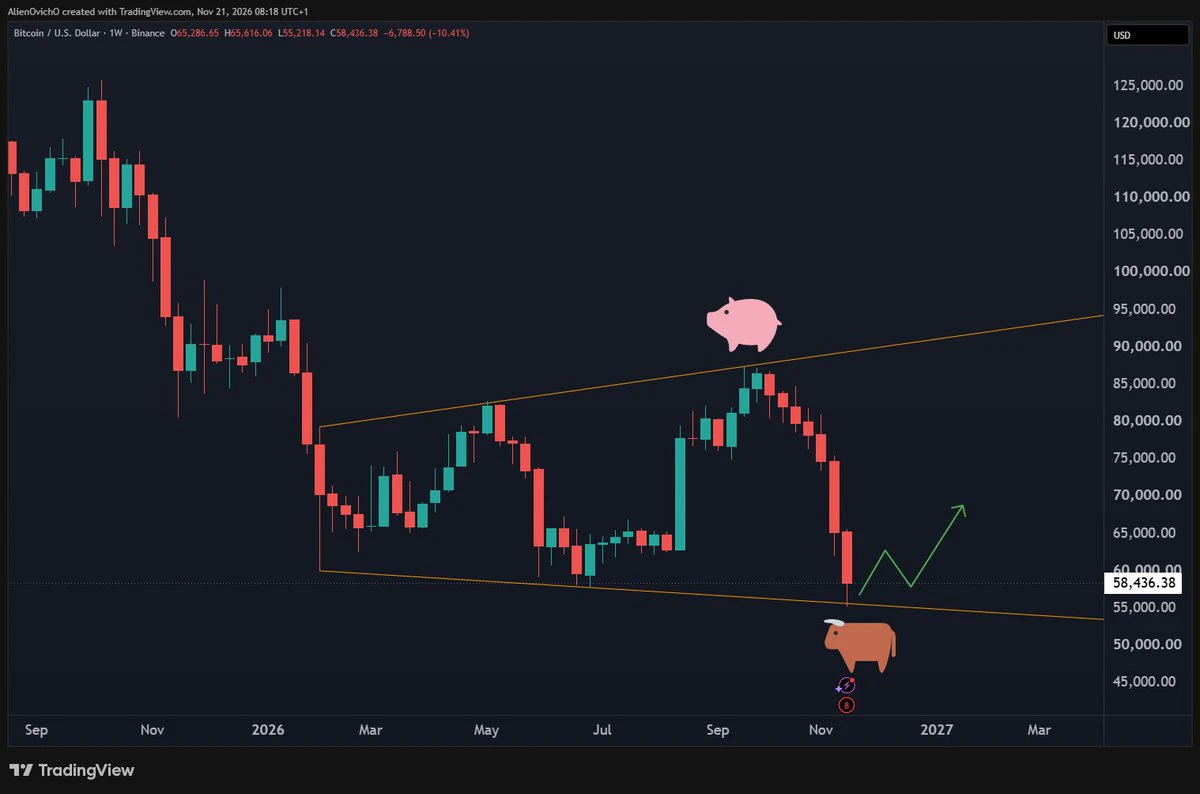
Pigs got slaughtered at the channel top, and now bulls are stepping in at the bottom 🐂
bitcoin:native tagged 55K megaphone support on the weekly.
Bitcoin Bottom in, or one more flush?
post-image
BTC-0.67%
whale adds 10.2 million in long silver position
live-cover
LIVE2,388
BTC-0.67%
ETH-1.26%
BTC Falls Below 58,000 USDT, Down 7.75 in 24 Hours
live-cover
LIVE3,463
ETH-1.26%
BTC-0.67%
SOL-0.77%
ZEC+1.16%
HYPE+0.24%
Ke Jie is the first superintelligent human to be taken down by AI.

Since yesterday, I’ve received a lot of private messages. Friends have all been asking: After AI takes down human intelligence (such as math), what can we still do?

Well, let’s take a look at what he’s doing now.
  • 2
  • 1
#BTCFallsToLowestSinceSeptember
#ShareWeekly #ETH #WCTCS9

Ethereum at $1,636: Is the Market Building a Recovery or Preparing for Another Decline?

Ethereum is showing signs of short-term stabilization after a massive sell-off, but I believe traders should remain cautious before calling this a market bottom. ETH is currently trading around $1,636.49, with a 24-hour low of $1,538.09 and a high of $1,763.37. This wide trading range reflects significant uncertainty, aggressive selling, and rapidly shifting market expectations. $ETH ‌
post-image
ETH-1.26%
I’m worried the market’s been so intense these past few days that if I drink coffee, I might drop dead.
I’ve switched from coffee to ginseng tea. I really do value my life.
I’ll pick someone in the comments who’s as delicate and health-conscious as me and send them a quarter’s supply of Eagle Brand Ginseng Tea🍵. Let’s get healthy together.
Not an ad—just because I love my fans😘😘😘.
post-image
$AKE The risk-off period is over. I’ve closed out everything. Bye
post-image
AKE+6.07%
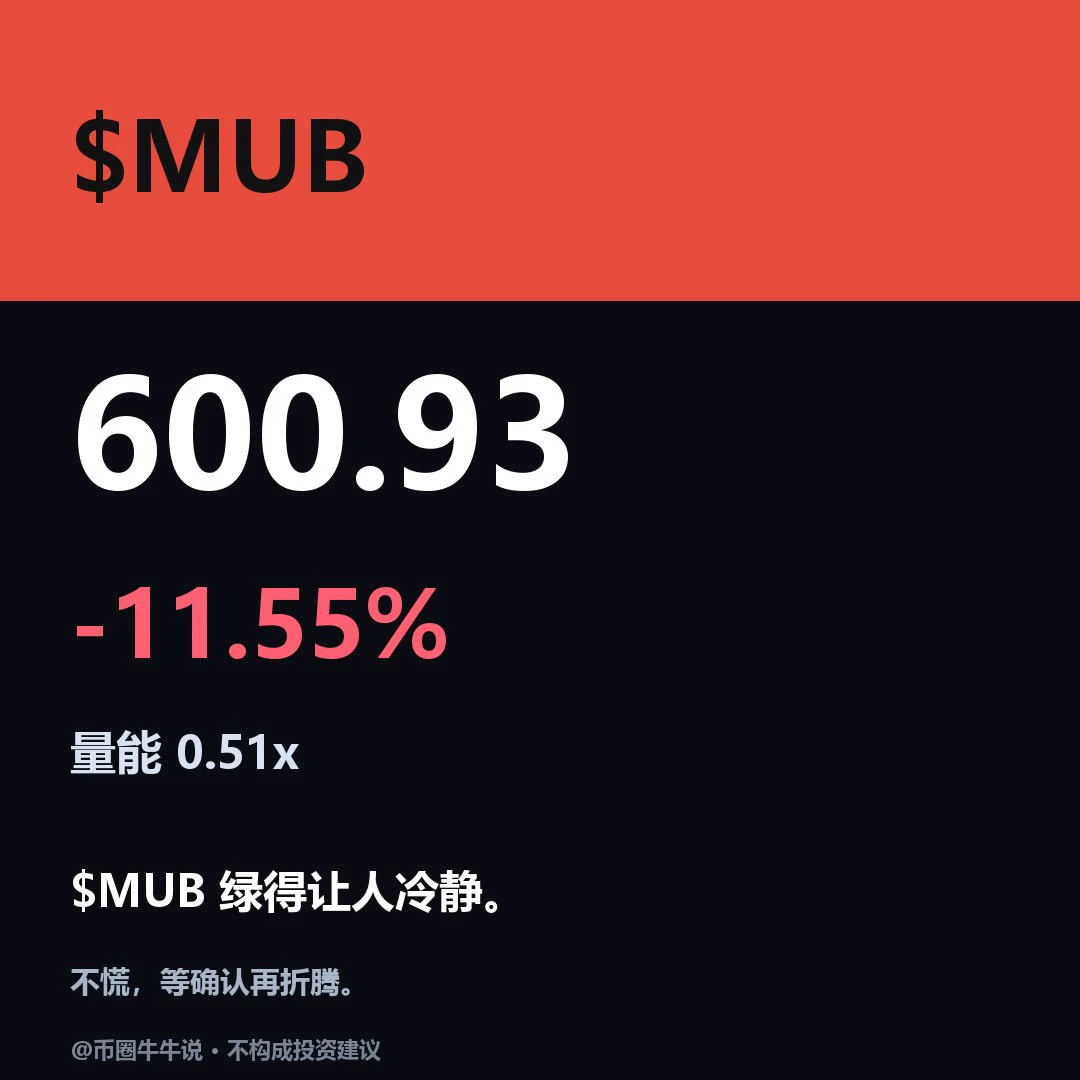
$MUB Currently trading at 600.93, down 11.55% over 24H. The 1h RSI is 42, so it’s not oversold yet. Volume is only 0.5x the average, making a rebound unlikely. Key support is 584.96; if it breaks, watch for the next downside level. Only if it holds can we consider a rebound to 675.06. Don’t rush to buy the dip—wait for volume confirmation before deciding. For now, keep an eye on 584.96 and reduce your position if it breaks. Without a surge in volume, any short-term rebound is likely to fizzle. Not investment advice
#MUB
post-image
Openly short $ETH ‌
ETH-1.23%
$BTC How do you say “tripled in two days”
post-image
BTC-0.65%
The easy thing to do is to give up and walk away from $ICP or your other investments.
But…… Normal doesn’t separate you from the regular normie, i am choosing the hard way!!!!
Holding my $ICP and adding more on every possible opportunity
post-image
ICP-1.14%
🇺🇸 Schumer says Trump and Lutnick "sold out America" by approving Nvidia and AMD AI chip sales to China.
Is letting China buy these chips a risk to the US AI lead, or a revenue win for the chipmakers?
NVDA-13.84%
AMD-13.27%
$NVDA This selloff has been pretty brutal😥The stock fell another 14% last night, closing at $125.53, down about 47.5% from its record high in early October—nearly cut in half. Strangely, Nvidia just reported quarterly revenue of $115.8 billion, up 103% year over year, yet even such stellar results failed to stop the stock from plunging further. On top of the management crisis brought on by Jensen Huang’s departure, Reuters reported last night that the SEC is investigating potential accounting issues at Nvidia. The investigation has yet to reach a conclusion, but it has clearly dealt a further
post-image
NVDA-13.84%
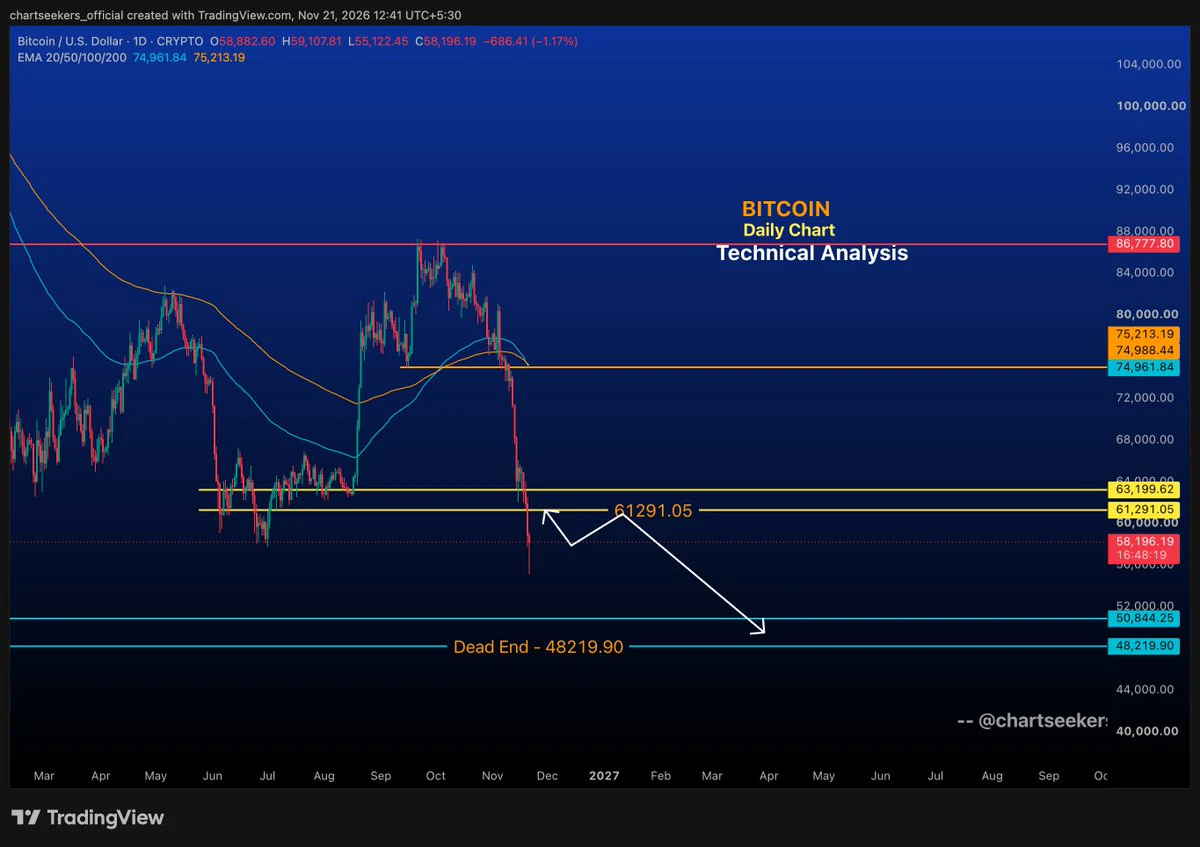
bitcoin:native — DAILY OUTLOOK 📉
The breakdown is getting serious. Bitcoin has lost the crucial $61,291–$63,200 support zone, and the price structure remains weak.
Key levels to watch:
$61,291–$63,200: Resistance zone. Reclaiming this area is essential for recovery.
$58,000: Current price area; downside pressure remains.
$50,844: Next major downside level.
$48,219: Potential final destination of this corrective move.
A relief bounce towards $61.3K is possible, but unless BTC reclaims and sustains above this zone, the risk of further downside remains.
The bigger picture: Don't confuse a relief
post-image
BTC-0.67%
‌This week, I chose to observe rather than trade. That is because the market is no longer pricing in direction, but rather pressure. In the latest session, the Nasdaq fell 2.25% to 23,879, while the S&P dropped 2.03%. There isn’t a single piece of news behind this crisis; interest rates, AI-related factors, and liquidity are all tightening simultaneously.

My focus this week has been on metals.

For me, gold is the primary indicator. It is currently hovering around $3,550—down 9% in November and reaching a 14-month low. Silver is trading near $42, having fallen 22% in November. Copper is in
post-image
SPX+0.33%
XAU+0.38%
XAG+0.47%
XCU+0.20%
BTC-0.67%
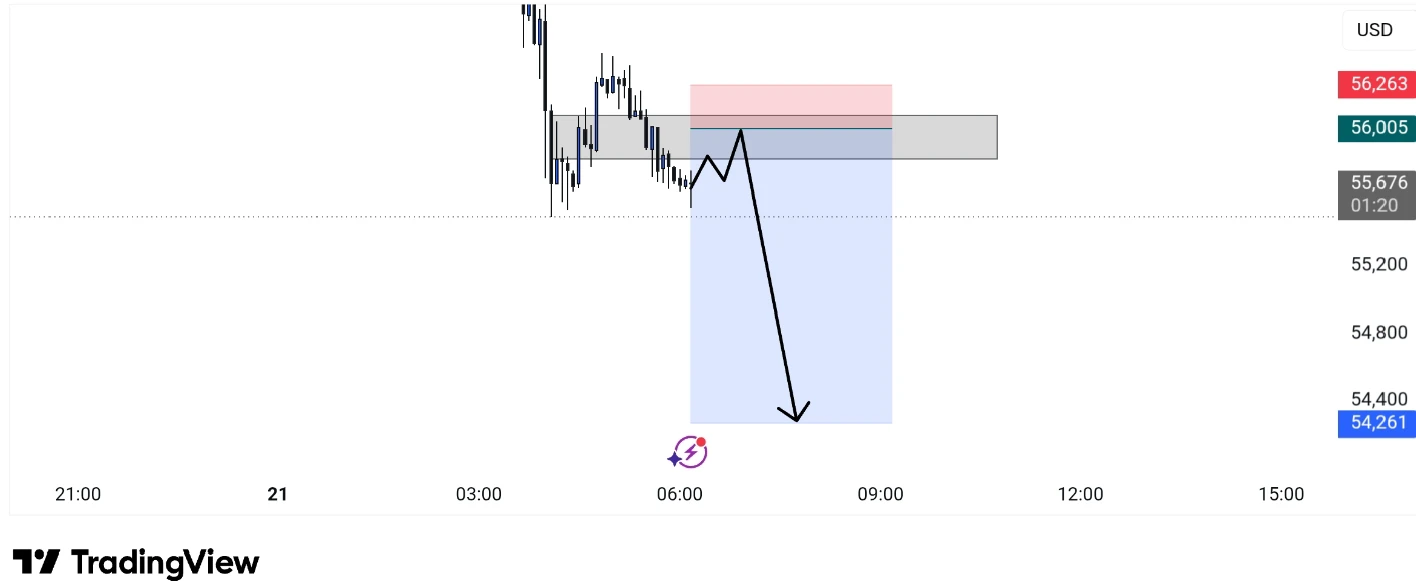
BTCUSD SELL SETUP | Bearish Continuation Watch

Bitcoin is facing selling pressure, and the current structure suggests a potential downside continuation if resistance holds.

BTCUSD — SELL / SHORT SETUP

Current Price: $55,676

* Entry Zone: $55,700 – $55,800

* TP1: $55,000

* TP2: $54,500

* TP3: $54,000

* Stop Loss: $56,300 – $56,400

### Technical Outlook | 5-Minute Chart

BTC is consolidating below a key supply zone following a strong bearish displacement. The current structure suggests that price may attempt a short-term pullback toward resistance before its next directional move.

I'm
post-image
BTC-0.65%
  • 1
Load More

Join 40 M users in our growing community

⚡️ Join 40 M users in the crypto craze discussion

💬 Engage with your favorite top creators

👍 See what interests you

Trending Topics

BTCBreaksBelow60K

2.1M Views29.2K Discussing

BTC fell below $60,000 on November 20 for the first time since July, alongside a tech stock selloff and broader pressure on risk assets. Will $60K become resistance, or can BTC quickly reclaim it? What price or volume signals would convince you that selling pressure is easing?

GateDirectIPOPhase3ANTAllocates92100Shares

743.3K Views4.8K Discussing

NvidiaDropsNearly14Percent

312K Views7.5K Discussing
View More