







Share your thoughts
placeholder
Article
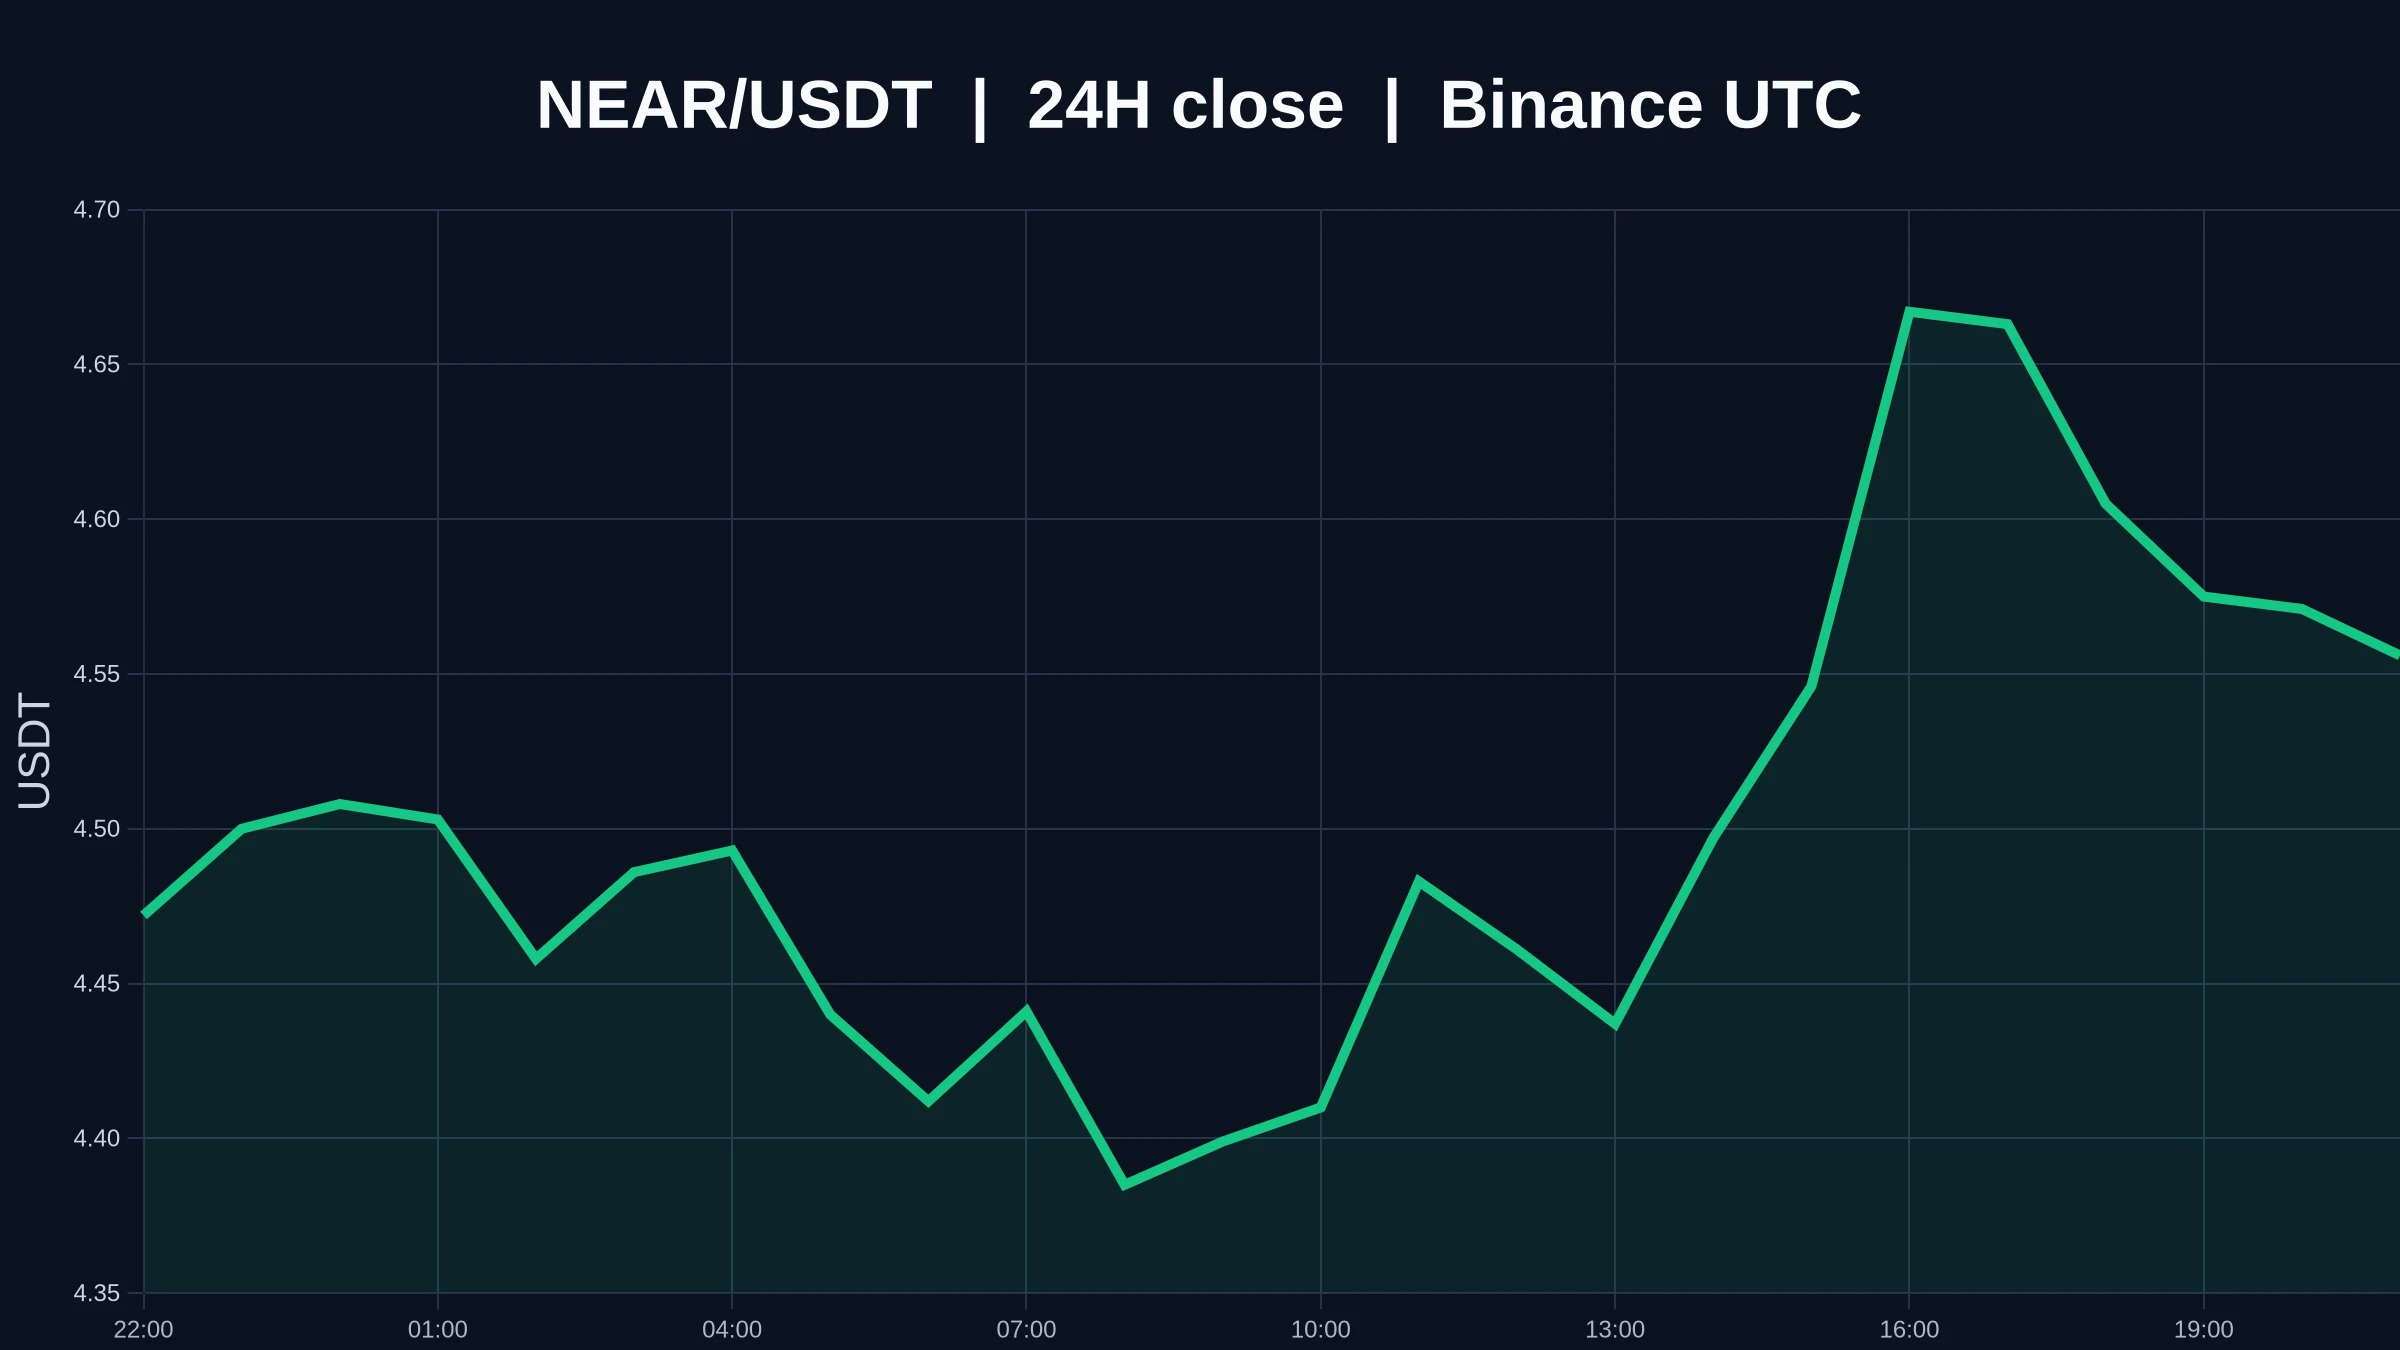
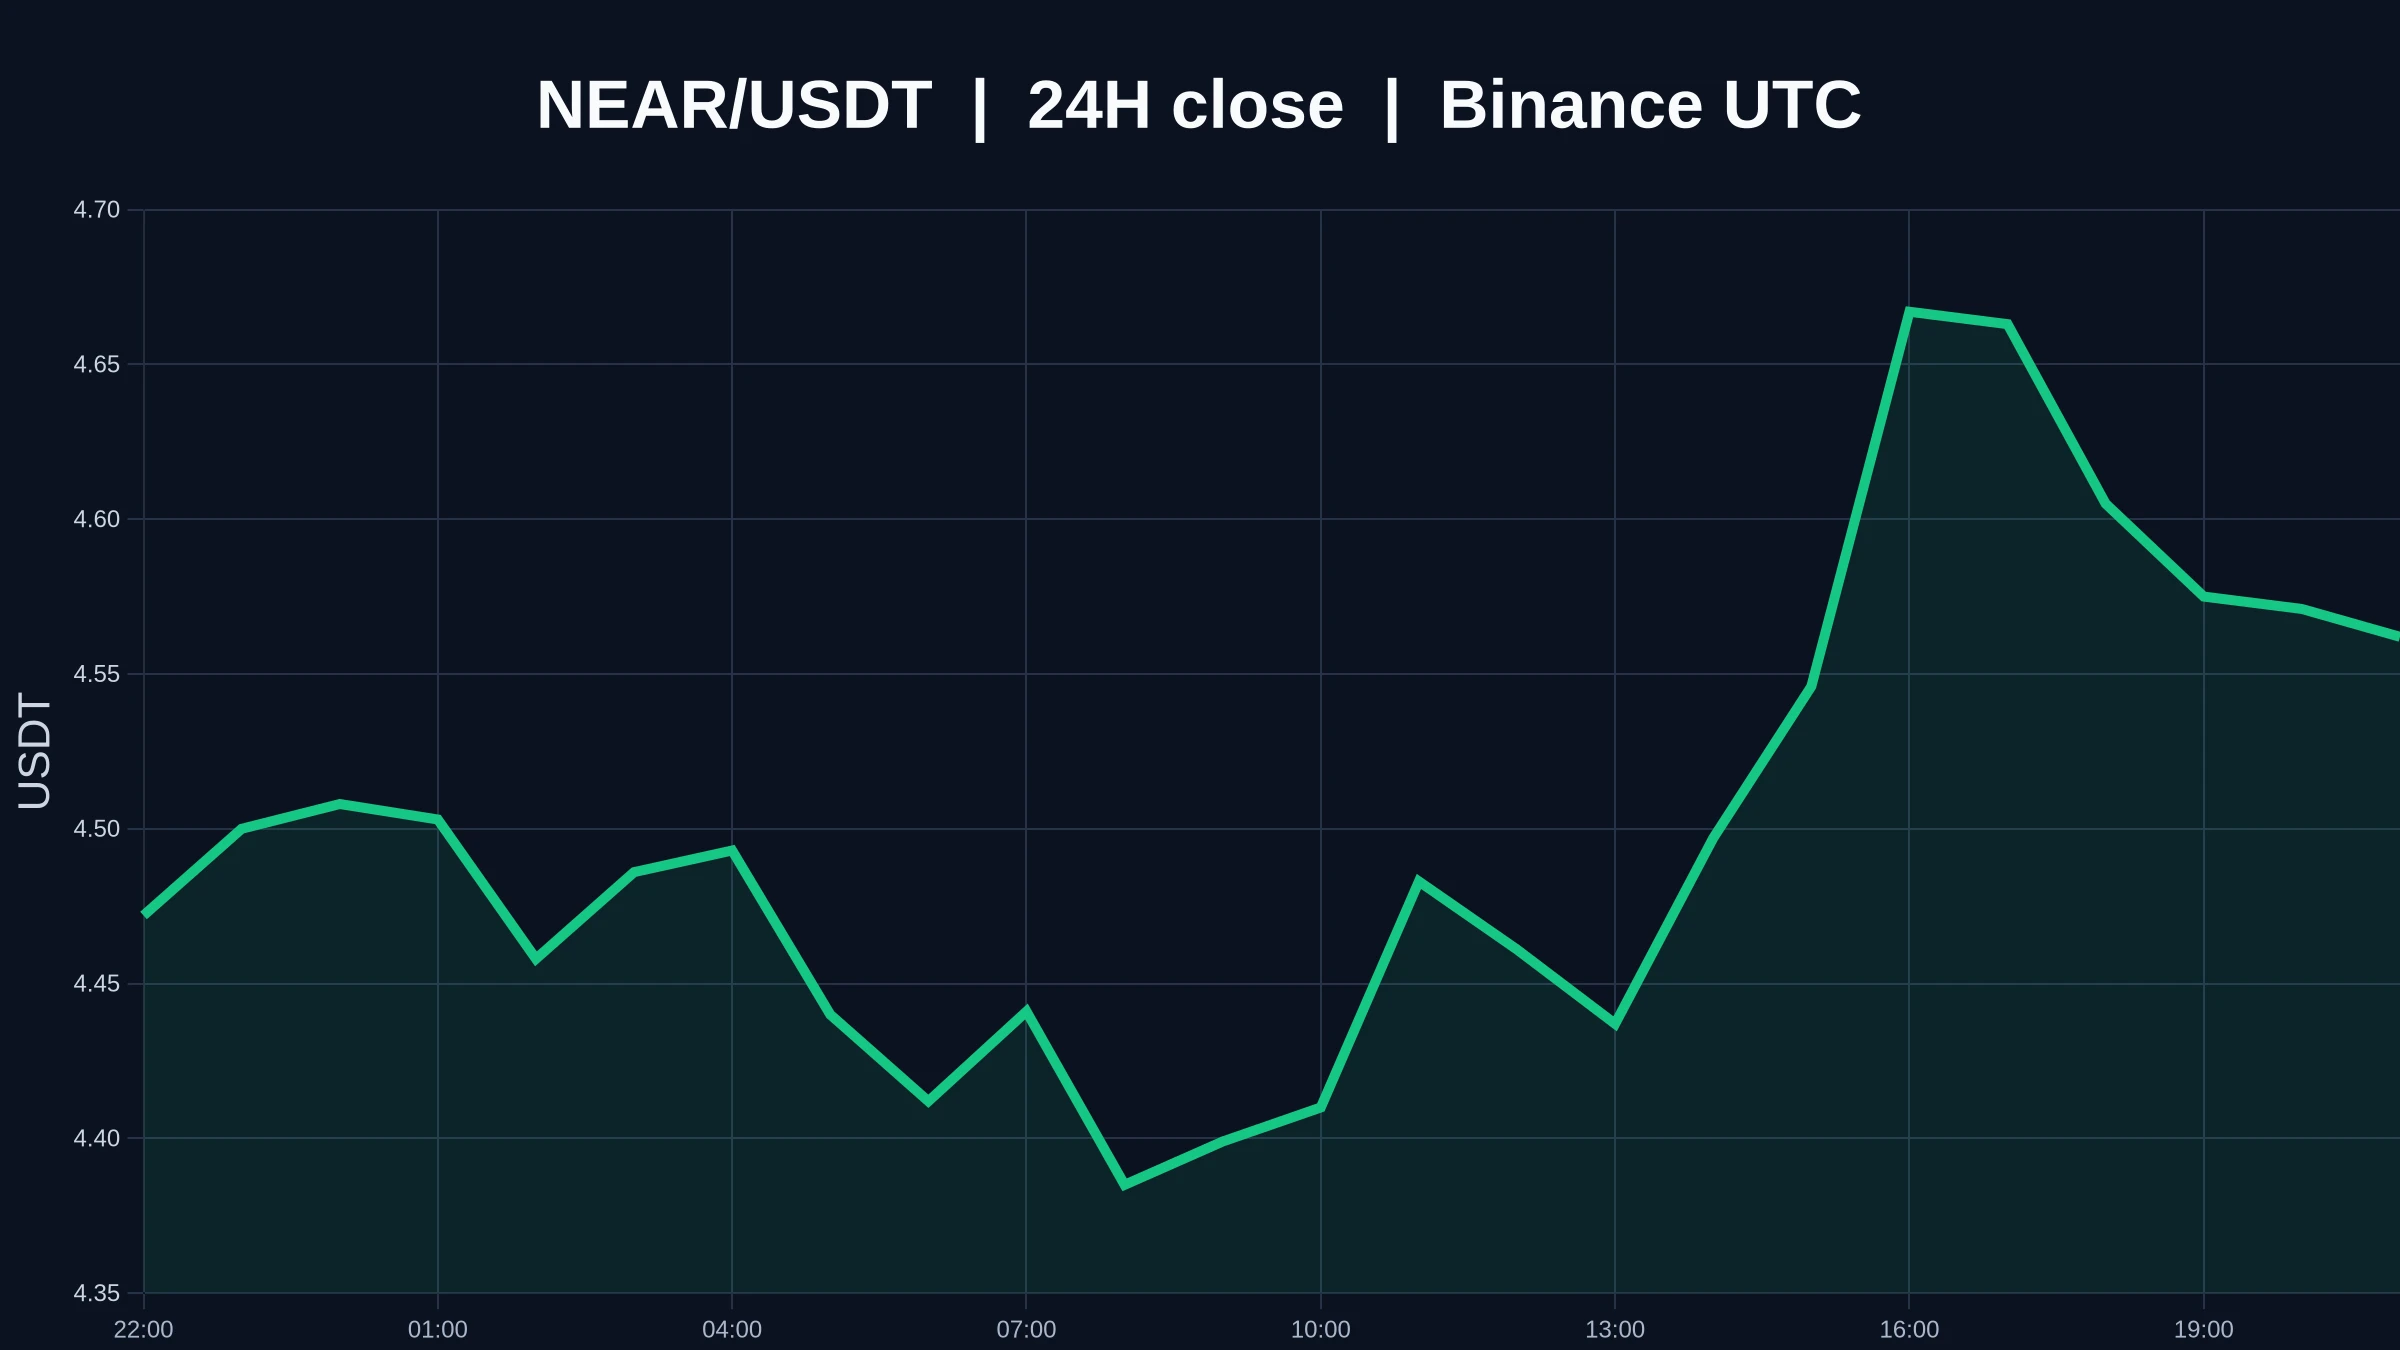
Everyone’s staring at NEAR’s 2.17 level—but the 95% confidence score says they’re looking at the wrong chart.

$NEAR /USDT - LONG

Trade Plan:
Entry: 2.1593 – 2.1835
SL: 2.0551
TP1: 2.2586
TP2: 2.3168
TP3: 2.4041

Why this setup?
- 1D trend is bullish, and 4h momentum is aligning for a breakout, not a breakdown.
- RSI on 15m is cooling at 40.42—this is the reset before the push, not exhaustion.
- Entry zone 2.1593–2.1835 is tight; TP1 at 2.2586 is only a 4% move away, but TP3 at 2.4041 is the real prize.
- Why now? The pullback is shallow (ATR 0.048), meaning sellers are weak—buyers a
NEAR+2.62%
Everyone’s watching SUI’s 0.80 level—but the 4h chart is whispering a different secret.

$SUI /USDT - SHORT

Trade Plan:
Entry: 0.7976 – 0.8028
SL: 0.8247
TP1: 0.7818
TP2: 0.7696
TP3: 0.7512

Why this setup?
- RSI on the 15m is at 51.8, not overbought, not oversold—just dead air before a move.
- ATR 1h at 0.0102 means volatility is compressed; breakouts here are violent.
- Entry at 0.8002 with TP1 at 0.7818 is a 2.3% scalp, but the real target is TP3 at 0.7512 if the range floor cracks.
- Why now? The 1D trend is “range”—but price is hugging the upper rail, and short setups from resis
SUI+6.14%
$1000 to $100,000 Crypto Trade Challenge Today
live-cover
LIVE1,407
This move in $SKHYNIX has been steadier than I expected. When the overnight session pulled back to around 1165.42, it did not break through the key level I was watching, so I chose to open a long position, with a stop-loss that was not set too tight. In futures, the biggest fear is that the direction has not changed but you get stopped out first, so I was fairly patient with that trade.

After it rallied into the 1277.62 range, I first closed 70% of the position and locked in the floating profit; for the remaining 30%, I moved the protection level higher—exit if it breaks down, and keep watch
post-image
SKHYNIX+0.32%
SNDK+1.85%
DOGE+6.57%
$MU $SNDK $EWY $DRAM closed the week with a BREAKOUT 💥
MU+5.89%
SNDK+11.88%
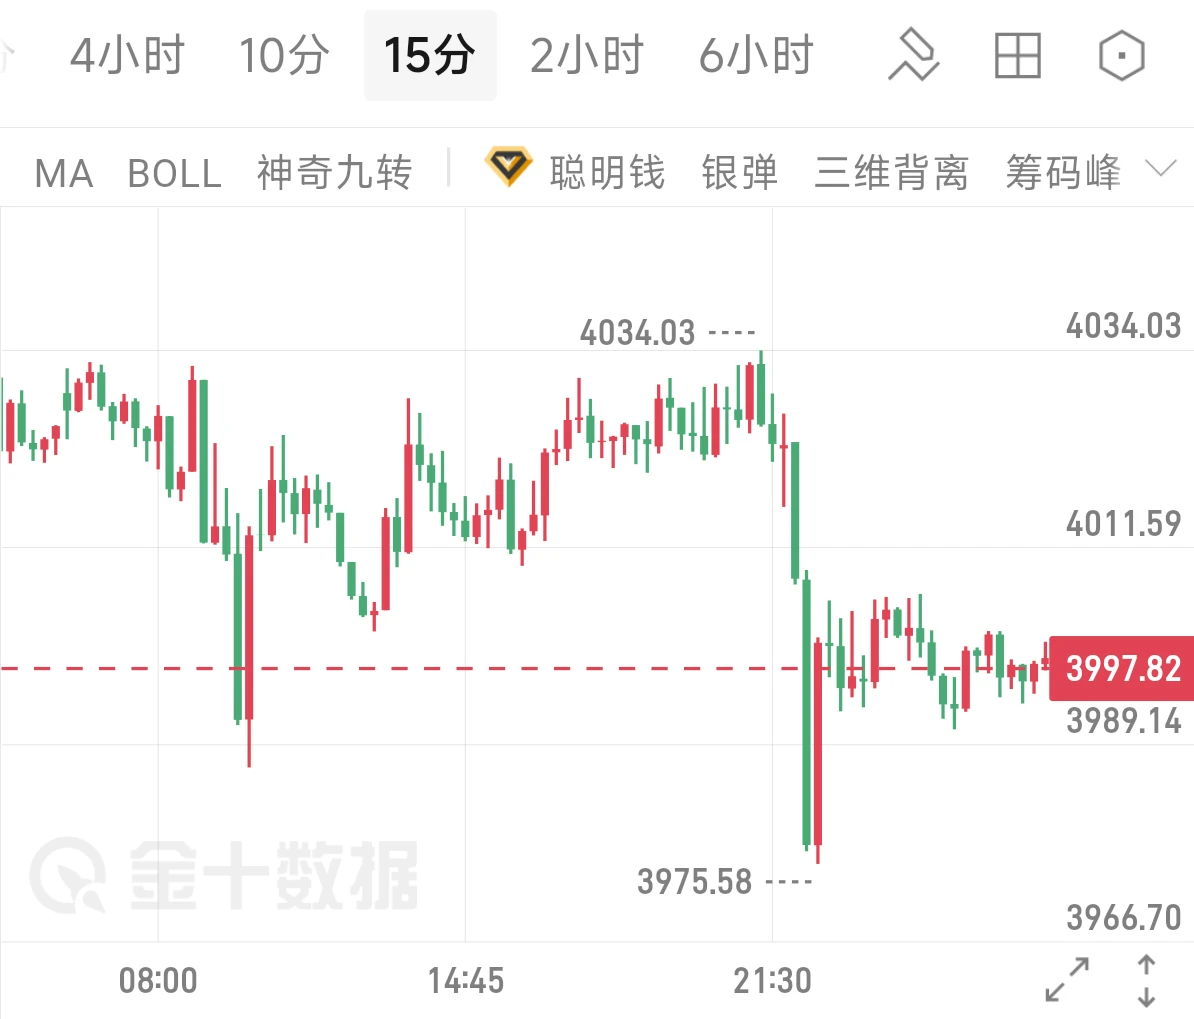
Everyone’s staring at gold, but $XAG /USDT just flashed a quiet 4h sell signal that nobody’s tweeting about.

$XAG /USDT - SHORT

Trade Plan:
Entry: 66.29 – 66.35
SL: 66.60
TP1: 66.11
TP2: 65.97
TP3: 65.77

Why this setup?
Why now? The 1D trend is sideways, but the 4h timeframe is whispering SHORT with 55% conviction—not a scream, just a nudge.
- Entry sits at 66.32, with immediate downside targets at 66.11 and 65.97.
- RSI on the 15m is cooling at 59.17, losing bullish steam.
- ATR (1h) at 0.115 shows the squeeze is tight—breakouts here are fast, not lazy.
The range-bound daily act
XAG-0.17%
I don’t chase after a volume-backed surge; that’s a rule I set for myself. When $ETH surged to 2485.57, volume did indeed pick up, but such a sudden expansion often means short-term divergence is intensifying, and chasing in makes it easy to get stuck at the top.

I entered my long position earlier, when the price repeatedly tested the key level around 2394.32. The key level held each time, and the rebounds after each pullback kept getting faster. I got the feeling that someone was accumulating at lower levels, so I followed and went long.

After the move played out, I still took profit on
post-image
ETH+1.20%
ZEC-0.33%
ADA+4.53%
Everyone’s chasing PEPE longs—but my 4h tape just flipped a quiet SHORT signal.

PEPE/USDT - SHORT

Trade Plan:
Entry: 0 – 0
SL: 0
TP1: 0
TP2: 0
TP3: 0

Why this setup?
Why now?
- Range-bound on the daily = no trend to trust, only mean reversion.
- 15m RSI at 59.24 shows mild bullish pressure, but that’s exactly the trap before a dump.
- Confidence sits at 55.4—not screaming, but enough to fade the next pump.
- With ATR near zero, volatility is coiled; the breakout direction is down.
- Status: “Waiting”—so we’re early, not late.

Debate:
Is PEPE dropping to retest range lows, or
PEPE+3.35%
$PI Pi doesn't have what it takes. TRB is the real deal.
post-image
PI+1.34%
  • 1
$BTC 's Recent bear market trend has seen a -54% drawdown top to bottom.
This was while all other markets were rallying hard, which is a good argument as to why it was "just" -54% this time around. Arguably, price would see a much larger drawdown if stocks and everything were down a lot too during this time.
This was a very isolated bear trend this time around.
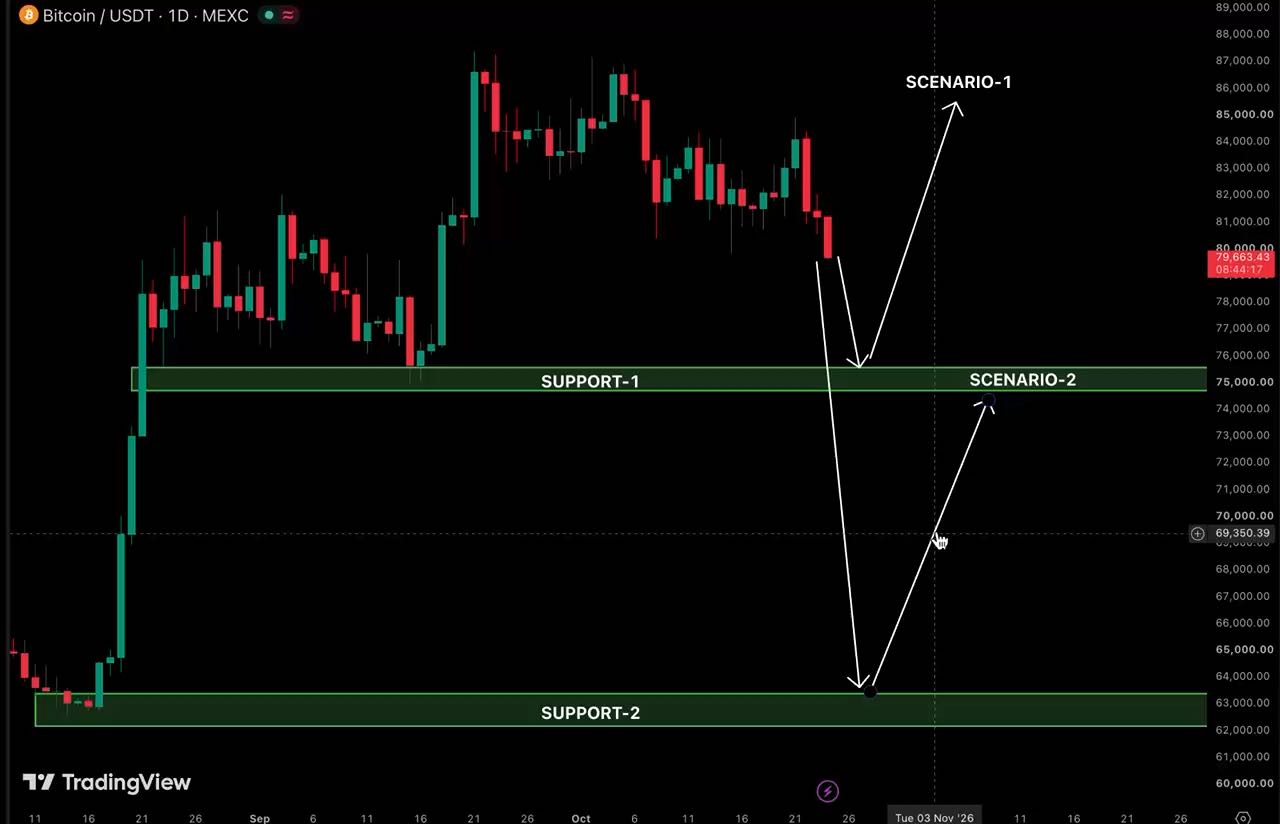
#Gate60MillionUsers #BTCReclaims80K
post-image
BTC+0.18%
  • 7
Crypto Signals and Trding Insights
live-cover
LIVE21
HYPE breaks above $88 to hit a new all-time high! Is this takeoff, or is the market starting to get overexcited?
HYPE really has “something going on” this time—the price broke above $88, directly setting a new all-time high. For holders, this is more than just a number; it is the result of market sentiment, capital attention, and ecosystem expectations coming together.
What deserves the most attention is that HYPE’s market narrative has clearly heated up after breaking its previous high. Usually, when an asset breaks through its all-time high, it means less overhead selling pressure from trapp
HYPE+1.66%
  • 46
Everyone’s staring at ONDO’s 0.371—but the 95% score says you’re early, not late.

$ONDO /USDT - LONG

Trade Plan:
Entry: 0.370 – 0.372
SL: 0.363
TP1: 0.377
TP2: 0.381
TP3: 0.388

Why this setup?
Why now?
- 4H bias is LONG with 95% confidence—the algo smells a breakout before the crowd does.
- Daily trend is bullish; pullback to 0.371 is the *last* cheap ticket before TP1 at 0.377.
- RSI 15m at 50.2 = neutral fuel, not exhaustion. ATR 1h (0.003465) shows tight coils—squeeze ready.
- SL at 0.363 is a 2% risk for a 4.5% ride to TP3 (0.388). Asymmetry is your edge.

Debate:
Are you ad
ONDO+4.22%
Everyone’s staring at HYPE’s 85.5—but the real trap is waiting at 87.3.

$HYPE /USDT - LONG

Trade Plan:
Entry: 85.356 – 85.660
SL: 84.053
TP1: 86.600
TP2: 87.327
TP3: 88.419

Why this setup?
Why now? The 4h structure is armed LONG with 95% confidence, and the 1D trend is bullish—this isn’t a coin flip.
- Entry zone: 85.35–85.66 (tight, disciplined).
- RSI 15m at 56.5 shows room to run, not exhaustion.
- TP1 at 86.6 is the appetizer; TP2 at 87.3 is where the crowd gets greedy.
- Invalidation sits far below at 82.2—so the risk/reward is mathematically on your side.

Debate:
Do you f
HYPE+1.69%
Gemini on Android can shrink into a floating spark bubble so you keep the chat while you use other apps.
Open the Gemini overlay, ask something, then tap Minimize (or tap outside after a reply). It collapses to a spark bubble. Tap to expand. Drag to move or dismiss.
Would you leave Gemini parked on your home screen?
Don’t just show your profits! What’s really interesting is why you dared to bet on this side.
Recently, after taking part in Gate’s event contract P&L-sharing challenge, I found that the most interesting part of this format isn’t simply showing how much you made, but laying out your full market judgment.
The biggest appeal of event contracts is that every choice is based on a clear question: up or down? Breakout or pullback? Will a certain event ultimately happen?
My approach has always been fairly simple: look at the macro picture first, then price, and finally market sentiment. For example,
BTC+0.19%
I was just about to go to the forum and start cursing, but then I looked at my balance and thought, never mind—the market is always right. I placed the order before bed a few days ago and thought it would go to waste, but today $SUI gave the answer directly—entered at 0.7362, now at 0.8054, with an unrealized gain of +452.99%. Feels great, guys.
I didn’t use any fancy analysis this time; I just looked at whether the buying support was strong enough. Before the market had fully started moving, every pullback held the level, which meant someone was buying underneath. Since someone was buying, I
post-image
SUI+6.14%
BTC+0.19%
ADA+4.53%
A few days ago, $ARB broke out on heavy volume and held above the moving averages. I reminded myself not to hesitate and added to my long position with the trend. But the wicks early in the breakout were genuinely frightening, and my unrealized profit briefly shrank by more than half.
After the price strengthened again, I closed 70% of the position first and placed a trailing stop on the remaining 30%. Some people prefer to exit all at once, but taking profits in batches suits me better. Even if the price continues to surge on momentum later, I still have a position to participate with and won
post-image
ARB+40.30%
ZEC-0.33%
BNB+7.18%
SKYAI’s 95% short signal just armed—but the real trap is waiting below 0.05828.

SKYAI/USDT - SHORT

Trade Plan:
Entry: 0.05894 – 0.05954
SL: 0.06208
TP1: 0.05711
TP2: 0.05569
TP3: 0.05356

Why this setup?
- 4H bias is SHORT with a 95% confidence score—this isn’t a coin flip.
- Daily trend is bearish, and RSI on 15m sits at 41.12, still room to drop before hitting oversold.
- Entry zone 0.05924–0.05954 aligns with ATR’s 0.001184 volatility—tight risk for a 3-TP cascade down to 0.05356.
- Why now? Price is hugging the 1H pivot while momentum bleeds; the invalidation at 0.05828 is your
SKYAI+6.08%
Load More

Join 40 M users in our growing community

⚡️ Join 40 M users in the crypto craze discussion

💬 Engage with your favorite top creators

👍 See what interests you

View More