Share your thoughts
placeholder
Article
Would you chase BTC at $80,000?
Look at the surface first: the rebound has reached its target, but the direction remains undecided.
BTC rose 25% from 63,000 to 80,000 in August. After surging to 82,280 on September 3, it pulled back and has traded in a narrow range of 79,400-80,200 for several consecutive days. September has historically averaged a 2.9% decline, while the probability of an FOMC rate hike has surged to 58%, making bulls nervous.
The price is 15% above the 50-day and 200-day moving averages, keeping the medium-term outlook bullish, but short-term momentum is fading and MACD has
post-image
BTC+0.28%
ETH+1.75%
SOL+3.89%
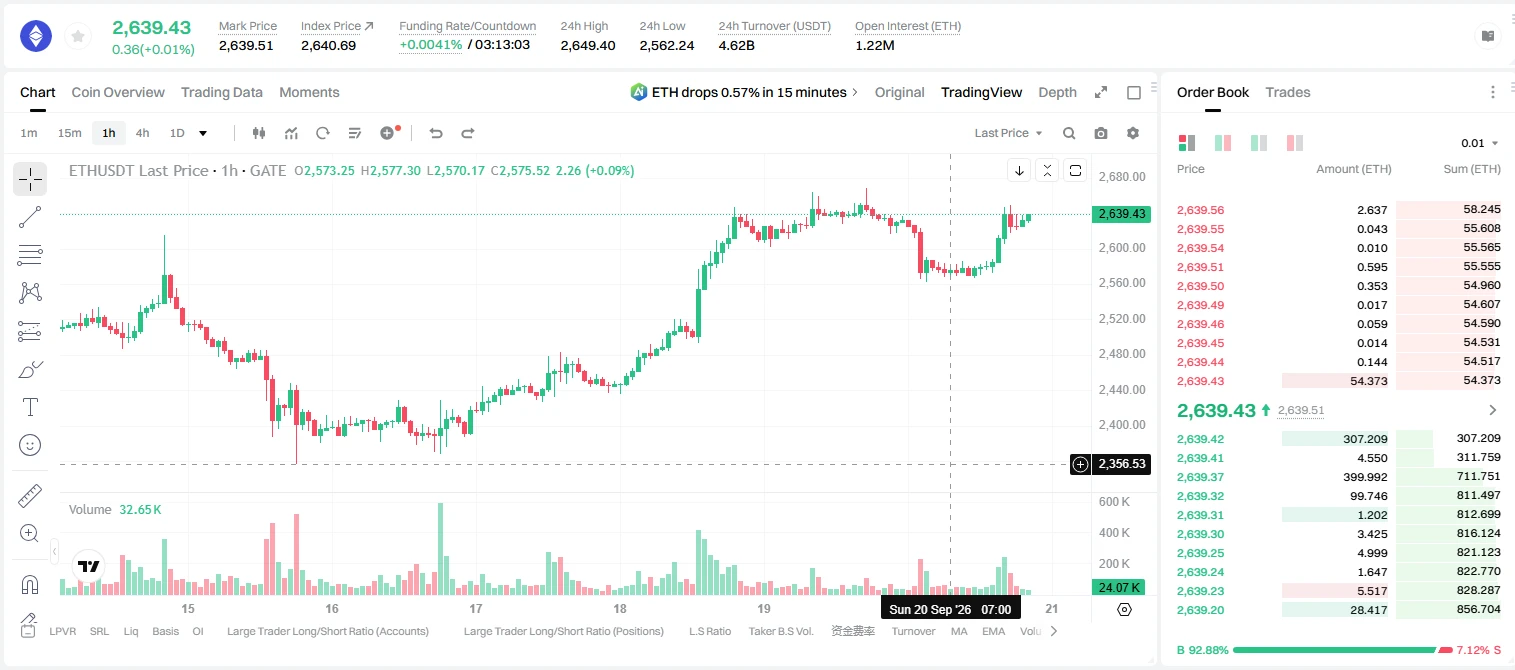
ethereum:0xb50721bcf8d664c30412cfbc6cf7a15145234ad1 thesis played out. Looking to play the downside next week upon a loss of Yearly Open, or to take the 2026 high.
Easy triggers.
post-image
ETH+1.75%
$GT I remain bullish on this market cycle, and I don't think we're at the end of the bull market. Instead, it looks more like the main upward phase is spreading from BTC to altcoins.
Why do I see it this way?
Because what's happening in the market is no longer just one or two coins performing independently.
ZEC keeps hitting new highs, DASH and XMR are beginning to accelerate, and platform tokens like GT are taking turns rising. This shows that capital has started flowing out of BTC, ETH, and the earlier Meme rally to seek the next batch of assets with favorable risk-reward profiles.
That is t
GT+1.88%
MARKET ALERT - SUSHI
#Gate60MillionUsers
​Timeframe 15m: The short-term trend is beginning to rebound after correcting from the 0.2829 peak. The current price (0.2499) is moving above the 20 EMA (0.2440) and 50 EMA (0.2430), indicating local bullish momentum. However, there is nearby resistance around 0.2648.
​Timeframe 1h: The main trend remains in an expansive bullish condition following the breakout from the 0.1857 area. The price successfully bounced just above the 20 EMA (0.2410) and 50 EMA (0.2260), showing that the uptrend structure remains very strong.
​Trading Opportunities
​Long (Bu
Cryptocurrency_ALERT
GIVEAWAY FOR MY SUBSCRIBERS🥳
PART 1
SUSHI+21.87%
  • 5
$ETH ‌ ‌
1. PROJECT DETAILS
Ethereum is the dominant Layer1 for smart contracts and the settlement layer for Layer2s.
• Utility: Gas for DeFi, L2 settlement, staking, restaking, stablecoin settlement. Ranked NO.2 Spot and NO.2 Market Cap on Gate.
• Supply Model: Post-Merge PoS with EIP-1559 burn, net deflationary during high activity. Avg Price 4,289.10 is 41.6% above current price, showing long-term average holders are underwater and overhead supply exists above 2,594.96
. • Performance: 30d +30.77% and 90d +48.20% indicate strong recovery, while 1y -41.48% confirms macro correction still i
post-image
ETH+1.75%
  • 1
$SOL V Signal】Long + 4H momentum expansion
$SOLV After a high-volume 1H breakout, price consolidated at high levels. The 4H MACD histogram continues to expand, while RSI 77.53 remains in the strong zone. Ask-side depth dominates the order book, and price has held firm without breaking down. The latest 4H volume is 1.63 billion, significantly higher than before, with active buying support.
🎯Direction: Long
⚡Entry/limit order: 0.00370385 - 0.00371500
🛑Stop-loss: 0.00367785
🚀Target 1: 0.00377072
🚀Target 2: 0.00379859
🛡️Trade management:
- Execution strategy: Reduce the position by 50% after
post-image
SOLV+15.57%
BTC+0.28%
ETH+1.75%
SOL+3.89%
Everyone’s cheering the 1D uptrend, but the 4h tape just whispered a secret about NEAR that no one’s ready for.

$NEAR /USDT - SHORT

Trade Plan:
Entry: 2.4397 – 2.4659
SL: 2.6162
TP1: 2.3302
TP2: 2.2485
TP3: 2.1260

Why this setup?
- 84% confidence on the SHORT while the daily trend says “bull” is the exact divergence that pays.
- RSI on the 15m is at 57—not overheated, meaning sellers still have room to push before any bounce.
- Entry zone 2.4397–2.4659 sits right under the 1h ATR (0.052) volatility band—price is coiling for a 4h break.
- Targets are deep: TP1 at 2.3302 (-5%), TP2 a
NEAR+11.89%
$BTC staying above 70k is the best case for altcoins
BTC+0.28%
#Gate60MillionUsers
60 MILLION USERS.
ONE MASSIVE MILESTONE.
AND ONE JOURNEY I CAN CALL MY OWN.
When Gate crossed 60 million global users, I didn’t just see a huge number on a screen. I saw millions of people standing at completely different points in their crypto journey.
Some are here for their first Bitcoin trade.
Some are building long-term portfolios.
Some are chasing the next opportunity.
Some are learning after a painful mistake.
And some are still trying to understand why one green candle can completely destroy their discipline. 😂
I’m somewhere in that crowd too.
My Gate journey has
post-image
BTC+0.27%
ETH+1.73%
GT+1.88%
  • 3
Trend analysis chart for this month! Take a close look! $BTC $ETH #美国8月非农超预期
post-image
BTC+0.28%
ETH+1.75%
🚨 CLARITY Act cloture vote is set for Sept 15, 2:15pm ET.
Thune already filed the motion to proceed. If it clears 60 votes, the Senate opens debate on the first real crypto market structure bill in US history. If it doesn't, the whole thing stalls again heading into year-end.
This is the SEC/CFTC jurisdiction fight finally hitting the floor.
But millions are bet against it actually happening.
Where is your money?
post-image
BTC’s broader trend is bullish
It will rise; it is currently in the lowest green zone, which is very likely the end of the pullback
A breakout above the upper green zone would confirm the bullish trend. Wait for the signal and let the flowers bloom
$BTC
post-image
BTC+0.27%
Everyone is long $LINK /USDT, but the 4h tape just whispered a secret the daily chart hasn’t caught yet.

$LINK /USDT - SHORT

Trade Plan:
Entry: 12.294 – 12.352
SL: 12.690
TP1: 12.048
TP2: 11.865
TP3: 11.589

Why this setup?
Why now?
- Daily trend is bullish, but the 4h structure is cracking—price stalled at 12.323 while RSI 15m (56.5) loses upward steam.
- Short bias at 84% confidence, targeting a 3.8% drop to 11.865 (TP2) before the daily bulls reclaim.
- ATR 1h (0.1175) shows volatility is compressing—breakouts here are violent.
- Entry zone 12.294–12.352 is the last stand befor
LINK+3.88%
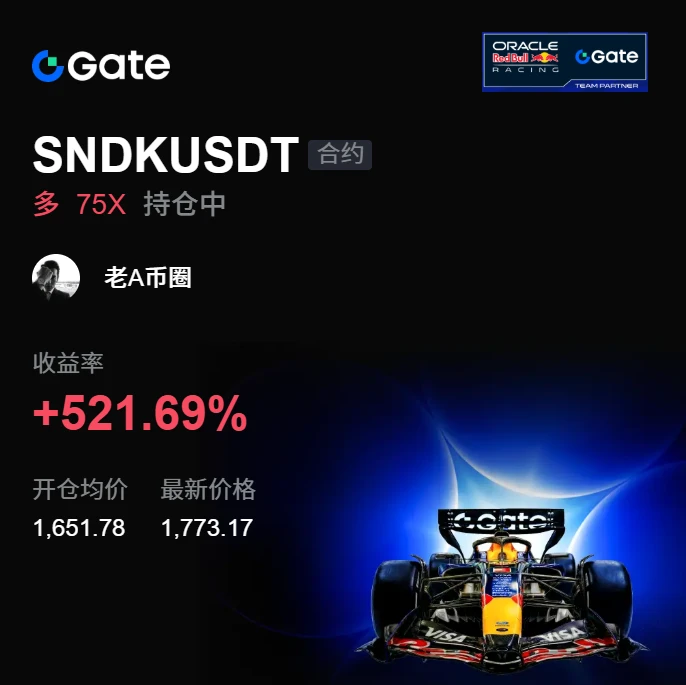
A hand that set the stop-loss a few days ago trembled slightly; this morning I realized that was unnecessary filial piety. Before bed, $APT made a low-volume rebound to a key level, with volume not following at all. I placed a short order at 0.9133, set the stop-loss, and went to sleep.

When I opened the chart in the morning, the price had already slid to 0.6149, locking in +2319.08%. The timing was just right—this run was worth staying up for. Don’t lose patience in the range, only to try to win back your dignity during a one-way move.

I’m not being greedy either: take 80% off the table
post-image
APT+3.78%
SNDK+1.47%
ZEC+16.77%
BTC returns to $78,000! The market rebounds after finding suppor
live-cover
LIVE1,796
Which #crypto project will do this?
post-image
The direction was right; the only question left is whether you can hold on. I caught this wave of $WLD 's surge, which took roughly two or three false breakouts from structural confirmation to a genuine breakout on volume before it truly established itself. Floating profits retraced for a while after entry, but once that bullish candle appeared, I knew the bulls had the upper hand.
Technically, I prioritize the price-volume relationship. The breakout candle had sufficient volume, and the pullback did not erase the gains, which is a relatively healthy sign. The price repeatedly tested the 0.4169
post-image
WLD+4.73%
ZEC+16.77%
ADA+1.67%
Everyone’s staring at the range—but the 4h tape just whispered a secret about XRP.

$XRP /USDT - SHORT

Trade Plan:
Entry: 1.4184 – 1.4226
SL: 1.4411
TP1: 1.4050
TP2: 1.3947
TP3: 1.3792

Why this setup?
Why now? The daily is dead range, yet the 4h structure is begging for a fade.
- RSI 15m (53) is neutral—no panic, no euphoria, just a coiled spring.
- ATR 1h (0.0086) is thin; tight squeeze means the next 100 pips hit fast.
- My model says SHORT at 1.4205 with 55% conviction—not heroic, but the edge is in the invalidation at 1.4083. Break that, and the short thesis dies.
- TP1 at 1.4
XRP+0.33%
JUST IN: A dormant cluster from the Satoshi era moved 600 BTC (~$48M), all from 2010 mining rewards; no link to Satoshi confirmed. Implication: long-dormant whale activity returning to life can add near-term supply dynamics and market curiosity. $BTC
post-image
BTC+0.28%
Load More

Join 40 M users in our growing community

⚡️ Join 40 M users in the crypto craze discussion

💬 Engage with your favorite top creators

👍 See what interests you

View More