Share your thoughts
placeholder
Article
Woke up to a group member hitting A7 on a single coin in just a few hours. Honestly, do you all make money only when I’m not around? 😳
post-image
Is this really a rebound? Isn’t it just CPR for my empty account? When the early-session sell-off began, I kept an eye on that weak rebound. Volume failed to follow, and no one was buying even as it moved up—a classic low-volume bull trap.
I hadn’t planned to make a move, but the market gave me a signal: $STRK touched around 0.03656, yet each of its several pushes higher fell just short. I opened a short position—the logic was simple: resistance above was obvious, and without volume, there was no follow-through. This kind of rebound wouldn’t go far.
I just checked: the current price is 0.03126
post-image
STRK-1.53%
ETH+0.67%
XRP+0.14%
[ New Streamer ] Today Market Talk
live-cover
LIVE1,728
The final nail in the coffin for the bears is coming.
The weekly Supertrend just flipped bullish.
This is something that only ever happens within HTF trend changes.
It's never printed a false signal.
Every time it has flipped bullish after a bear cycle, the bottom has been in and Bitcoin has gone to enter, at minimum, months of upwards price action.
This doesn't mean we won't get a retrace at this point, i do believe we will chop around the 50SMA, which is yet to be taken.
But this is a massive signal to market participants that the Bitcoin trend has changed.
post-image
BTC+0.37%
This move doesn’t even require me to think—the account is dancing on its own 🕺 While everyone else was rushing in, I kept my eyes on $BEAT that key rebound level, and the more I watched, the more something felt off. It felt like there was a mountain overhead. The rebound was weak, sell orders kept coming in wave after wave, volume didn’t expand at all, and every push upward fell just short. I tried shorting at 0.1345 and caught the rhythm—decisive execution. Now at 0.1238, with +159.56% in the bag, it feels amazing. This stretch wasn’t endured for nothing: the earlier action was truly sluggis
post-image
BEAT-0.24%
ZEC+11.80%
SNDK+0.38%
Short-term trend: The 4-hour chart shows a strong bullish pattern. After plunging sharply on September 6, the price quickly recovered, and consecutive bullish candles indicate buyer dominance. However, the latest candlestick (07th, 08:00) closed as a small bullish candle with an upper shadow, while trading volume contracted significantly, suggesting short-term selling pressure in the 2520–2525 range and weakening upward momentum.
Technical indicators: The MACD lines are diverging above the zero axis, and the histogram continues to expand, indicating that bullish momentum is still strengthening
ETH+0.67%
AAOI+2.70%
#XAU Gold Is at a Decision Point
Gold is trading around $4,429/oz, after Friday’s sharp rejection from the $4,490 area. The latest move was not random: stronger U.S. employment data lifted Treasury yields and revived expectations that the Fed could keep policy tighter for longer. That pressured a non-yielding asset like gold.
But I’m not calling this a trend reversal yet.
The bigger picture is still highly sensitive to the dollar, Treasury yields, inflation data and geopolitical risk. Gold had already climbed strongly through August, so some profit-taking after the recent rally is also normal
XAU-0.40%
  • 11
  • 4
BNB was called right by the thug again, who took profit last night!
BNB started surging last Saturday, and a friend messaged me saying they had been stopped out for a loss of 700 bucks. I said I would look into it. So when I had some time, I started a livestream and explained the general range and profitable take-profit level together with everyone in the livestream: See Figure 1!
By yesterday, the thug saw it coming down while drinking and decisively exited when it reached the 751 support level. The thug did not add to the position in time along the way, so the position was not ideal. See Fig
BNB-1.56%
9/7/ETH/Prince Strategy/
Current price is around 2503. After rallying to 2525.77 and encountering resistance, the price pulled back and broke below the Bollinger middle band, with the short-term trend shifting from strong to weak and entering a pullback consolidation phase.
- Overhead resistance: 2510‑2515 (Bollinger middle band). Only after firmly reclaiming this level can the bulls have a chance to attack and retest the previous high at 2525.
​- Downside support: 2495, near the lower Bollinger band, serving as the short-term line separating strength from weakness today; once broken, the pri
post-image
ETH+0.67%
Layout for Bitcoin, Ethereum, and Dogecoin
live-cover
LIVE3,873
  • 1
I originally wanted to cut my losses and offer the position to the heavens, but the sacrifice never happened—the meat roasted itself.
Around dawn, the market was still probing lower, with the price pressured to around 0.08349. I noticed that the key level had not been effectively breached; every time it was touched, buy orders immediately pushed it back up. The key level held, which meant this sell-off was a fakeout and the bottom structure was nearly in place. I went straight in along the long direction, leaving myself no room to hesitate.
The price then moved more smoothly with each step. Wh
post-image
XRP+0.14%
BNB-1.56%
Everyone’s staring at NEAR’s pullback, but the 4H just flashed a signal most traders will ignore until it’s too late.

$NEAR /USDT - LONG

Trade Plan:
Entry: 2.3957 – 2.4259
SL: 2.2657
TP1: 2.5196
TP2: 2.5922
TP3: 2.7011

Why this setup?
- 1D trend remains bullish, and we’re sitting at the 2.4108 reference—right in the demand zone (2.3957–2.4259).
- RSI 15m at 45.6 shows cooling momentum, not weakness—this is the reload before the next leg up.
- ATR 1h at 0.0604 means volatility is compressing; breakouts from here tend to snap hard.
- With 95% confidence and TP1 at 2.5196, the risk-to
NEAR+8.38%
On September 7, 2026, the Bitcoin futures market was range-bound at high levels with no clear direction. Although the broader trend remains bullish, short-term upside momentum is weak, and with a macro event window approaching, market participants are largely staying on the sidelines.
Core view: Treat the market as range-bound; do not chase rallies or sell into declines, and patiently wait for directional confirmation.
1. Market analysis: Bull-bear divergence intensifies
· Bullish on the larger timeframe but under short-term pressure: The daily bullish structure remains intact, but Bitcoin was
post-image
BTC+0.35%
JUST IN: Moore Threads (A-shares) drops 20% to new post-listing low as market cap falls below 200B yuan. No crypto tie-in here; factor into risk sentiment for tech equities and broader liquidity cues. $MOORE
post-image
terra-luna:native JUST TORCHED 607 MILLION TOKENS. 🔥
IN ONLY 4 DAYS OF SEPTEMBER.
DAY 1 ALONE:
407M terra-luna:native BURNED. 💀
THE 1.5% BURN TAX IS COOKING. 🔥
SUPPLY IS SHRINKING.
BURN PRESSURE IS BUILDING.
terra-luna:native #LUNC #LunaClassic #Crypto #Burn
post-image
LUNC-1.26%
Third early-session trade, win streak
Long at 4395, exited at 4410, 15 points, pocketed $2227!#黄金 #伦敦金 $XAUUSD
post-image
XAUUSD-0.29%
Market sentiment is extremely skewed bullish, with the vast majority of participants expecting prices to remain elevated; the 78000 level retains a small amount of disagreement and is the only level with an odds premium, indicating that a small number of traders still fear prices may fail to reach it.
post-image
Injecting capital into insurance companies and banks? What do you mean?
post-image
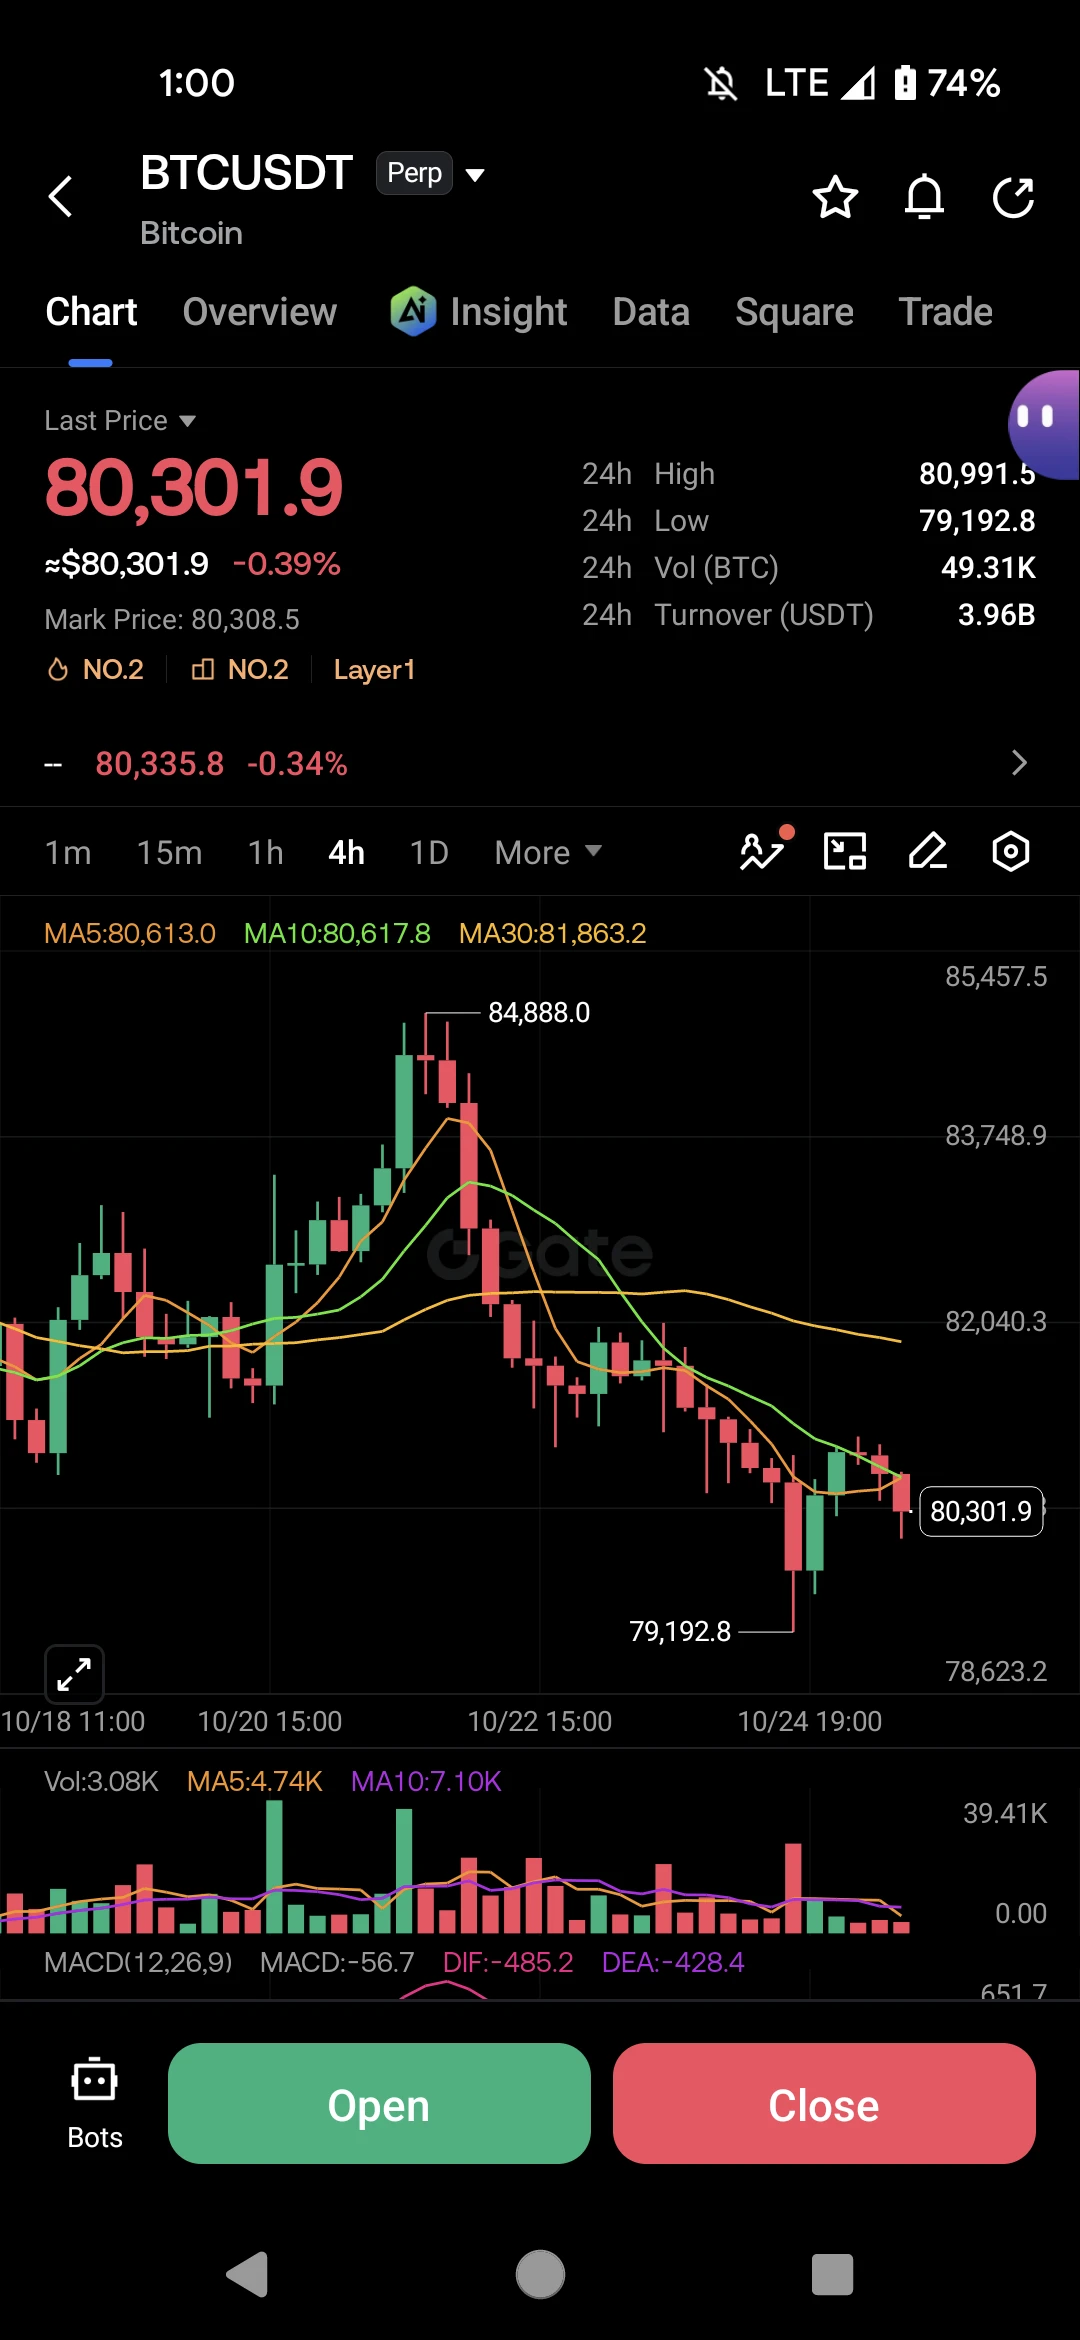
BTC setup for 9/7
  Entry zone: Go long around 79,300 on a pullback
  Stop-loss defense: Exit immediately if 78,600, the lower boundary of the consolidation, is broken
  First target: 80,500 short-term resistance
  Second target: 81,300, a strong resistance level at the intermediate platform during the sharp decline; reduce the position by 60%, and decide whether to keep the remaining position based on the breakout
  Third target: Exit the entire position near the previous high at 82,200
  The current market is in a recovery phase following the sharp decline. A bottoming and rebound signal has
post-image
BTC+0.35%
Everyone’s staring at the 0.81 breakout—but the 4H chart just whispered a name you didn’t expect: SUI.

$SUI /USDT - SHORT

Trade Plan:
Entry: 0.8093 – 0.8149
SL: 0.8392
TP1: 0.7918
TP2: 0.7783
TP3: 0.7580

Why this setup?
Why now? The range-bound 1D trend is the tell—no momentum to save bulls. RSI (15m: 45.1) is sliding below mid, and ATR (1h: 0.01128) is compressing, which usually precedes a violent snap. Entry ref at 0.8121 with a tight TP1 at 0.7918 (-2.5%) and TP2 at 0.7783 (-4.2%) isn’t greed—it’s math. The invalidation at 0.7779 sits below TP3 (0.7580), meaning the short has room to
SUI+1.75%
Load More

Join 40 M users in our growing community

⚡️ Join 40 M users in the crypto craze discussion

💬 Engage with your favorite top creators

👍 See what interests you