
Share your thoughts
placeholder
Article
This kind of return makes me nervous, fearing the market will come to its senses tomorrow and blacklist me lol 🔥 This move was purely the market doing well on its own. A few days ago, I was still reviewing the market before bed, $SOL and the rebound that afternoon a few days ago really had something to it: every time the price surged, someone was there to buy, and the trading volume was also more genuine than before. Anyway, I gave all the warnings I needed to give and simply held the 84.84 level without moving.
When I woke up and checked my phone, wow—105.91 had practically delivered the or
post-image
SOL+2.40%
BTC+0.27%
LAB-3.96%
Keep holding, and be a bit more determined. By the way, if you’ve already reduced your position, hitting the stop-loss still means a profit.
Beginner Trader - Real Account Live
live-cover
LIVE28
TrendForce: Easing Notebook CPU Supply in 2H26 to Narrow the Full-Year Decline in Global Notebook Shipments
post-image
No moves, no analysis, just pure luck—this performance is embarrassing to even talk about. When the market plunged intraday, everyone was running, but I kept my eyes on $PONS ’s chart and noticed that someone stepped in every time it dipped, with key levels never breaking. Be greedy when others are fearful—directly signaled to open a long at 0.4775. And now, 0.8614, +1584.6%. It feels great when you get the rhythm right. It was truly sluggish at first, but the result is truly satisfying. Take profit on 80% first, and set a breakeven stop to protect the remaining 20%. Staying out of the market
post-image
PONS-11.63%
BTC+0.27%
SNDK+1.12%
$PEPE Getting Ready To Send It! 🚀
Just dropped $2,783 in on a long position.
$PEPE Near To Mid-Term Targets 🎯
1) $0.000004011
2) $0.000006226
Lets go make some money! 💰
NFA, DYOR ⚠️
#Crypto #Trading #PEPE
post-image
PEPE-0.11%
Most traders missed NEAR's 84% short signal because the 1D trend screamed bullish.

$NEAR /USDT - SHORT

Trade Plan:
Entry: 2.4312 – 2.4610
SL: 2.6323
TP1: 2.3065
TP2: 2.2134
TP3: 2.0737

Why this setup?
- The 4h timeframe is flipping bearish against the daily uptrend—this is the classic “bull trap” setup.
- RSI 15m at 55 shows weak momentum, not enough fuel to break 2.4610 resistance.
- Entry zone 2.4461 with TP1 at 2.3065 gives a 5.7% move before the daily trend reasserts.
- ATR 1h (0.0597) means volatility is compressed—breakouts are violent. Why now? Price is stalling under supply
NEAR+11.44%
Everyone’s long ZEC while the 4h chart screams distribution—who’s right?

$ZEC /USDT - SHORT

Trade Plan:
Entry: 1215.39 – 1231.17
SL: 1321.75
TP1: 1149.43
TP2: 1100.20
TP3: 1026.35

Why this setup?
- 1D trend is bullish, but the 4h setup says otherwise: SHORT bias at 84 confidence.
- Price is pinned at 1223.28 with RSI(15m) at 52—no momentum, just chop before the drop.
- ATR(1h) of 31.5 means we’re primed for a 2.5%+ move; targets sit at 1149 (TP1) and 1100 (TP2).
- Why now? The “waiting” status means the trap is set—either we sweep 1231 or dump.

Debate:
Are you fading this bullish
ZEC+19.99%
Everyone’s watching ARB’s range—but the 4h chart just whispered a secret that most retail is ignoring.

$ARB /USDT - SHORT

Trade Plan:
Entry: 0.18559 – 0.18925
SL: 0.20496
TP1: 0.17426
TP2: 0.16549
TP3: 0.15233

Why this setup?
Why now? The 1D trend is flat, yet the 4h structure is screaming SHORT with 55% confidence. RSI on 15m is at 59.58—not overheated, but stalling right under entry resistance (0.18742). ATR (0.00731) shows tight coils; break below 0.18559 opens the trapdoor to TP1 at 0.17426. This isn’t a reversal—it’s a range rejection play.

Debate:
If ARB taps 0.18925 first, do yo
ARB+4.20%
This $PONS long position has been quite a grind. There was one downward spike in the middle that swept out quite a few short chasers, coming just a few points away from my protective level. I did not manually cut the position at the time because the four-hour structure had not broken down.
I entered based on a double bottom on the hourly chart. After the right-side breakout, the price pulled back to the prior high neckline and stabilized. Once confirmed, I went long with the trend. The entry was not particularly cheap, but the stop-loss was very close, making it a case of using limited risk to
post-image
PONS-11.63%
BTC+0.27%
SOL+2.40%
With this kind of move, I don't even need to think—the account is partying on its own 💃

A few days ago, the last thing I saw before bed was $ZEC still building a base up front without ever breaking down. The candlesticks looked dull, but funds had actually been testing the market in the shadows, and the buying pressure was already impossible to hide. Before bed, I left just one sentence: If there is no volume at the bottom, just wait.

Then I opened my eyes and the market took off 🚀, surging from 833.19 to 1217.25, with the position's return shooting straight above +3277.45%. It was trul
post-image
ZEC+19.99%
SNDK+1.12%
ADA+0.77%
I was just about to go to the forum and rant, but then I saw my balance and decided against it—the market is always right.

During the intraday plunge, $ZKC fell from 0.04950 all the way down. Watching the entire screen turn green actually calmed me down. Before that, it had rebounded several times, but every time it approached 0.04950, it was pushed back down. Selling pressure remained heavy, making it clear that no one above was willing to take the other side. So I didn’t chase longs; instead, I waited for the rebound to lose momentum and tried a short. The price has now dropped to 0.04876
post-image
ZKC-1.59%
BNB-2.59%
BTC+0.27%
Everyone’s watching ENA for a breakout—but the 4h chart is screaming the opposite.

$ENA /USDT - SHORT

Trade Plan:
Entry: 0.17564 – 0.17726
SL: 0.18423
TP1: 0.17062
TP2: 0.16673
TP3: 0.16089

Why this setup?
- 1D trend is *range*, not momentum—meaning the 0.17645 level is a magnet, not a launchpad.
- RSI (15m) at 62 is fading—buyers exhausted before they even reach the 1h resistance.
- ATR (1h) at 0.00324 is tight—when volatility squeezes, shorts win the first pop down to TP1 (0.17062) and TP2 (0.16673).
- Why now? The “waiting” status means the trap is set: 0.17645 is the bait, 0.18
ENA+3.48%
It is said that the way Chinese people have fun has changed dramatically. What do you like doing most these days?
post-image
$1000 to $100,000 Crypto Trade Challenge Today
live-cover
LIVE1,617
#Gate用户突破6000万,来 用户突破6000万,来 Gate Reaches 60 Million Users Worldwide!
60 million users is not just a number — it represents millions of trading journeys, unforgettable moments, lessons, profits, losses, and memories created along the way.
Do you remember when you first joined Gate?
Do you still remember your first trade?
Maybe it was a perfect entry… or maybe the market taught you an unforgettable lesson!
For me, every trade tells a story. Some bring excitement, some bring valuable lessons, and some become memories that we can laugh about years later.
Now Gate is inviting its community to
post-image
GT-1.29%
The market humbles everyone eventually, but this time it has been pretty gentle with me.
When it plunged intraday, 1.117 looked like it was about to collapse, but it ultimately couldn’t push any lower. Volume dried up completely—those who were going to run had already done so, leaving only the ones who didn’t want to move.
When I checked the chart after lunch, the price had already started quietly climbing back. I had just one thought at the time: at this level, set a stop-loss and take a shot at a rebound.
Now at 4.532, with a +14729.64% return, the guys on board should be waking up laughing,
post-image
SNDK+1.12%
XRP+0.32%
9.7 Gold Morning Review
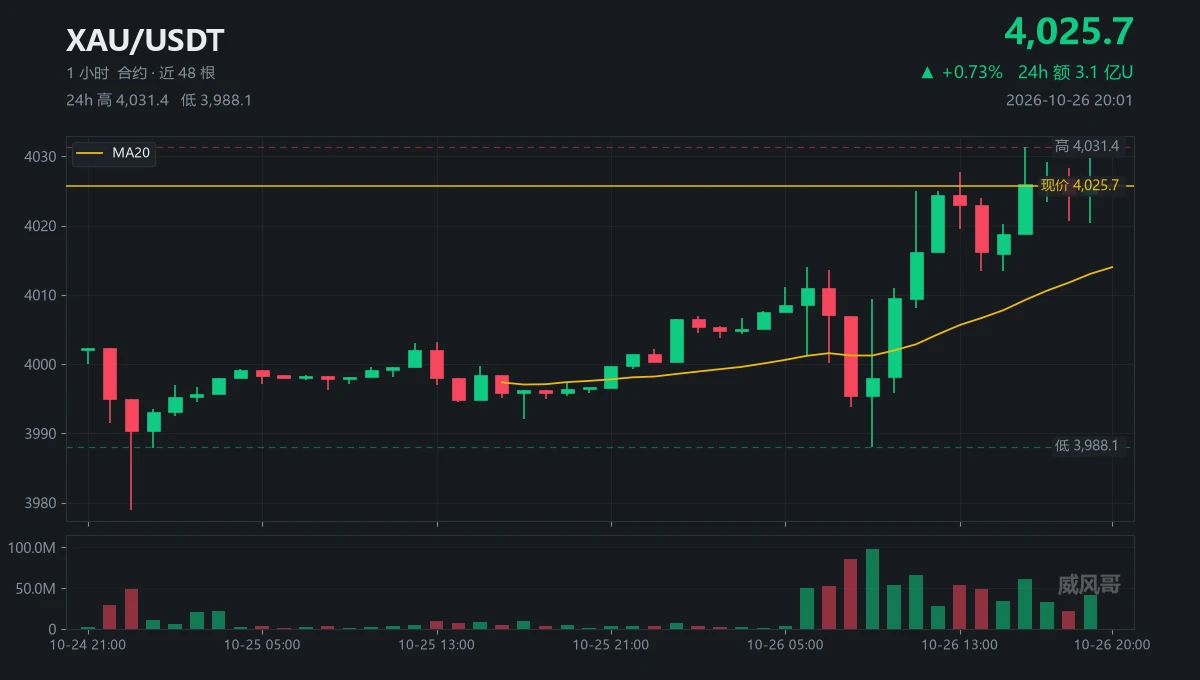
The strategy of selling into rebounds during the overnight session has once again been validated. Gold prices came under pressure and pulled back after rebounding, with the previously identified resistance zone effectively capping the price. Market movements closely matched the anticipated levels. The current price is around 4430, while the Asian session remains range-bound at low levels.
Technical analysis: The 1-hour Bollinger Bands are opening downward, with gold trading between the middle and lower bands. The 30-minute Bollinger Bands are contracting downward; KDJ a
post-image
XAU-0.10%
Everyone’s staring at DASH at 71.41—but the range just whispered a secret the bulls missed.

$DASH /USDT - SHORT

Trade Plan:
Entry: 70.72 – 72.10
SL: 77.99
TP1: 66.48
TP2: 63.19
TP3: 58.26

Why this setup?
Why now? The 1D trend is *range*, not breakout—so we’re playing mean reversion, not momentum.
- 4h bias: SHORT (Conf 55.4) with entry zone 70.72–72.10.
- RSI 15m at 57.38 shows a weak bounce—no fuel for a push above 72.10.
- ATR 1h (2.74) says volatility is contracting—tight stops, fast move.
- Targets: TP1 66.48, TP2 63.19. Invalidation only if price closes above 55.29 (wait—tha
DASH+5.43%
This return has me feeling nervous, worried the market might come to its senses tomorrow and blacklist me.
With the screen glowing green, $SNXX consolidated around 13.489. No matter how I looked at it, it seemed ready to break down. But I noticed that every dip was met with buyers, while volume was quietly cooperating; it was moving sideways at the bottom without breaking down—this structure wasn’t bearish, so I should be watching for longs instead. Once the market stabilized a little, I opened a long.
I didn’t expect it to surge straight to the current 18.223, with unrealized gains of +1693.
post-image
SNXX+2.53%
ETH+1.06%
LAB-3.96%
Load More

Join 40 M users in our growing community

⚡️ Join 40 M users in the crypto craze discussion

💬 Engage with your favorite top creators

👍 See what interests you

View More