Square
Following
Hot
News
Notifications
Profile
Share your thoughts
placeholder
Article
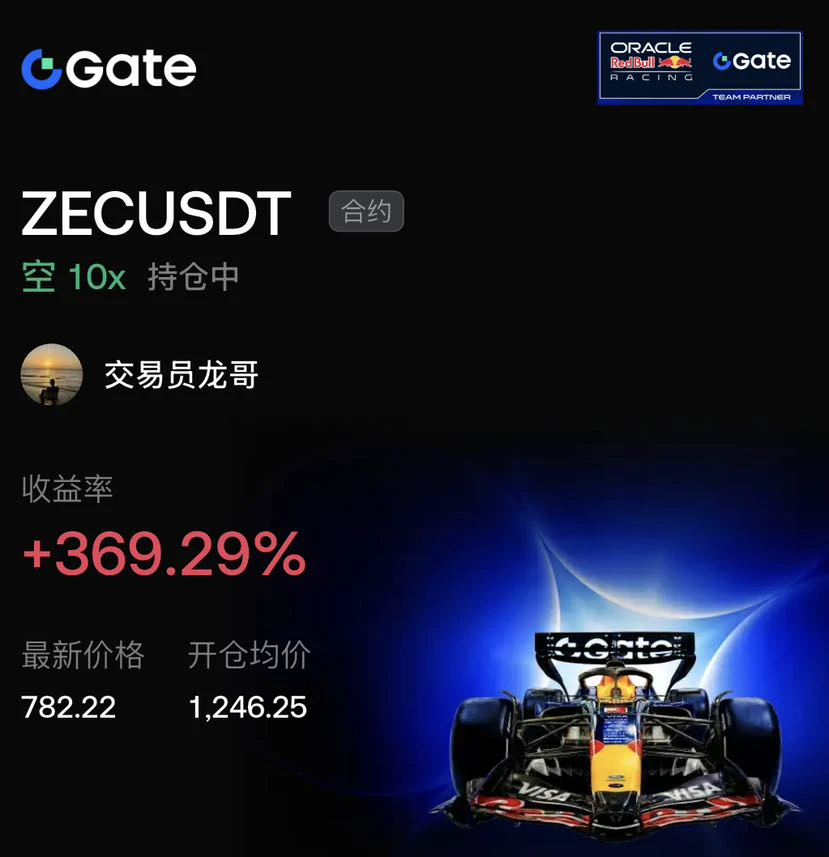
The $ZEC short position is up 369%, entered at 1246.25, with the current price at 782.22. This is how brutal it is to ride the main downtrend with 10x leverage. A large bearish candle drives prices down from the highs, with all moving averages fanning out bearishly.

But 10x leverage offers no safety cushion. Consolidation near the lows hides danger.

Keep the stop loss at breakeven. If it breaks the previous low, keep the position open to ride the acceleration; if the rebound lacks strength, take profit immediately. This trade is about the discipline to hold a position, not foresight. Protec
post-image
ZEC+1.29%
BTC-0.65%
SOL-0.74%
This is how Mr. Jin treats the online friends and actual friends who trust him: betraying their trust, never admitting fault, never apologizing,
Ask him any question, and his mouth immediately becomes as slippery as a snake's.
What kind of nerve does this person have to claim he was “unlucky in who he met”? I really don't understand what kind of game this is—not about skill or ability, but about proving he's actually a “white lotus”?
We're nothing more than online friends who happened to cross paths on Twitter; we've never even met in person.
It's just that I saw through his habit of mixing tr
post-image
Trenches
IDOL
I
bade
b
IDOL
0x3b...ab07
Market Cap
$.
Change
.
24h Vol
$.
Holders
.
JAGENT
J
bade
b
JAGENT
0x8e...ae15
Market Cap
$.
Change
.
24h Vol
$.
Holders
.
PIEVERSE
P
bade
b
PIEVERSE
0x0e...25a9
Market Cap
$.
Change
.
24h Vol
$.
Holders
.
FIONA
F
bade
b
FIONA
B34n...pump
Market Cap
$.
Change
.
24h Vol
$.
Holders
.
Singularity
S
bade
b
Singularity
7R4M...pump
Market Cap
$.
Change
.
24h Vol
$.
Holders
.
$CRCLB Diverges Across Short- and Longer-Term Timeframes: Short-Term Strength, Mid-Term Weakness

$CRCLB is currently at 49.39, up 0.714% over the past 24 hours. Its intraday high is 49.88, and its low is 45.23. On the 1-hour timeframe, $CRCLB is showing strength, with the price breaking above EMA20 at 48.9513. RSI14 is 71.82, approaching overbought territory, indicating active short-term buying. The 1-hour support is at 45.23 and resistance is at 49.88. The price is above support, suggesting that short-term bulls are in control. However, the volume ratio is only 0.16, meaning hourly volume is
post-image
Streamer return Bitcoin News | Bitcoin falls below $57k
live-cover
LIVE1,073
BTC-0.67%
ETH-1.26%
XRP-1.15%
🚨 Crypto Fear and Greed Index Drops to 11 as Market Sentiment Reaches Extreme Fear!

The cryptocurrency market is experiencing extreme fear as the Crypto Fear and Greed Index has dropped to 11. This very low reading shows that many investors are feeling nervous about the current market situation.

Bitcoin's sharp decline and heavy liquidations have increased uncertainty across the market. Many traders are worried about further price drops, while some investors are waiting for better market conditions.

Fear can have a strong effect on trading decisions. When investors become nervous, they may
post-image
BTC-0.65%
After this week’s sharp drop, I noticed a pattern:
What really makes you lose big,
isn’t “not understanding the market,” but “understanding it and refusing to admit it.”
The market is clearly falling, but you insist “it’s just a shakeout”;
you clearly should cut your losses, but insist “wait for a bounce.”
The market isn’t wrong; you’re fighting yourself, and you never win against yourself.
post-image
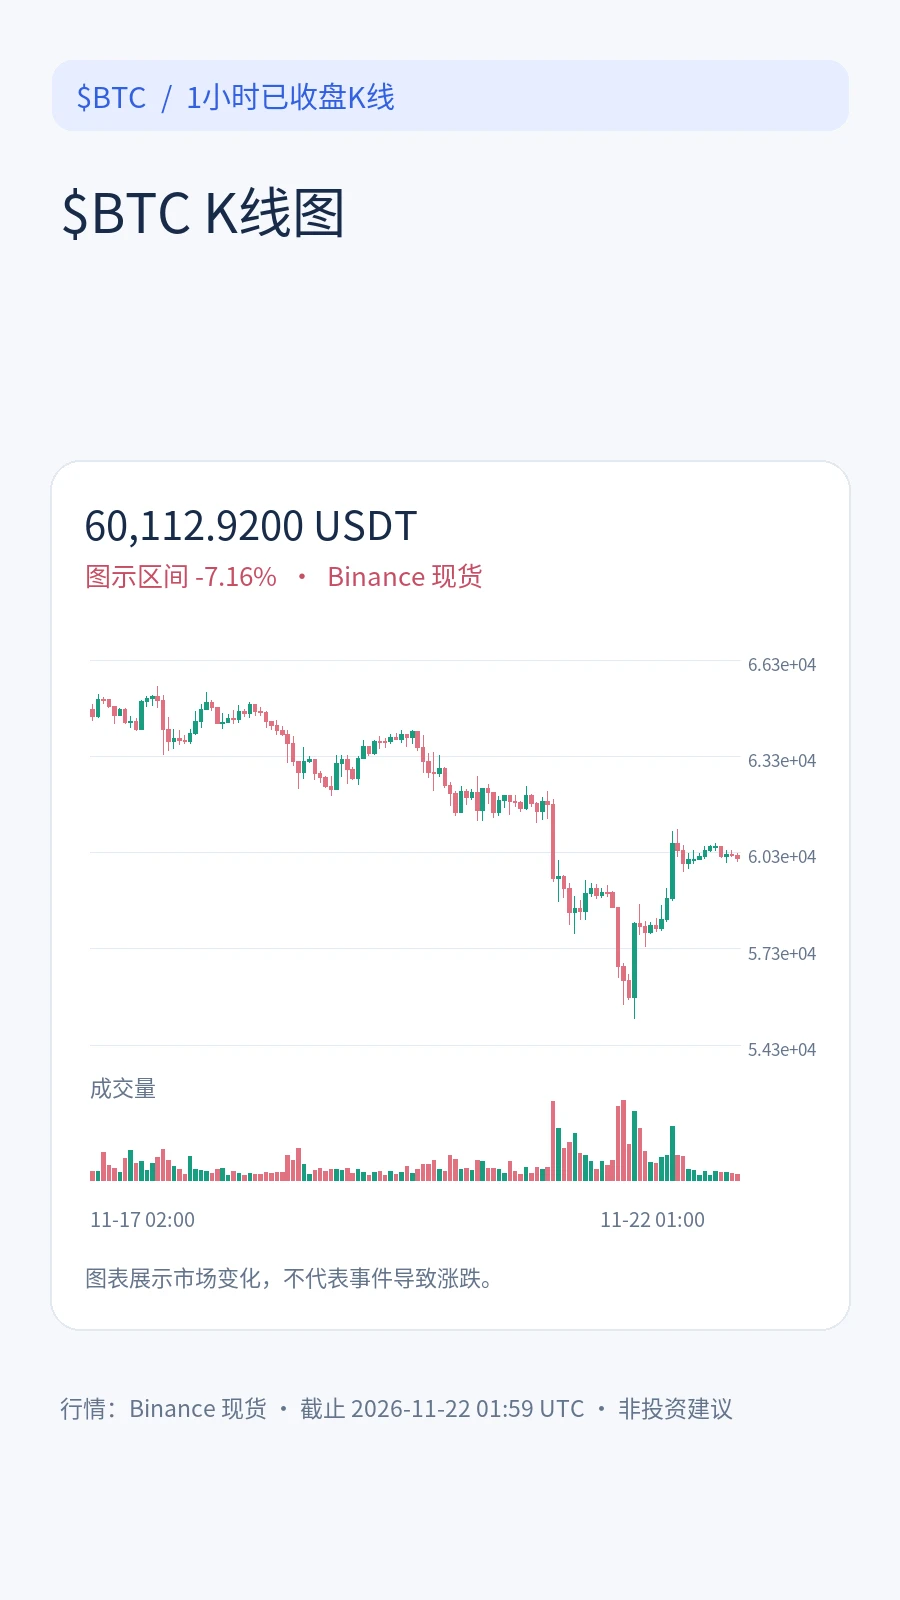
BTC has reclaimed 60,000. Yesterday, the price briefly wicked down to around 55,100 before launching a strong rebound.

It is worth noting that the first rebound lacked sufficient volume, but as the move progressed, clear volume increases gradually appeared on the 1H and 4H timeframes. This makes me think this rebound is not entirely unsupported, and there is still room to move higher in the short term.

I currently lean toward the view that from the end of this month to early next year, BTC may enter a broad daily-chart consolidation phase, possibly with an increasingly widening range. The sw
post-image
ETH-1.26%
BTC-0.67%
DODOX is coiling in a tight range; looking for a breakout to the upside as it holds local support.Buying
$DODOX .Trade levels:Entry 0.038236 - 0.039096TP1 0.040836TP2 0.042572SL 0.036707Be careful: Failure to hold the 0.0389 support level could trigger a deeper retest of the 0.0380 zone.Never all-in, fam. Use a size that fits your own account.
post-image
DODOX
DODOXDODOX
Pump.Fun
MC:$2.22KHolders:87
32.76%
$ZEC 781.86, 24H +3.56%. The 1h chart is showing strength and has reclaimed EMA20, but the 4h remains weak. RSI at 31 is bouncing from oversold territory. Volume is only 0.45x, with resistance at 807.95 just overhead. It needs to hold above that level before we can look higher; a break below 679.48 would throw off the short-term trend. Watch the chart before deciding. Not investment advice
#ZEC #Zcash
post-image
ZEC+1.16%
The deep divisions in the market over the AI sector’s staying power are driving a sharp valuation reset. Investment firm Serenity published an analysis of the technology sector’s current state. Oracle has confirmed it has secured the funding needed to fulfill its contract with OpenAI. Giants including Micron and SanDisk have also locked in supply agreements with price floors. Despite industry orders being finalized in writing, the secondary market remains rife with pessimistic doubts. The firm’s analysis says that if earnings deliver, the mismatch in expectations could instead create a golden
post-image
ORCL-8.45%
SNDK-15.99%
🌞 Good morning, another beautiful day!
Rainbow goes into the basket 🌈
post-image
#BTC | Bitcoin Is Fighting to Save Its Daily Structure. The Next Move Could Define the Market.
Bitcoin's drop to $55,123 was more than another correction. It exposed how quickly market confidence can disappear when institutional demand weakens, leverage gets unwound and macroeconomic pressure hits risk assets simultaneously. The rebound towards $60,000 has brought buyers back into the picture, but the bigger question is whether they have enough strength to reverse the damage.

I am looking at Bitcoin from the daily timeframe, and right now the chart is showing a market attempting to stabilize
BTC-0.65%
  • 3
Barring any surprises, remember that today, 11/21, will likely officially rank among the top 10 liquidation events in history.

With a slight move tonight, liquidations will surpass the $2.768 billion recorded on 2021.4.16.

Over the past 24 hours, liquidations have already reached $2.675 billion, affecting 350636 people.
#英伟达单日重挫近14%
NVDA-13.84%
  • 2
Stop... stop... stop 🚨$BTC Crypto left both longs and shorts nursing huge losses! First, as $BTC fell below $56k, $2.1 billion worth of long positions were liquidated. Then the market reversed sharply, and Bitcoin reclaimed $60k. Within just 4 hours, another $225 million worth of short positions were liquidated. The same market. Both directions. Huge losses. That’s why leverage is dangerous. Liquidity doesn’t care whether you’re bullish or bearish.🎯
$ETH CanBTCReboundAfterFallingBelow60K?
post-image
BTC-0.67%
BTC market updates
live-cover
LIVE1,125
BTC-0.67%
ETH-1.26%
Bitcoin ETFs just broke their WORST monthly outflow record.
$3.79 BILLION gone in November. BlackRock's IBIT alone lost $541 million in a single day.
That's nearly as much money leaving in three weeks as institutions poured into ETFs throughout Q3.
Guys, Wall Street is dumping Bitcoin exposure at record speed.
The question is who's buying what they're selling.
post-image
BTC-5.94%
BLK-3.02%
₿ Nov 22 | Bitcoin rebounds above $60,000—is crypto really stable now?
BTC has been quite a roller coaster these past couple of days.
It briefly fell to around $55,000, then quickly rebounded and climbed back above $60,000.
When it was falling, people worried it would keep dropping. When it rebounded, some started saying the bull market was back.
But I don't think we need to rush to any conclusions just yet.
There are three key things to watch in this rebound:
1️⃣ Can $60,000 hold?
Getting back above it is just the first step. The key is whether the price can stabilize, rather than reclaiming
post-image
BTC-0.67%
  • 3
Gold drawdown exceeds −37%
BTC drawdown exceeds −58%
Silver drawdown exceeds −67%
Nasdaq drawdown exceeds -18%
Shanghai Composite drawdown exceeds −17%
So why do you always enter during booms and exit during depressions?
10 classic books to help you understand economic cycles
The economy moves through cycles like the changing seasons: boom, recession, depression, and recovery. Credit, inventories, and technological innovation jointly drive these fluctuations, while asset price movements are an external reflection of the cycle.
What is an economic cycle? It is the wave-like fluctuation of the m
post-image
GLDX-0.40%
PAXG+0.37%
BTC-0.67%
XAG+0.47%
NAS100-0.07%
#BTCBreaksBelow60K
Bitcoin currently trades near the 60,000 dollar mark after a sharp decline that briefly pushed it to the mid-55,000 zone in recent sessions. This represents a recovery of roughly 8 to 9 percent from the recent low around 55,100 to 55,300 dollars, which marked the weakest levels seen since September 2024. Over the past 30 days the asset has declined approximately 26 to 28 percent, while the one-year performance shows a drop of around 28 to 34 percent depending on the exact reference point. From the all-time high near 126,000 dollars recorded in October 2025, Bitcoin now sits
BTC-0.67%
ANT-8.68%
NDAQ-0.95%
  • 5
  • 2
Load More

Join 40 M users in our growing community

⚡️ Join 40 M users in the crypto craze discussion

💬 Engage with your favorite top creators

👍 See what interests you

Trending Topics

BTCBreaksBelow60K

2.1M Views30.1K Discussing

BTC fell below $60,000 on November 20 for the first time since July, alongside a tech stock selloff and broader pressure on risk assets. Will $60K become resistance, or can BTC quickly reclaim it? What price or volume signals would convince you that selling pressure is easing?

GateDirectIPOPhase3ANTAllocates92100Shares

802.9K Views5K Discussing

NvidiaDropsNearly14Percent

336.1K Views7.6K Discussing

View More