Square
Following
Hot
News
Profile
Share your thoughts
placeholder
Article
market update
live-cover
LIVE1,763
Trenches
CNPY
C
bade
b
CNPY
0xc6...ddd2
Market Cap
$.
Change
.
24h Vol
$.
Holders
.
FTR
F
bade
b
FTR
DFMt...pump
Market Cap
$.
Change
.
24h Vol
$.
Holders
.
1
1
bade
b
1
2bCC...pump
Market Cap
$.
Change
.
24h Vol
$.
Holders
.
STONK
S
bade
b
STONK
6GmA...UNgx
Market Cap
$.
Change
.
24h Vol
$.
Holders
.
AGT
A
bade
b
AGT
0x5d...e274
Market Cap
$.
Change
.
24h Vol
$.
Holders
.
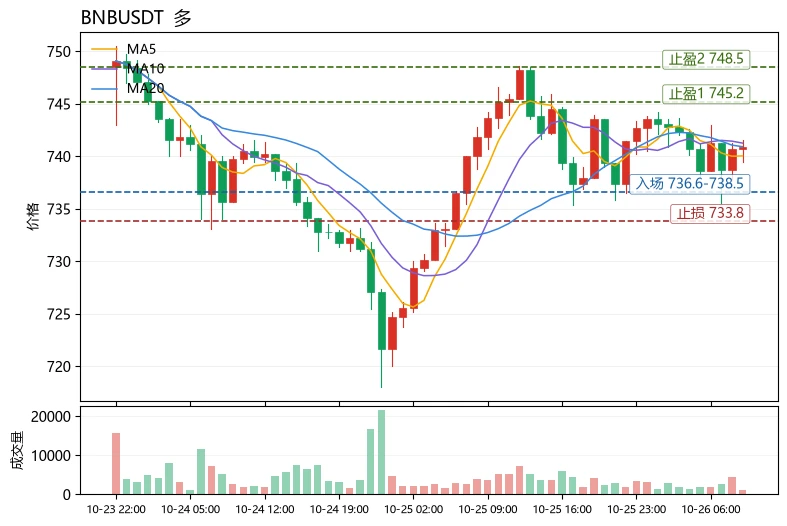
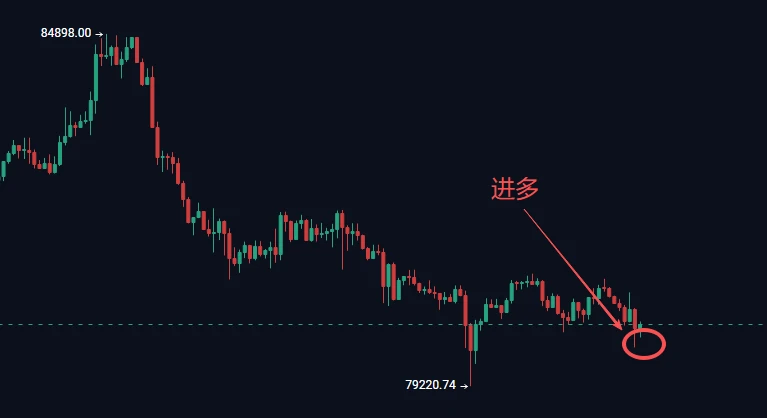
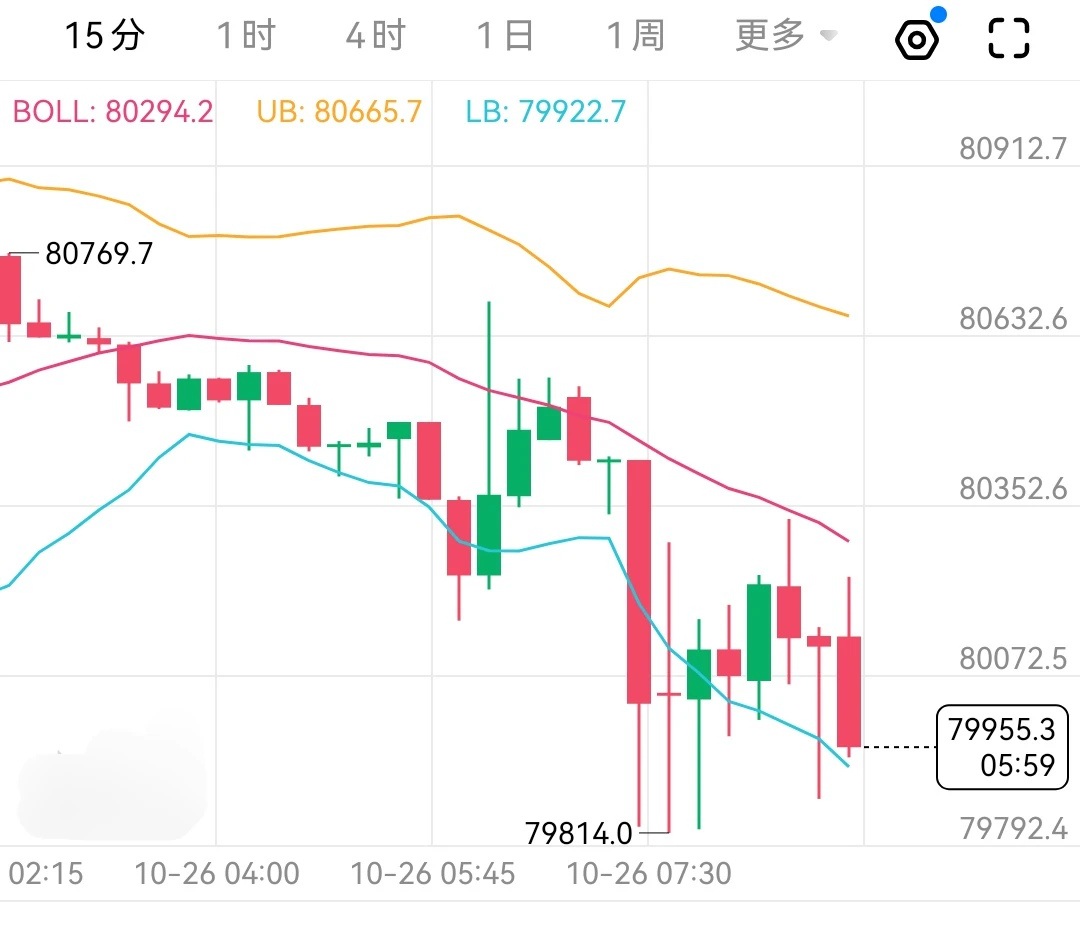
$BTC Once again, today’s call proved spot on!
Just after 9 this morning, I locked in the short strategy: short the big Bitcoin rebound in the 825-828 range, with a stop-loss above 832 and targets at 815-800.
Some people were wondering at the time whether they’d miss out on the rebound. But the market followed the script to a tee — price topped out around 829, right inside our entry zone, then turned down. The bears immediately took over and drove it lower, all the way to a low of 812. Not only did it hit the first target at 815 precisely, it went well beyond it. The short position safely banke
BTC-0.43%
Which step is most likely to fool you in this $TAO market move?
When I looked at $TAO ’s chart again, I first blocked out the 24-hour +4.24%. Not because that number is unimportant, but because it’s too easy to let it grab your attention. What really needs explaining right now is that $TAO moved first on the 1-hour chart, but the 4-hour chart hasn’t confirmed it yet. I’ll treat the shorter timeframe as a reminder, not a conclusion; without the larger timeframe following, the direction can still reverse.
The most convenient—and easiest to get wrong—approach is to pick whichever timeframe looks
post-image
TAO+3.08%
solana:EEpng77ZPn9FT4xsRjwuxNCcMBYq3HTwEscyTpump will finally be free today
EEpng77ZPn9FT4xsRjwuxNCcMBYq3HTwEscyTpump
#crypto $sol
post-image
SOL-0.68%
Weird total $DAG stake increased by 13M
post-image
DAG-0.47%
$NBIS
This will be on my radar whenever $Q bottoms
Some nice weekly targets:
$145
$107
$73
Personally I like bids from 132-145
post-image
NBIS-10.22%
$BAT is approaching a major long-term decision point.
After years of sustained downside pressure, BAT is pushing back toward its descending trendline on the weekly chart. The recent rebound, accompanied by a noticeable volume spike, makes this structure worth watching closely.
- Key resistance: Descending trendline
- Bullish trigger: A confirmed weekly breakout with follow-through
- What matters next: Whether buyers can turn this long-standing resistance into support.
A clean breakout could signal a meaningful shift in the long-term structure. Until then, rejection remains a possibility.
$BAT
post-image
BAT+7.62%
  • 2
  • 1
$CXMT Although I’ve already closed my ChangXin position—I bought at 8.35 and closed at 6.7 at a loss—but when I saw ChangXin announce a buyback today, I felt a bit of déjà vu. It seems very similar to Xiaomi’s trajectory back then. ChangXin says it will buy back a total of 1-2 billion over 12 months, but 1-2 billion over 12 months is insignificant next to ChangXin’s market cap of 3-4 trillion. And I’m afraid history will repeat itself: Xiaomi also fell from 61, started talking about buybacks when it dropped into the 40s, but it didn’t help—the more they bought back, the lower it went. It’s use
post-image
  • 1
Down 20% on 4.183x volume, I'm bullish on $ZIL
$ZIL It plunged from 0.003466 to 0.002598 in one day, down nearly 20%, and I'm still bullish.
With a drop this steep, volume actually surged: 24h trading volume was 5093642 USDT, 4.183 times the 30-day average. A massive volume spike means either panic selling or bottom-building through turnover; multi-timeframe signals are bullish, and the 1h ADX at 43.0 indicates a strong trend. I'm betting on bottom-building.
Daily RSI at 45.8 is in neutral territory; Bollinger Band width is 14.7%, and the close is in the lower half. The sharp drop may have ha
ZIL-20.75%
$RATS ‌RATS/USDT – Perp
🐀 Why did the rat pump? Because it finally found the cheese. 🧀
📈 Long
Entry: 0.00001740 – 0.00001770
TP1: 0.00001820
TP2: 0.00001866
TP3: 0.00001920
SL: 0.00001700
📉 Short
Entry: 0.00001850 – 0.00001866
TP1: 0.00001780
TP2: 0.00001740
TP3: 0.00001700
SL: 0.00001900
📉 Short – Breakdown
Entry: 0.00001720 – 0.00001740
TP1: 0.00001680
TP2: 0.00001630
TP3: 0.00001580
SL: 0.00001780
🔑 Key Levels
Resistance: 0.00001866 / 0.00001897
Support: 0.00001768 (EMA5) / 0.00001740 (EMA10) / 0.00001702 (EMA30) / 0.00001544
⚠️ Not financial advice. DYOR & manage risk.
RATS+15.16%
$SYN ‌SYN/USDT
🔗 Why did Synapse pump? Because it finally synced with the bulls. 📊
---
📈 Long
Entry: 0.1750 – 0.1780
TP1: 0.1820
TP2: 0.1875
TP3: 0.1900
SL: 0.1710
📉 Short
Entry: 0.1875 – 0.1890
TP1: 0.1830
TP2: 0.1780
TP3: 0.1730
SL: 0.1910
📉 Short – Breakdown
Entry: 0.1740 – 0.1750
TP1: 0.1700
TP2: 0.1680
TP3: 0.1650
SL: 0.1770
🔑 Key Levels
Resistance: 0.18758 / 0.18917 / 0.19000
Support: 0.18000 / 0.17500 / 0.16830 / 0.16470
⚠️ Not financial advice. DYOR & manage risk.
post-image
SYN+5.58%
$SMST has bullish divergence and could bounce. $MSTR needs a right shoulder. It may be time for the right shoulder
post-image
MSTR-9.06%
$EPIC That -20.7% bearish candle turned my take-profit order in the early hours into a stop-loss order.
First, a review of this week’s trades. On Monday, the Fed minutes struck a hawkish tone, and the dot plot showed rate-cut expectations for this year dropping from 3 cuts to 1. I was watching the correlation between BTC and Nasdaq futures—the rolling 30-day correlation coefficient was 0.78, meaning that when macro risk appetite contracts, altcoins are among the first to get drained of liquidity. EPIC was moving sideways at 0.28 at the time, and I didn’t exit because “trading volume is still 2
EPIC-17.68%
BTC-0.41%
NAS100-1.01%
$TIA Just yesterday at noon, I was saying it had bottomed at 0.46—I pointed to this exact level and said chasing the rally looked off.
By evening, it was already up 45% in seven days, and today it surged nearly 18% in a single day. Eden is an EVM chain aiming to enable “autonomous AI agent trading and payments”—a pretty compelling story. But when a project originally focused on modular data availability suddenly puts an AI banner up, I’m far more wary than interested.
Trading volume did surge 2.1x to 35 million, but look at the price: it’s up 88% from six months ago, 92% from 90 days ago, and
post-image
TIA+14.87%
No dinner plans tonight—just smoking. I’ve smoked so much I’m feeling overheated. Looks like I’ll need a cup of cooling herbal tea tomorrow.
post-image
Mysterious whale makes a $187 million bet! Going fully leveraged long on BTC and ETH, betting
live-cover
LIVE1,908
LIGHT's price has barely changed since 10/9! The truth behind LIGHT's 15% surge in the rolling window: range-bound trading!
LIGHT rose 15.68% in a single day to $0.2110.
The truth: LIGHT was quoted at $0.208 on 10/9. A week later, its overall price has barely moved, turning green again only because of the rolling calculation mechanism. No new IoT device integrations or data partnerships were found today.
Conclusion: This is wide-ranging volatility within an established range, not a new major uptrend. Don't mistake it for a trend breakout.
‍#LIGHT #跟涨 #区间震荡
$LIGHT #Short-term
post-image
LIGHT+15.17%
My Pumpfun callout paid me $2,679 yesterday
Drop your Pumpfun username or SOL address below
I’ll share some of this payout with my followers
post-image
SOL-0.68%
Load More

Join 40 M users in our growing community

⚡️ Join 40 M users in the crypto craze discussion

💬 Engage with your favorite top creators

👍 See what interests you

Trending Topics

USSeptemberPPIBeatsExpectations

91.35k Views1.91k Discussing

US September PPI came in at 6.3% YoY, well above the 5.3% market expectation, pointing to renewed producer-side inflation pressure. Weekly jobless claims were 199K, broadly in line with forecasts. Could hotter inflation further reduce room for rate cuts, and what does it mean for $BTC, US stocks, and gold?

GateWCTCS9GlobalTradingCompetition

37.87k Views6.5k Discussing

GateBTCAndETHFuturesVolumeRanksTop3

53.8k Views1.64k Discussing

View More