Share your thoughts
placeholder
Article
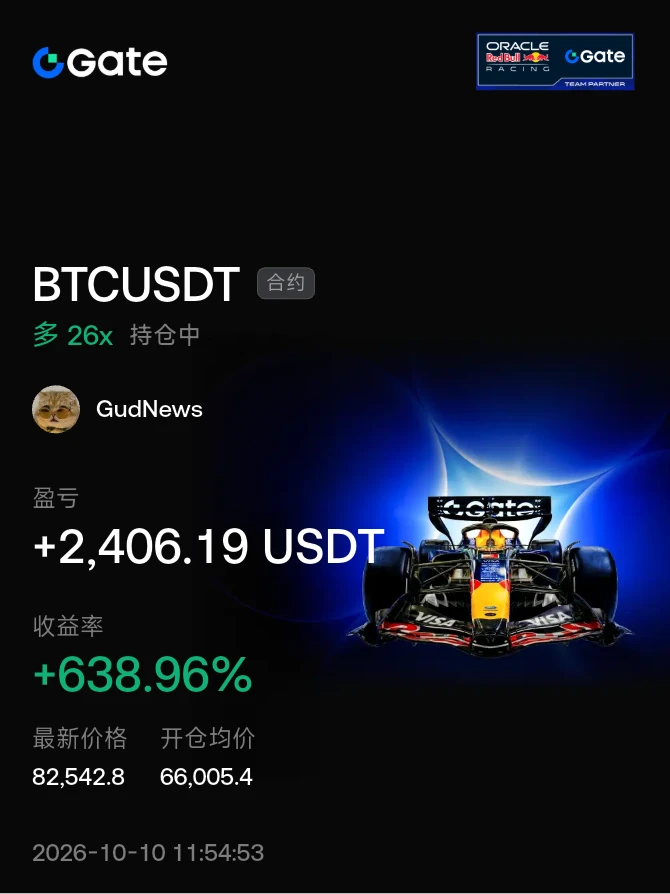
#晒出我的持仓收益 SanDisk's giant dragon breathed out a wave.
post-image
SNDK-2.06%
Insiders are calling this the most obvious short setup of 2026.

$LAB /USDT - SHORT

Trade Plan:
Entry: 0.05447 – 0.05619
SL: 0.06361
TP1: 0.04912
TP2: 0.04498
TP3: 0.03877

Why this setup?
Why now? The daily trend is bearish, which means the 1h price at 0.05533 sits at a high probability resistance zone. The 15m RSI reading of 56.03 shows the market is not yet exhausted, allowing the short to remain valid. The 1h ATR of 0.00345 tells us the volatility is compressed enough for a decisive move toward TP1 at 0.04912 and TP2 at 0.04498. The entry zone between 0.05447 and 0.05619 offers a preci
LAB+7.85%
After the data was released, I kept going long, with multiple trade ideas coming to fruition one after another, accumulating small gains into large ones. $XAU
post-image
XAU+0.64%
Is this really a rebound? This is CPR for my empty-position account, isn’t it?
I opened the market this morning: $SAFE was bottoming out without breaking down, and buying pressure was strengthening. I flagged it as bullish at 0.08209—not out of impulse, but because I was waiting for the structure. Before the market had fully started moving, many people were still watching from the sidelines. I only focused on key levels and volume.
Now it’s at 0.09428, up +147.39% and taking off. The earlier grind tested everyone’s patience, but this feels great—I can finally treat myself to a good meal.
I’d
post-image
SAFE+2.12%
DOGE+1.54%
BTC+1.10%
The August CPI print looks neutral at first glance, but I think the details matter more than the headline.
CPI rose 0.4% MoM and 3.4% YoY, exactly in line with expectations. Core CPI came in at 0.3% MoM and 2.4% YoY, showing that underlying inflation is still moving in the right direction.
So this isn't a report that forces the Fed to change course.
But it also doesn't give them enough evidence to become aggressively dovish.
The interesting part is the gap between headline inflation and core inflation. If energy-driven pressure remains temporary, the Fed can still focus on the broader cooling
MU+0.31%
AAPL+1.53%
NVDA+0.62%
XAUAUD+1.45%
XAGAUD+1.49%
  • 4
  • 2
$STONKBROKER
$STONKBROKER is the unusual one: the price is flat, but the activity is not.
The Gate screen shows -0.36% over 24h, yet volume is around $1.41M against a visible $19.1M market cap.
My view: neutral-watch.
For a Meme asset, this is more interesting to me than a simple green candle. There is meaningful trading activity, but price has not translated that activity into upside momentum.
That creates two possibilities: buyers are absorbing supply, or the market is simply distributing around the current range.
I want confirmation before taking a direction. A clean move higher with expan
post-image
  • 5
Breaking: 🇺🇸 U.S. core CPI came in at 2.4%
Expected: 2.4%
The lowest level in 66 months.
What does this mean for the crypto market going forward—bullish or bearish? Most dramatically, at the moment of the release, Bitcoin reached around 76000, while gold fell to around 4295, then surged instantly.
post-image
BTC+1.09%
GLDX+0.60%
PAXG+0.66%
The lines have already been drawn for you—can’t you even reach out and pick up the money?

BTC 77458 peak, right in the 77300–77600 entry zone; the first target was 76400–76600, but it directly hit 75866. Wherever the line is drawn, that’s where the money lands. $BTC #美国8月PPI录得5.4%
BTC+1.09%
Six hours ago, a free update signaled an upward breakout opportunity; yesterday’s subscription trade 2418 went long and gained nearly 400%! #CoinDesk披露GateRWA永续合约全球Top3
post-image
TradingKingGaoYuliang
Latest levels shared! #Gate Mainstream CEX Top 4
  • 2
The market moved in 2 minutes; I still couldn’t execute the planned long around 76000 🤣. Why don’t I have a little hand for getting rich呀呀呀呀.
post-image
Insiders are watching SYMBOL break above 78052 right now.

$BTC /USDT - LONG

Trade Plan:
Entry: 76838.04 – 77024.86
SL: 76034.73
TP1: 77603.99
TP2: 78052.35
TP3: 78724.89

Why this setup?
Why now? The daily trend is bullish with a 4h higher timeframe setting up a long bias at 95% confidence. The 1h ATR of 373.63 means the market is expanding enough to fuel a move from the entry zone around 76931. The 15m RSI at 43.85 shows room to run before overbought territory, and TP1 at 77603 aligns with the first major resistance. Invalidation sits at 78023.45, which is the line in the sand below TP2
BTC+1.10%
The Apple event special livestream from two days ago gave 310.68; the current stock price is up nearly 7%, feels great 😘$AAPL
AAPL+3.39%
Just breaking even on this ETH position would be enough.
post-image
ETH+4.04%
$64.8 billion—the “breakout moment” for RWA perpetual contracts has arrived
Guys, let’s start with a set of numbers. According to CoinMarketCap’s latest report, “RWA Perpetuals: State of the Market — August 2026,” Gate’s RWA perpetual contract trading volume surged from $12.2 billion in June to $64.8 billion in August—a staggering 5.3-fold increase in just three months. What does $64.8 billion mean? It is 2.6 times the record trading volume in July. Gate ranks third among centralized exchanges worldwide, accounting for 9.3% of total CEX RWA trading volume.
Even more astonishing are the weekly
AAPL+1.53%
🎉 Up to 100 USDT in a single week! Gate Square’s “Weekly Showcase” is in full swing!
📌 How to participate
① Sign up for the event 👉 https://www.gate.com/campaigns/6244
② Post with the #每周来晒 and #8月CPI数据出炉 hashtags
③ Share your market outlook, earn points, climb the leaderboard, and win rewards!
💬 This week’s hot topic
U.S. CPI rose 0.4% month-on-month in August, the highest since June; the annual rate was 3.4%, unchanged from the previous reading. Both figures were in line with expectations. How will this affect expectations for Federal Reserve policy, and what market opportunities wi
post-image
GateSquare
🎉 Up to 100 USDT in a single week! Gate Square’s “Weekly Showcase” is in full swing!
📌 How to participate
① Sign up for the event 👉 https://www.gate.com/campaigns/6244
② Post with the #每周来晒 and #8月CPI数据出炉 hashtags
③ Share your market outlook, earn points, climb the leaderboard, and win rewards!
💬 This week’s hot topic
U.S. CPI rose 0.4% month-on-month in August, the highest since June; the annual rate was 3.4%, unchanged from the previous reading. Both figures were in line with expectations. How will this affect expectations for Federal Reserve policy, and what market opportunities will it bring?
💡 Discussion
1️⃣ Will the CPI data change market expectations for the Federal Reserve’s rate-cut path?
2️⃣ How will crypto/stock assets react in the short term?
3️⃣ Which trading opportunities are you most bullish on under current market conditions?
Share now: https://www.gate.com/post
Event details: https://www.gate.com/announcements/article/101691
repost-content-media
  • 1
BREAKING: Polymarket puts the odds of a 25-basis-point Fed rate hike in September at 79%.
  • 3
Everyone watching $BZ /USDT long is about to get blindsided by a sharp drop.

$BZ /USDT - SHORT

Trade Plan:
Entry: 100.21 – 100.91
SL: 103.91
TP1: 98.05
TP2: 96.37
TP3: 93.86

Why this setup?
Why now? The 1h price is sitting at 100.58, which is practically sitting on the entry_ref level of 100.56, making this the most precise entry zone we have seen. The daily trend is range-bound, which means a directional breakout is overdue and the 15m RSI at 35.08 confirms we are not yet oversold enough to expect a bounce. The 1h ATR of 1.396351 tells us the average volatility, so any move beyond that
BZ-1.25%
My ranking is 52983, which is 2983 places away from reaching the top 50,000.
I’m just a little short.
I need to improve my ranking to within the top 50,000.
This is extremely important to me.
KOLs who recognize me, please help me.
Thank you, everyone.
  • 5
Load More

Join 40 M users in our growing community

⚡️ Join 40 M users in the crypto craze discussion

💬 Engage with your favorite top creators

👍 See what interests you

View More