










#BTC大跌 #作手分析
🔥 The $80k mark has given way! BTC has been correcting for 391 days—can $76,000 hold?
Trading watch: $BTC $ETH $SOL
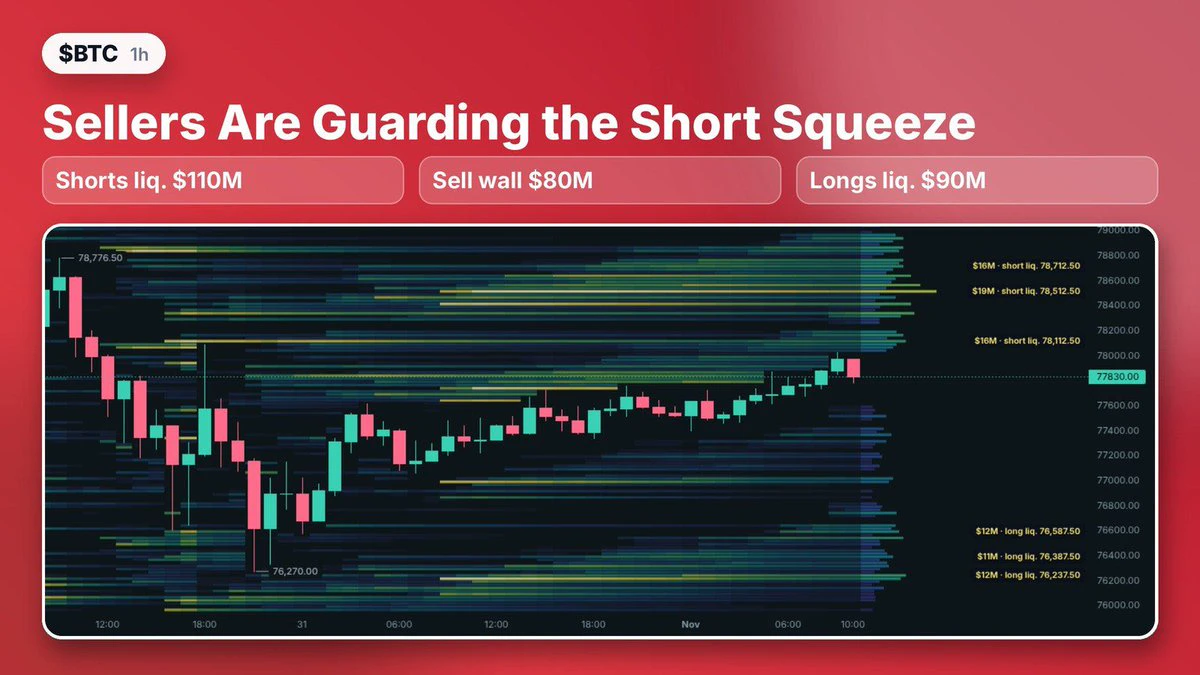
Today I saw a hot topic on GATE Square: BTC has fallen to around $77k, breaking below the $80k mark. Would you still dare to buy the dip?
Some believe this is an opportunity after leveraged positions have been flushed out, while others worry the bull market is over.
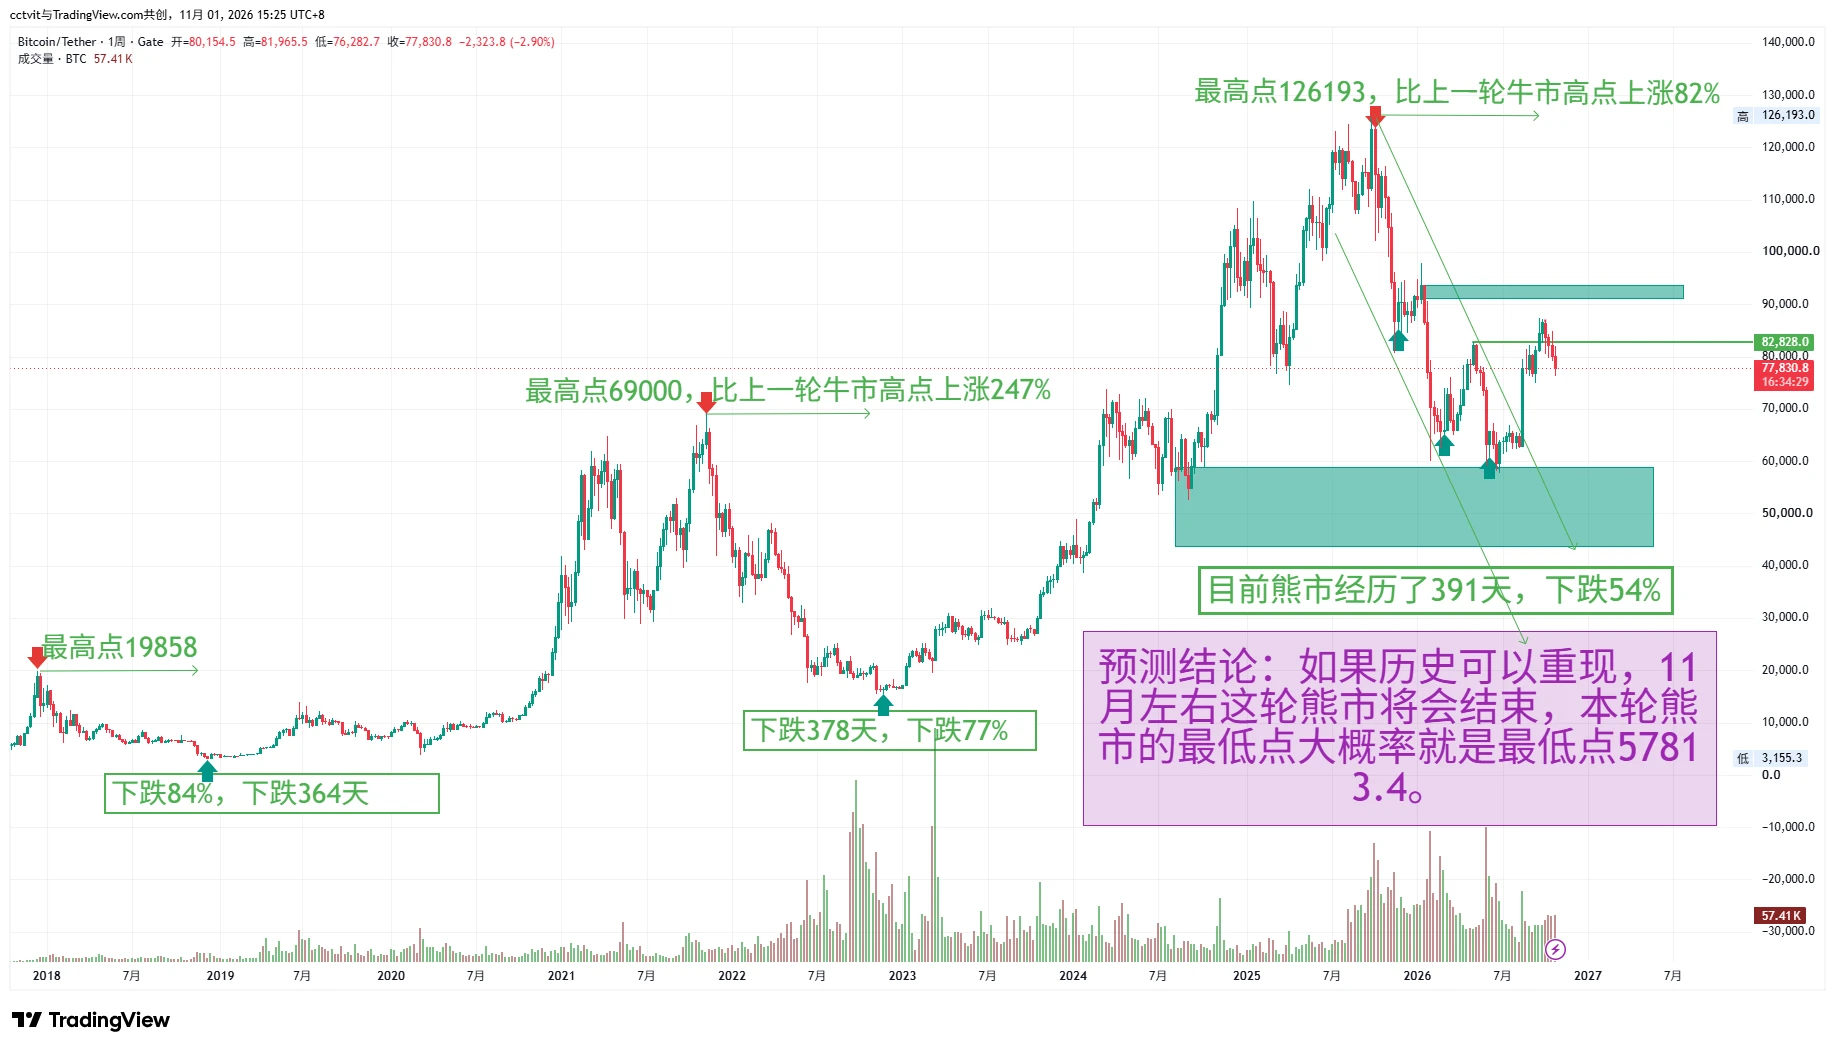
This topic reminded me of a BTC historical-cycle analysis I published on July 3 this year. BTC was around $60k at the time. Based on the duration and magnitude of the previous two bear markets, I concluded that the current correction might not have run its course, and that we might still have to wait for a true bottom.
It is now November 1, 2026. Since the all-time high of $126,193 in October 2025, 391 days have passed.
The time window has arrived, but whether a bottom has truly formed still depends on the price structure.
📊 I. Historical cycles: 391 days—the time window has arrived
First, a look back at the previous two bear markets:
2018: BTC fell from $19,858 to $3,155 over 364 days, with a maximum decline of about 84%.
2022: BTC fell from $69,000 to $15,468 over 378 days, with a maximum decline of about 77%.
The two bear markets took an average of about 371 days to reach their final lows from their peaks.
This cycle has now lasted 391 days since its October 2025 peak, about 20 days longer than the average duration of the previous two cycles.
One clarification: 391 days is the time elapsed from this cycle’s peak to now; it does not mean that the final bottom has formed. Historical cycles are a reference, not a blueprint to follow blindly.
Also, BTC previously fell as low as $57,813.4 in this cycle, with a maximum drawdown of about 54%. That is still markedly different from the maximum declines of 77% and 84% in the previous two cycles.
So I won’t declare the bear market over just because 371 days have passed.
🎯 II. Weekly structure: $76,098 is the key level to watch
Now let’s look at the current price structure.
GATE BTC spot is currently around $77,976. On the weekly chart, BTC has pulled back to retest the neckline after breaking out of a W bottom, and is now testing the 0.382 Fibonacci level of the latest upward swing.
Three key levels are worth watching closely:
📌 First level to watch: 0.382, around $76,098.
This is currently the most important short-term area to watch. If it provides solid support, with signals such as declining weekly volume as the price stabilizes or a long lower wick, and the price breaks back above resistance on a shorter time frame, the W-bottom structure could remain intact. The next area to watch would be $91,000–$93,000.
📌 Second level to watch: 0.5, around $72,600.
If $76,098 is decisively breached, it would indicate that the current pullback is deeper than expected. The next key question is whether the price can stabilize around $72,600.
📌 Third level to watch: 0.618, around $69,100.
This is a deeper retracement area to watch. It would be worth watching if the market continues to weaken, but it absolutely does not mean that $69,100 would automatically be the bottom.
Remember: Fibonacci levels are areas to watch, not support levels guaranteed by the market.
⚠️ III. The trader’s plan: Don’t guess the bottom; wait for confirmation
Back in July, I leaned toward building a position in stages using a pyramid approach, because the time cycle suggested the correction might not yet have fully played out.
Now that the time window has arrived, I’ll adjust my strategy accordingly: focus on key support areas and wait for right-side trading signals instead of placing a large bet on the bottom in advance.
I’m preparing to watch three scenarios closely:
📌 Scenario 1: Support holds around $76,000.
If the price quickly recovers after a sharp drop, breaks above resistance on a shorter time frame, and then successfully retests that level, I may consider a small long position. I’d set the stop-loss based on the confirmed structural low, with $91,000–$93,000 as the first upside target.
📌 Scenario 2: A decisive break below $76,000.
Don’t rush to buy the dip. Focus on around $72,600. If the price continues to fall, watch the $69,100 area. Wait for selling pressure to ease, volume to decline as the price stabilizes, and a breakout on increased volume before considering entering in stages.
📌 Scenario 3: The rebound remains weak, and key support levels keep giving way.
Reassess whether the weekly W-bottom structure has failed. I’d rather hold USDT for now than keep averaging down, and certainly wouldn’t stubbornly hold a position just to prove my judgment right.
As for whether this drop is due to leveraged positions being flushed out, the decline alone isn’t enough to tell. Open interest, funding rates, and trading volume must also be considered. A flush-out of leveraged positions may create an opportunity, but it doesn’t mean the trend will necessarily reverse.
🔥 Summary
After 391 days of correction, the historical time window has arrived—but the market won’t automatically give us a bottom just because the time is up.
Historical cycles tell us when to be more cautious; price structure tells us when we can actually act.
Don’t guess the top or bottom, and don’t chase the first big green candle.
Let the market give us the answer instead of trying to predict it.
Based on the current weekly trend, what are you planning to do?
A. Support holds at $76,000; enter long in stages 🚀
B. Breaks below $76,000; wait for $72,600 📉
C. Trend weakens; continue holding USDT ☕
D. Don’t guess levels; wait for right-side confirmation 🛡️
Feel free to comment A / B / C / D and share your trading plan. 👇
(The above is my personal cycle analysis and trading plan, for discussion only and not investment advice. The crypto market is highly volatile, so manage your position size and set strict stop-losses.)