Share your thoughts
placeholder
Article
The moon's closer than it looks.
#memecoins #crypto
post-image
solana:HcRLc9VDgjLeK154xDawfb1dmVJ98DoSqcwTHGqiDeJR really nice bullish wedge forming here
post-image
SOL-1.66%
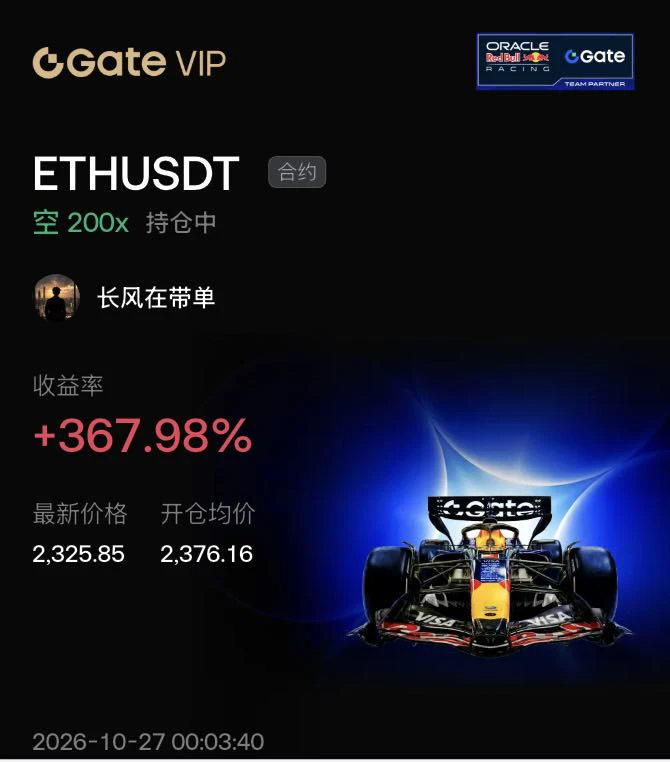
This morning, ETH likewise rebounded from the bottom to near 2480 before meeting resistance and pulling back. In the evening, it dipped to the 2400 level at its lowest. The shorting strategy played out as expected, with the 2400 target hit precisely, securing an 80-point move. The market has now begun a rebound recovery!

From the current market structure, the daily chart surged and then pulled back, with the price retreating to near the Bollinger middle band amid intense bullish-bearish contention. The upper Bollinger band is clearly exerting resistance, bullish momentum is weakening, and th
post-image
ETH-0.18%
Yesterday’s trend forecast played out perfectly, so how will the market move today? Yesterday’s trend first tested the daily Bollinger middle band, then came under pressure and continued downward. After a rapid overnight decline, it entered a slow consolidation, in line with expectations. Shorts taken in the early hours and in the morning captured 680 and 1700 points, respectively, followed by a 600-point long after the decline reached the daily Bollinger lower band. That totaled 2980 points. We are currently on a 22-win streak. More excitement to come……
From the chart, after narrowing, the da
post-image
ETH-0.21%
BTC-1.37%
#美国8月PPI录得5.4%高于预期
The Producer Price Index (PPI), showing a 5.4% year-over-year increase, is certainly higher than market expectations. This reinforces the notion that inflationary pressures are persistent, particularly at a time when employment remains strong. The key tension now lies in whether the Consumer Price Index (CPI) will confirm this trend or show signs of cooling.
Here is my view on the risk ranking across asset classes:
US Equities usually react first, as investors immediately price in Fed policy expectations.
A higher CPI could reignite fears of interest rate hikes and put pre
NAS100-0.10%
BTC-1.37%
XAUUSD+0.07%
XAUAUD+0.01%
Trades this week so far for subscribers chat
Join for $14 a month by clicking on this link:
$ETH hit first and second targets! 🟢
#XAUUSD Stopped 🔴
$KLAC hit first target!🟢
$V hit first target!🟢
$NBIS hit first, second and third targets!🟢
$GPRO Stopped 🔴
#USOIL hit first, second and third targets!🟢
$META hit first and second target!🟢
$MRVL hit first and second targets!🟢
$IREN hit first, second and third targets!🟢
$SPCX Stopped and then hit all targets 🔴
$NBIS hit first and second targets!🟢
$AAOI hit first, second and third targets!🟢
$MU $IREN trades are active, $BE $MSTR yet to t
post-image
ETH-0.21%
KLAC-3.02%
NBIS-5.13%
GPRO-0.35%
Nobody is talking about the silver setup hiding in plain sight right now.

$XAG /USDT - LONG

Trade Plan:
Entry: 63.53 – 63.89
SL: 61.44
TP1: 65.41
TP2: 66.54
TP3: 68.25

Why this setup?
Why now? The 1h price sits at 63.71 inside a tight entry zone between 63.53 and 63.89, and the 15m RSI is at 24.84, signaling room for a reversal higher. The 1h ATR of 0.726906 shows enough volatility to push the 1h price toward TP1 at 65.41 and then TP2 at 66.54, while the daily trend being range-bound means we are looking for a breakout, not a continuation. The invalidation level at 65.81 acts as the line
XAG-5.51%
Why is everyone suddenly calling NEAR a trap right before a massive move?

$NEAR /USDT - LONG

Trade Plan:
Entry: 2.4749 – 2.5079
SL: 2.3329
TP1: 2.6103
TP2: 2.6896
TP3: 2.8085

Why this setup?
Why now? The daily trend is firmly bullish, setting the stage for a continuation play. The 1h ATR of 0.066061 confirms that volatility is expanding just enough to fuel a decisive push. With the 15m RSI sitting at 45.04, momentum is neutralizing oversold conditions without yet overheating, creating room for a clean entry at the 2.4914 reference. The plan targets TP1 at 2.6103 and extends to TP2 at 2.6
NEAR+1.86%
BTC Market Updates
live-cover
LIVE35
Why is $UNI /USDT quietly ignoring a 4h setup that says otherwise?

$UNI /USDT - LONG

Trade Plan:
Entry: 6.019 – 6.077
SL: 5.680
TP1: 6.324
TP2: 6.508
TP3: 6.784

Why this setup?
Why now? The daily trend is bullish, but the 1h ATR of 0.117976 shows volatility is compressed enough for a clean breakout. The 15m RSI at 44.48 signals room to run before overbought, while the entry zone between 6.019 and 6.077 offers a precise risk-defined long. The first target of 6.324 and the second of 6.508 both sit well above that zone, but the invalidation level at 6.240 is the hard line that protects the
UNI-2.47%
JUST IN: Spot $BTC ETFs sold $166M over two days.
Hesitation at $80k or full trend reversal?
post-image
BTC-1.37%
  • 3
I just went from $10k to $50k to -$1,190 in like 5 minutes on $RIDE 😭🤣
post-image
The second dividend distribution: I received nearly 600U from a 100U dividend...
post-image
What Will Gate’s Next Move Be After Entering the CEX Top 4?
The changing exchange rankings are becoming increasingly interesting.
Gate has entered the mainstream CEX Top 4, while its global user base has surpassed 60 million, showing that market competition is entering a new phase.
In the past, people mainly evaluated CEXs based on spot trading volume and derivatives scale; now, it increasingly feels like they are comparing a complete “product ecosystem.”
Whoever can provide more trading scenarios will have a better chance of retaining users.
Gate’s recent product moves are quite clear: contin
MEME-1.92%
  • 45
There isnt better place to do it
post-image
i have a theory for infinite money making very dangerous play but could work out:
buy $BEBI get free $KNOTS get free $STONK sell $STONK and repeat
what do you think?
smash or pass?
NFA
post-image
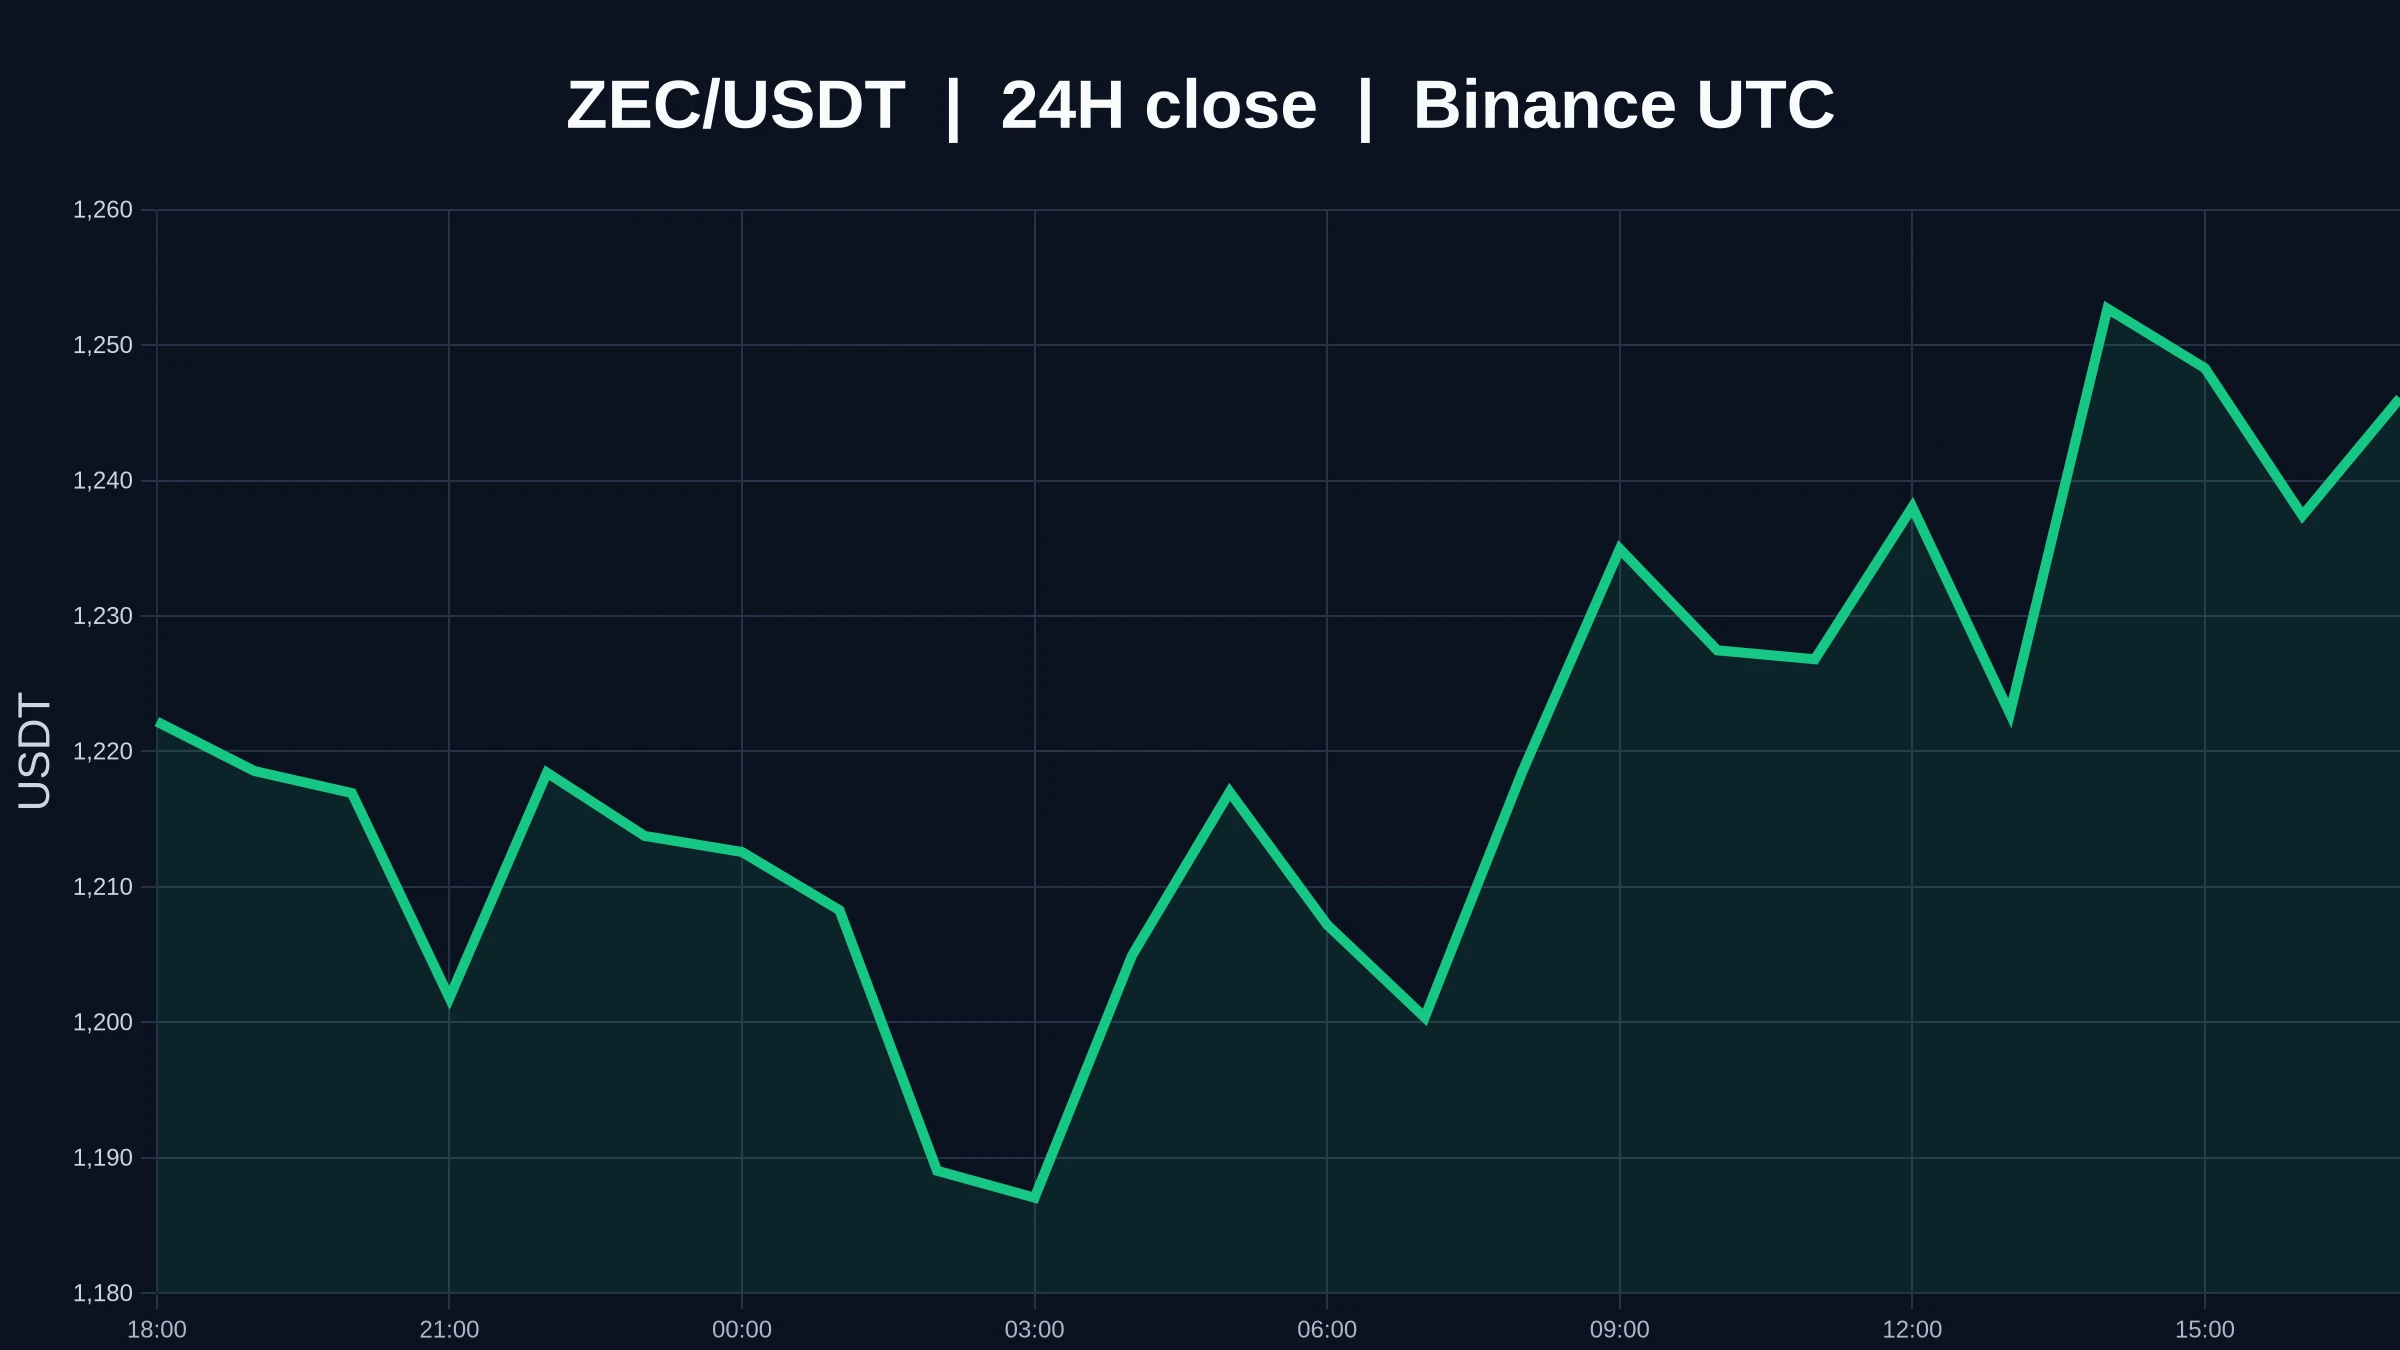
ZEC is currently trading around 1132. After surging to a previous high of 1297, it came under pressure and pulled back. The intraday high reached 1257, while the low fell to 1112, with the market entering a high-level correction phase.

From the current chart, a sharp retracement has followed a strong rally on the daily timeframe. The price remains above the Bollinger middle band, and the broader bullish structure has not been completely broken. After consecutive sharp gains, bullish momentum has rapidly weakened, while the upper Bollinger band is exerting strong resistance, indicating that t
post-image
ZEC-10.57%
just another 287 more fumbles chat before we make it fr fr
post-image
Everyone is fading the daily bearish trend, but SYUI is quietly building a long.

$SUI /USDT - LONG

Trade Plan:
Entry: 0.736 – 0.742
SL: 0.699
TP1: 0.769
TP2: 0.789
TP3: 0.819

Why this setup?
Why now? The 1h price is holding at 0.739 while the 15m RSI plunges to 26.93, signaling a deep oversold bounce within a broader bearish 1D trend. The 1h ATR of 0.01285 defines the volatility envelope that makes the 0.736 to 0.742 entry zone a precise scalp. Hitting TP1 at 0.769 rewards the reversal, while TP2 at 0.789 captures the full mean return against the daily structure. The line in the sand is
SUI-4.40%
Load More

Join 40 M users in our growing community

⚡️ Join 40 M users in the crypto craze discussion

💬 Engage with your favorite top creators

👍 See what interests you