Share crypto content and earn up to 60% commissions through content mining.
placeholder
gatefun
Crypto Long/Short Watch: Should You Buy This ETH Pair? Will SOL Be a Better Diversified Asset?
【Plain-language guide】Many people default to “BTC + ETH” as the standard answer for institutions entering the crypto market, but historical data may not support that instinct. Morgan Stanley’s view is very direct: if your goal is to diversify within crypto, SOL may have been a better fit than ETH over the past four years.
The issue isn’t whether ETH is good; it’s that as the crypto market increasingly looks like a configurable asset pool, what investors really should be asking isn’t “Should we add mo
ETH-3.44%
SOL-2.05%
BTC-1.46%
View Original
post-image
  • Reward
  • Comment
  • Repost
  • Share
Market price update
gate liveLIVE
660
  • Reward
  • Comment
  • Repost
  • Share
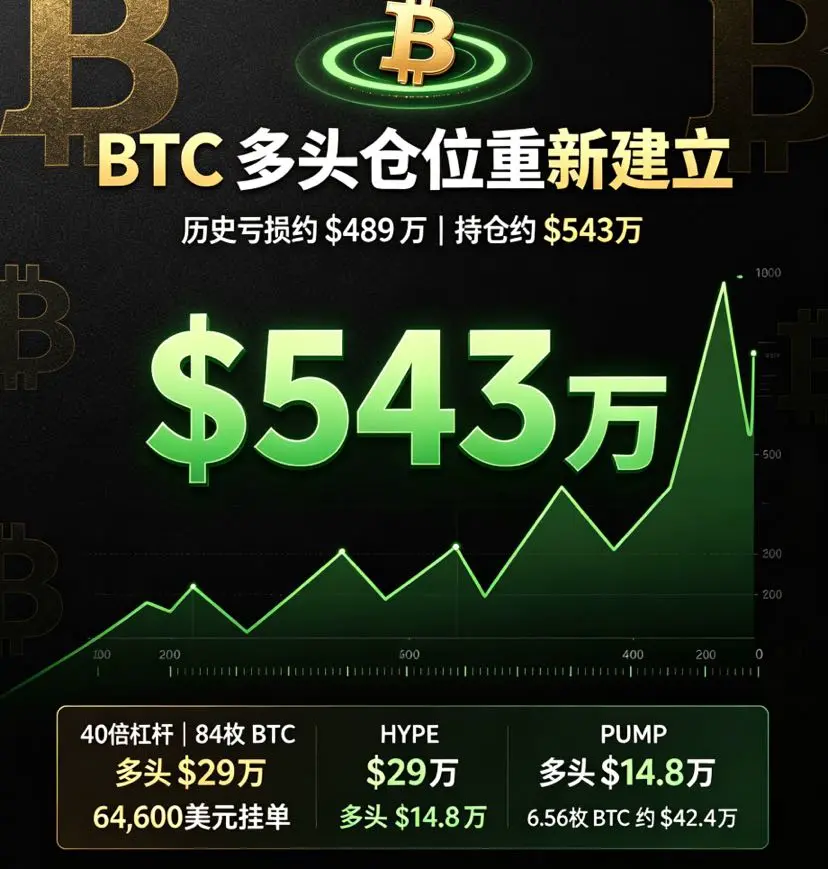
A trader with a historical loss of $4.89 million has re-opened a $5.43 million BTC long position using 40x leverage, holding 84 BTC (worth $5.43 million). At the same time, they hold $290k worth of HYPE long positions and $148k worth of PUMP long positions, and have placed a buy order at $64,600 for 6.56 BTC ($424k).
BTC-1.49%
HYPE-8.34%
PUMP0.84%
View Original
post-image
  • Reward
  • Comment
  • Repost
  • Share
7.17 Morning SOL Analysis
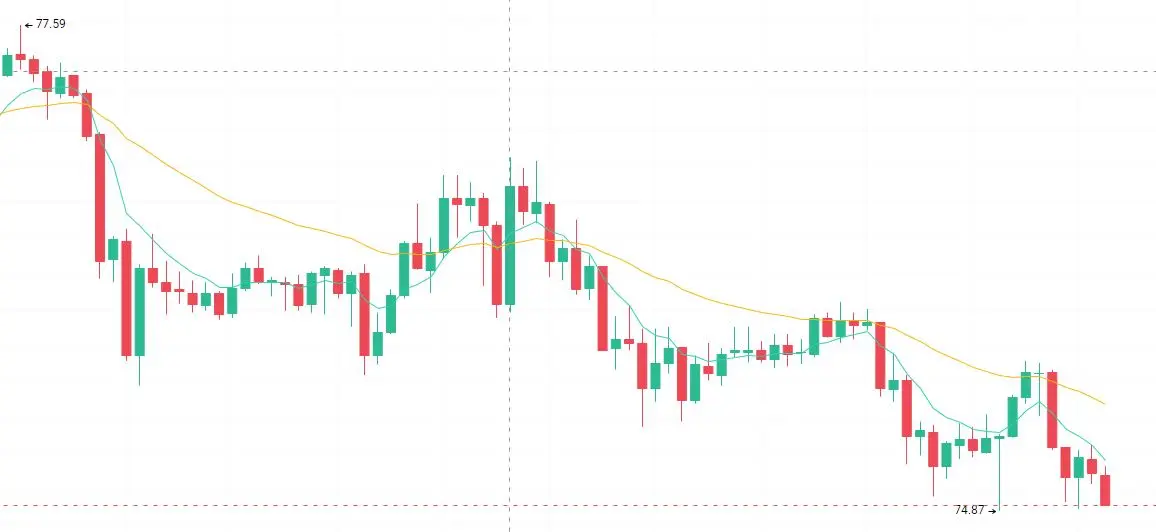
Analysis: Lightly short around 76.80, target 75.30-74.87
Yesterday, the 77.59 high short order didn’t get placed. Wait for a mild rebound to push higher, then build shorts in batches. For long positions, wait for a pullback to the 74.87 low to enter again. Set a stop-loss at 74.40; rebound targets look at 76.50-77.60. After SOL surged to 79.01 and topped, it has been ranging and then steadily falling. The current price is 75.05. On the 1-hour timeframe, the moving averages keep sloping downward, forming bearish pressure; every time price rebounds slightly and touches
BTC-1.46%
View Original
post-image
  • Reward
  • Comment
  • Repost
  • Share
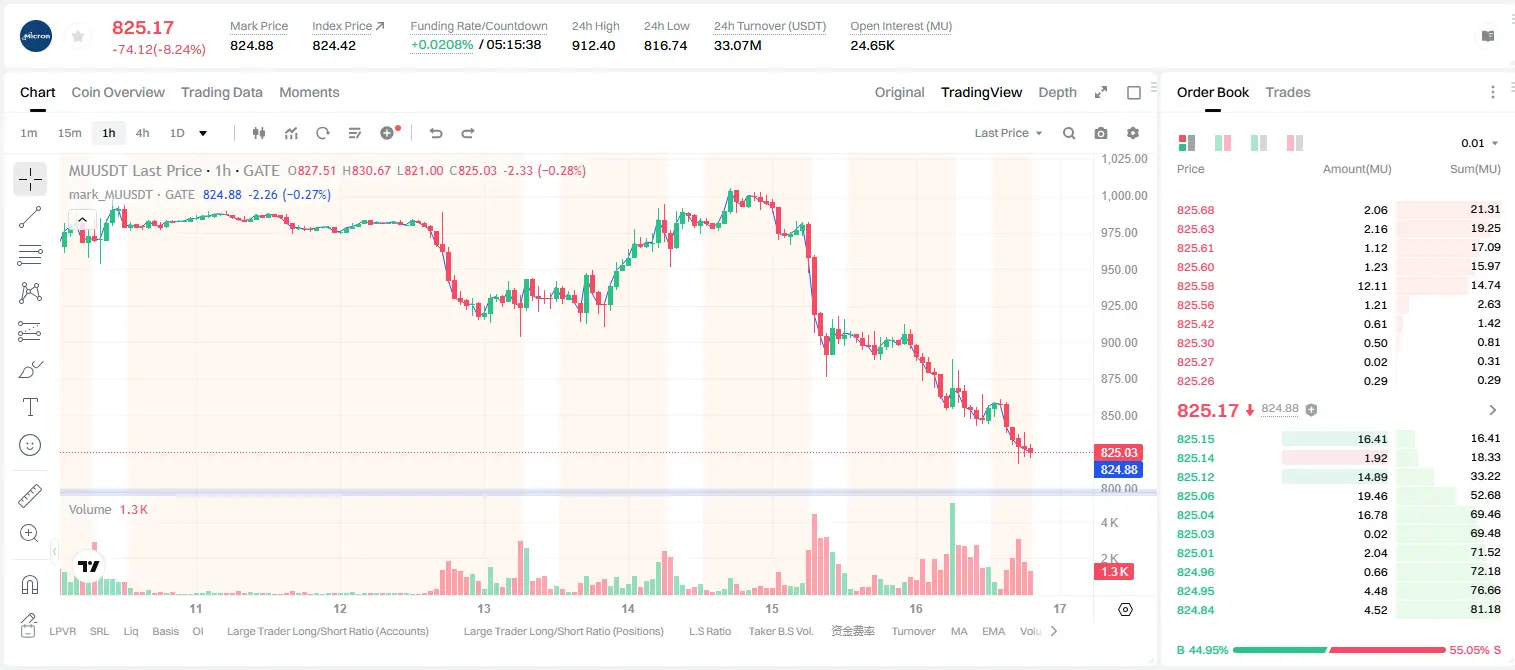
$MU /USDT whale accumulation signals already appeared?
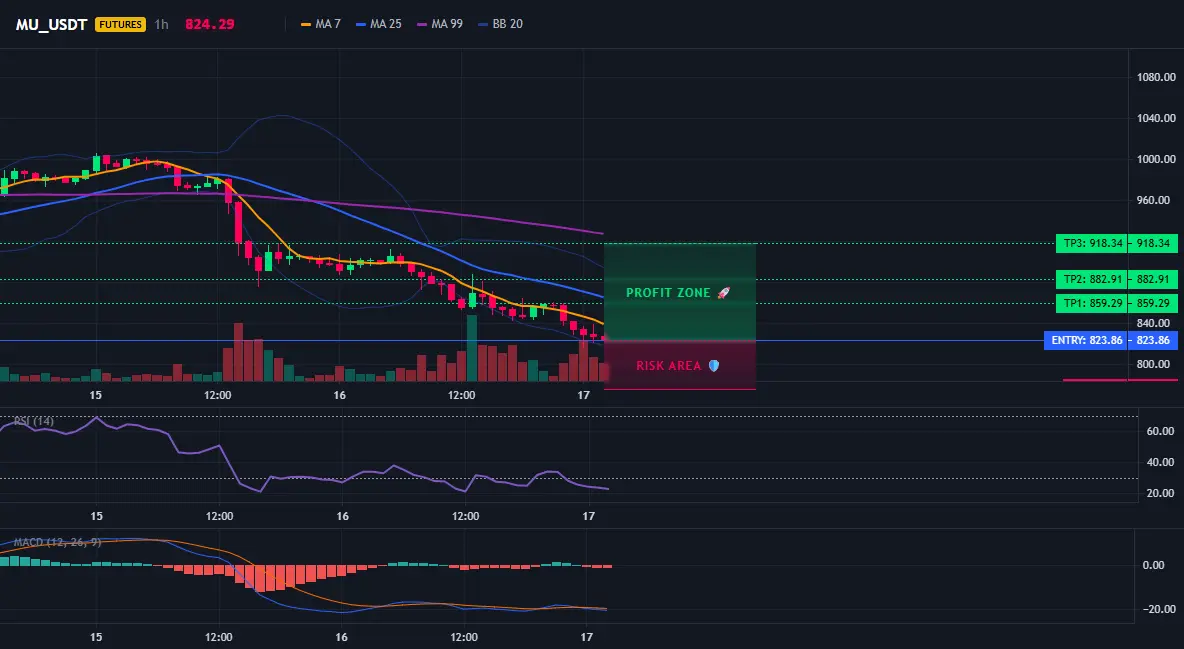
MU_USDT - Go LONG
Trading plan:
Entry: 820.07 – 827.65
SL: 776.62
TP1: 859.29
TP2: 882.91
TP3: 918.34
Why focus on this structure?
On the 4-hour timeframe, a LONG signal has appeared with a confidence of 77%. Within the daily line’s range-bound zone, the 15-minute RSI is only 37—an oversold bounce is about to trigger. Current entry reference is 823.86; the first target TP1 is 859.29, with a reward-to-risk ratio above 2:1.
Discussion:
Will this move pump to TP1 first and then pull back, or will it directly V-reverse to TP2?
MU-5.92%
View Original
post-image
post-image
  • Reward
  • 1
  • Repost
  • Share
612Ceros:
The 820 support zone is fairly strong, but with the RSI on the 15-minute chart that low, it usually bounces quickly and then moves sideways; a V-reversal is uncommon.
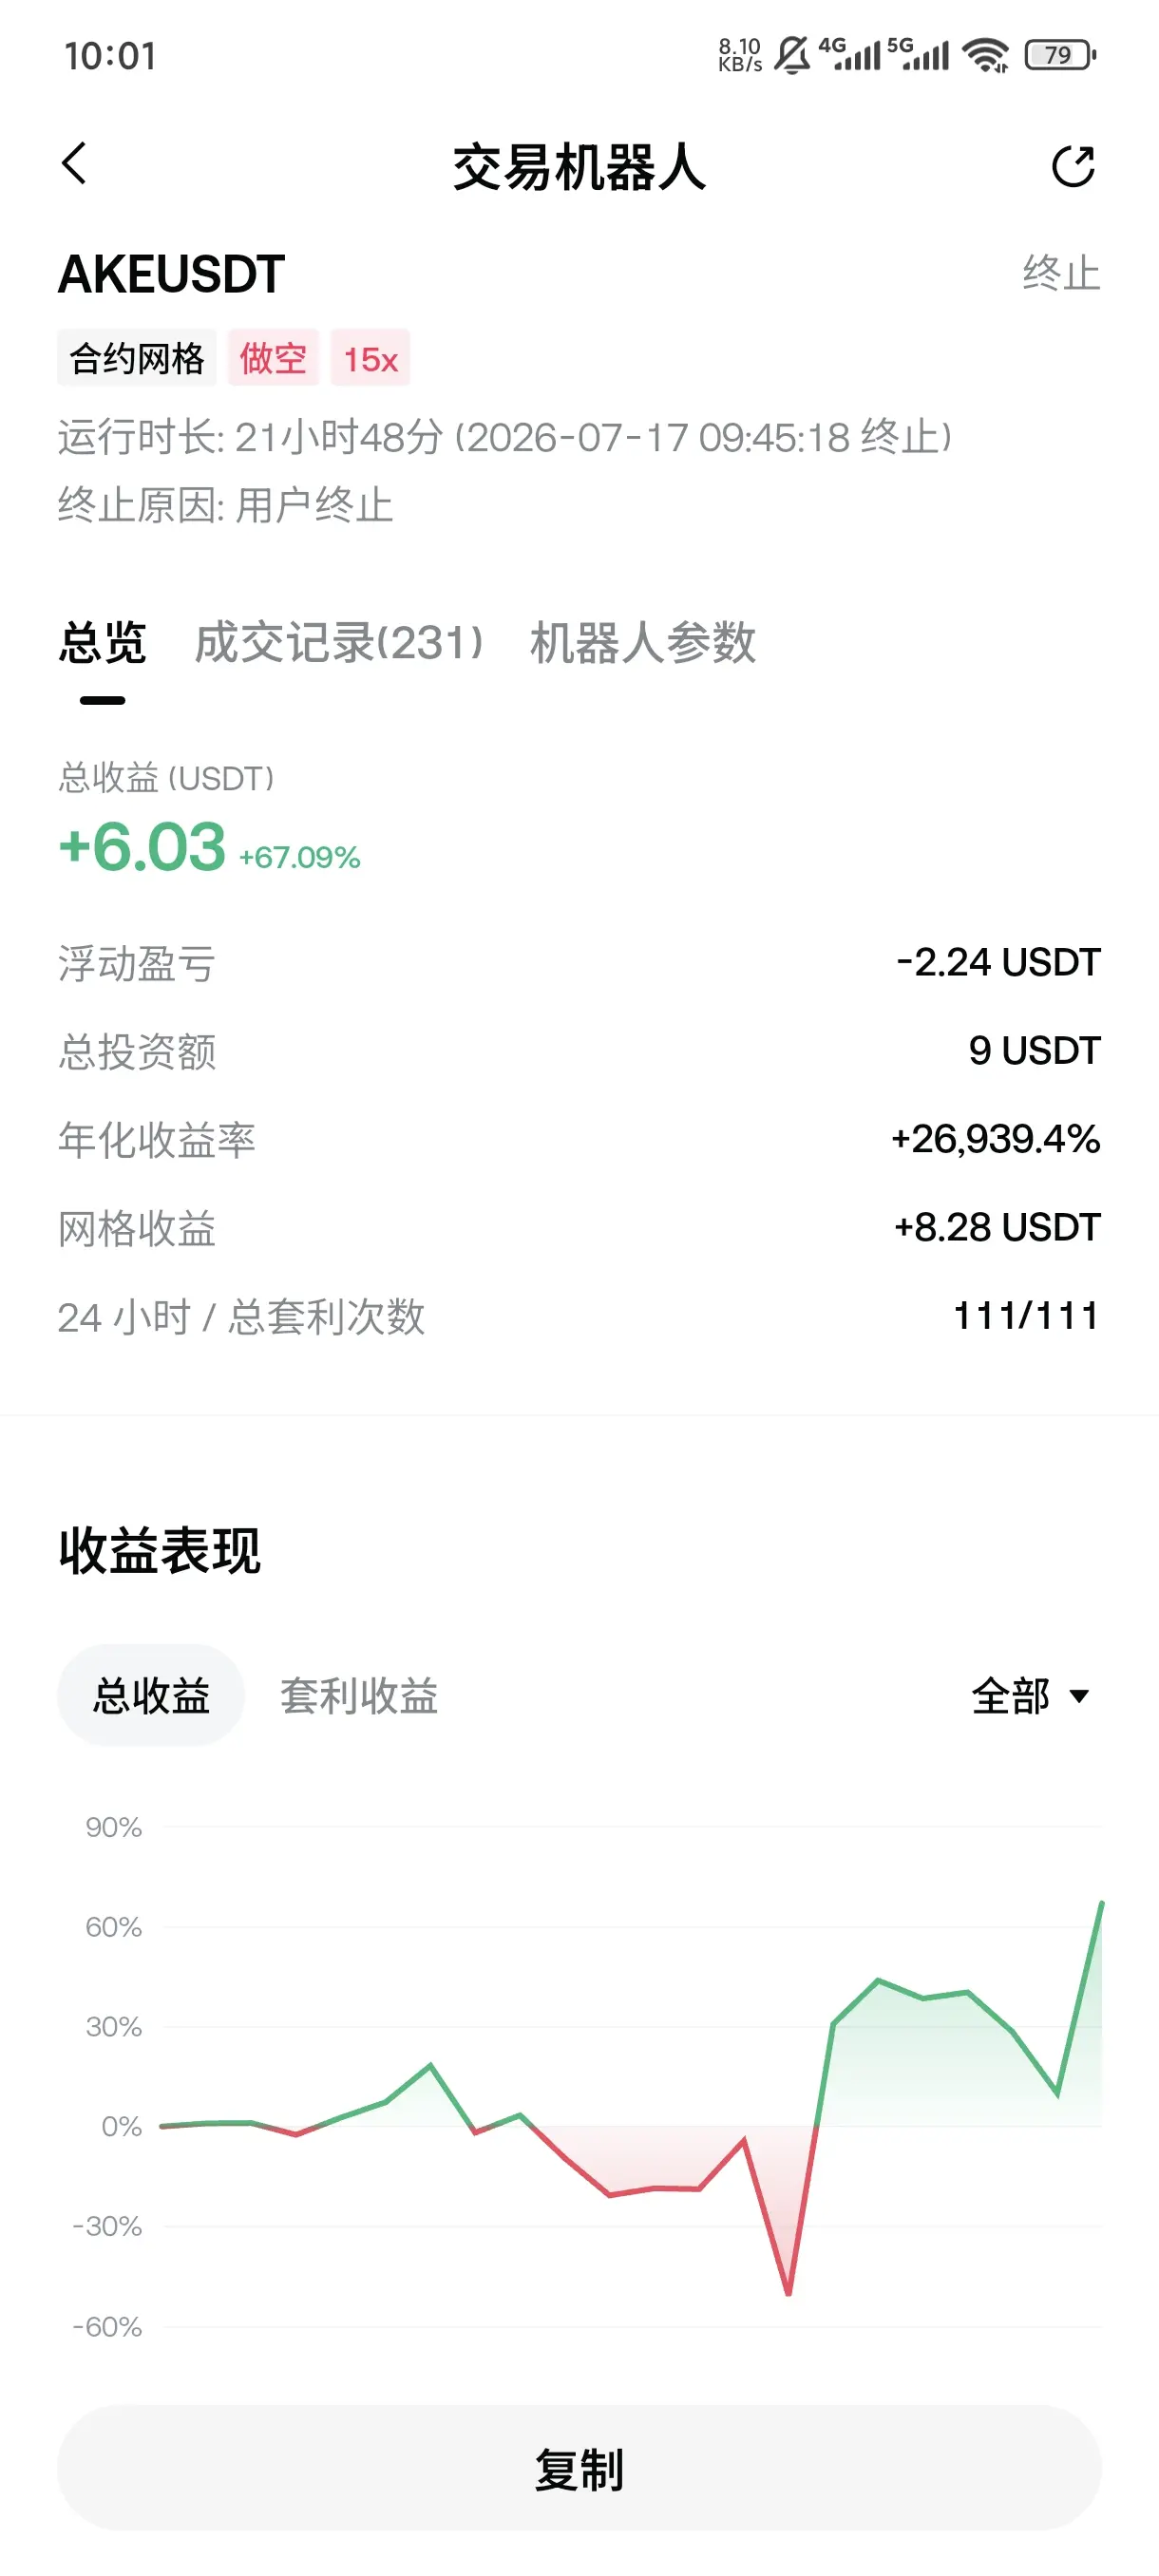
$AKE Take profit first, then reopen a grid and keep scraping the ground. If this coin’s exchange holdings haven’t dropped significantly, then it’s still going to pull shenanigans.
AKE15.78%
View Original
post-image
post-image
  • Reward
  • 6
  • Repost
  • Share
OptimismOptimist:
Yes—before the position is reduced, it’s basically the market maker playing; scraping the “floor” with a grid is more reliable than just holding it tight.
View More
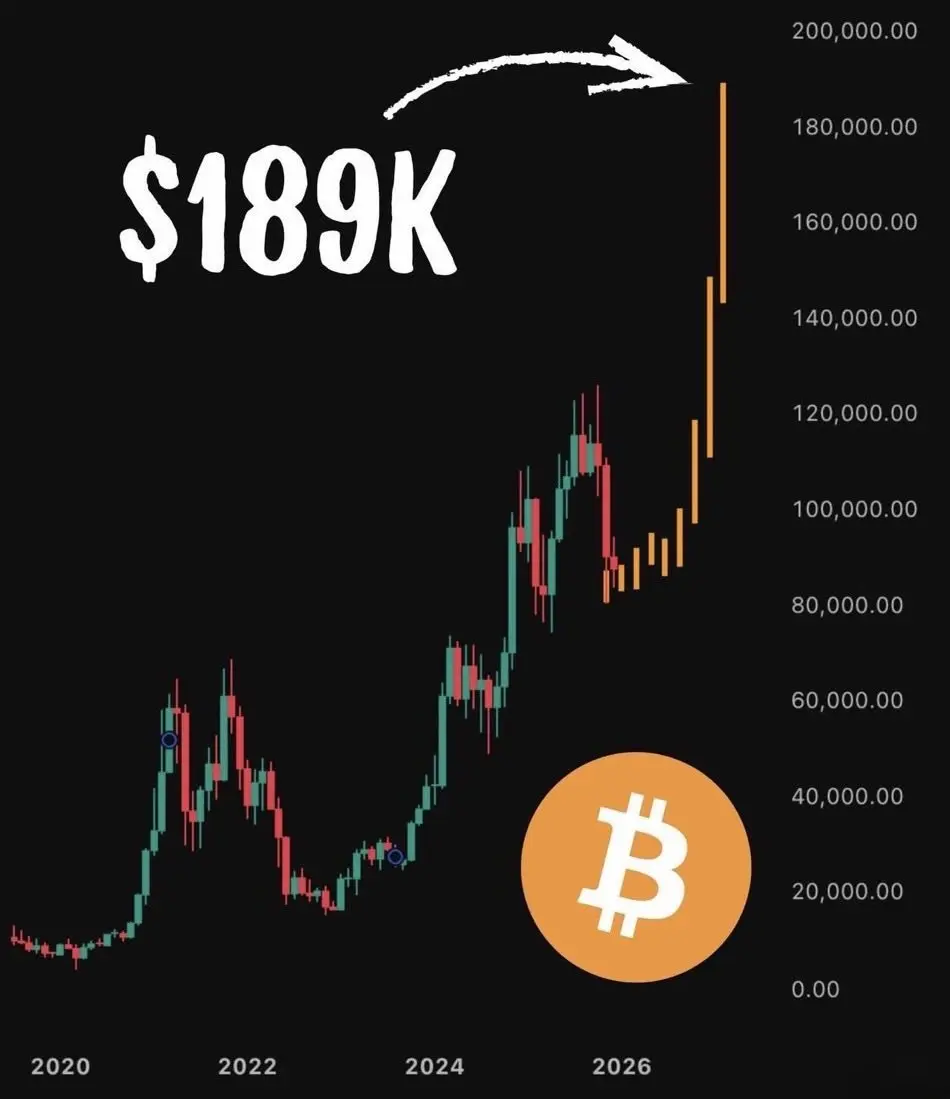
🇺🇸 $2.2 TRILLION BANKING GIANT CITI BANK SAID BITCOIN IS STILL GOING TO $189,000 IN 2026
TIGHTEN YOUR SEATBELTS 🚀
BTC-1.46%
post-image
  • Reward
  • Comment
  • Repost
  • Share
JUST IN: White House says Iran remains in talks with the U.S. amid ongoing strikes tied to alleged MoU violations. If talks progress, potential policy shifts could influence regional risk sentiment and sanctions dynamics. $ETH ? $BTC ?
ETH-3.44%
BTC-1.46%
post-image
  • Reward
  • Comment
  • Repost
  • Share
Ten-minute high-win-rate strategy for the event,
View Original
  • Reward
  • Comment
  • Repost
  • Share
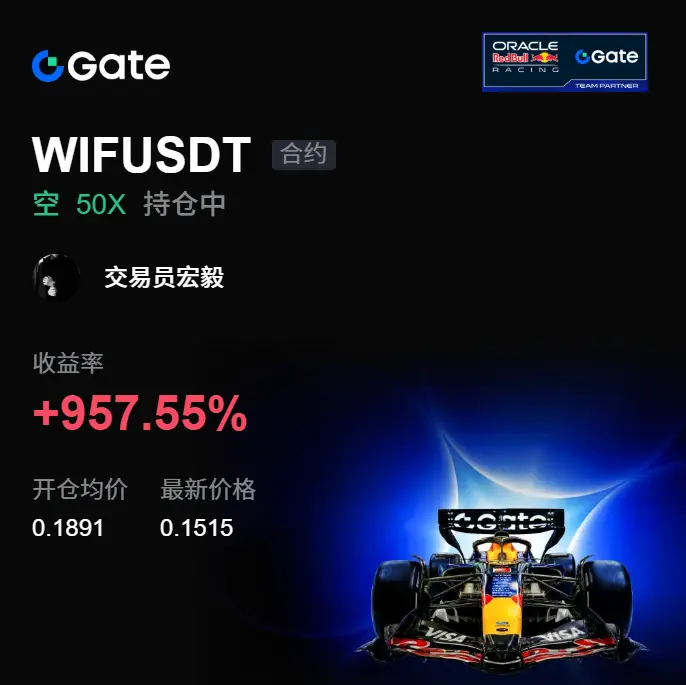
This sell-off just now was very direct—it didn’t give anyone who hesitated much time to react. The longer it went sideways before $WIF , the more cautious I became, because it wasn’t healthy accumulation; it was a high-level rebound getting increasingly dull. The overhead pressure still hadn’t been absorbed—the “hard撑” (stubborn holding up) feel on the chart was very obvious.
At the time, I was watching the details of WIF around 0.1891. Every time the price tried to push upward, it was quickly pushed back, which shows that the bulls hadn’t truly taken over the pace. A lot of people are afraid
WIF-0.26%
BTC-1.49%
ETH-3.44%
View Original
post-image
  • Reward
  • Comment
  • Repost
  • Share
Goldman Sachs warns of a storage market shift! NAND replacing DRAM for cost reduction could reshape
gate liveLIVE
2,214
  • Reward
  • Comment
  • Repost
  • Share
I don’t want to hear anything anymore about Micron, semiconductors, large language models, LLMs, Samsung, SK hynix, ChatGPT, programming, Agent, Codex, ClaudeCode, CUDA, GPU, H100, B200, TSMC, ASML, NVIDIA, Jensen Huang, OpenAl, Anthropic, Gemini, Grok, DeepSeek, Qwen, Transformer, Prompt, Token, Inference, APl, Copilot. Cursor, Docker, Kubernetes, Linux, cloud computing, computing power, A100, servers, data centers, wafers, EUV, HBM, DDR5, quant trading, distillation, multimodal, Scaling Law, AI financing, Benchmark, Stable Diffusion, Midjourney, AI video generation, autonomous driving, robot
TSM-2.32%
ASML-2.40%
NVDA-2.36%
SPCX-3.14%
NAS100-0.70%
View Original
post-image
  • Reward
  • 1
  • Repost
  • Share
WeiLan:
Well said.
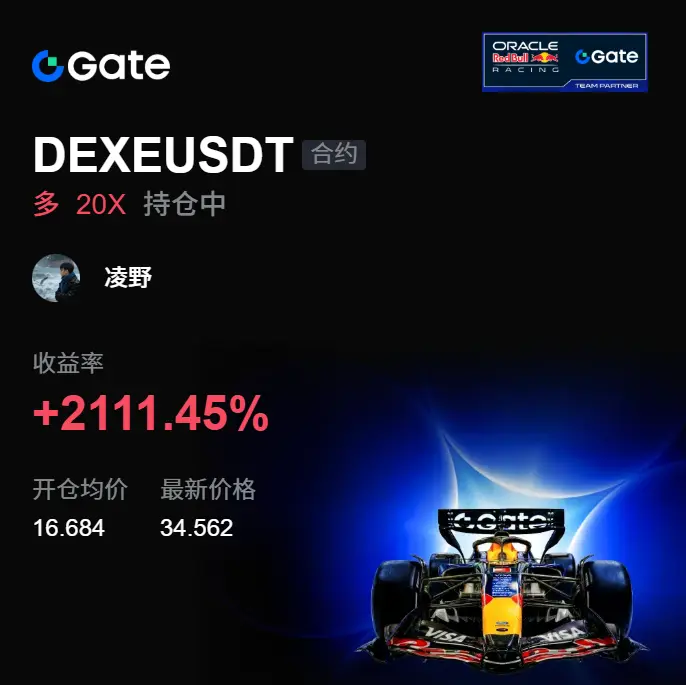
Woke up and straightened up mentally! 📈 A few days ago, in the afternoon session the chart was still moving sideways, grinding, and it frustrated a lot of people. But $DEXE somehow had this quiet-and-silent kind of trend—and in the end it delivered a surprise.

When the market was grinding the base during the session, I was watching that the key levels hadn’t broken. The buy side started to strengthen, and there was a feeling that money was quietly moving in. So at the time, I advised to go long around 16.684—no rush to chase. As long as it holds, you execute. 👀📌

And now 34.562 is alrea
DEXE-5.08%
BTC-1.49%
ETH-3.44%
View Original
post-image
  • Reward
  • Comment
  • Repost
  • Share
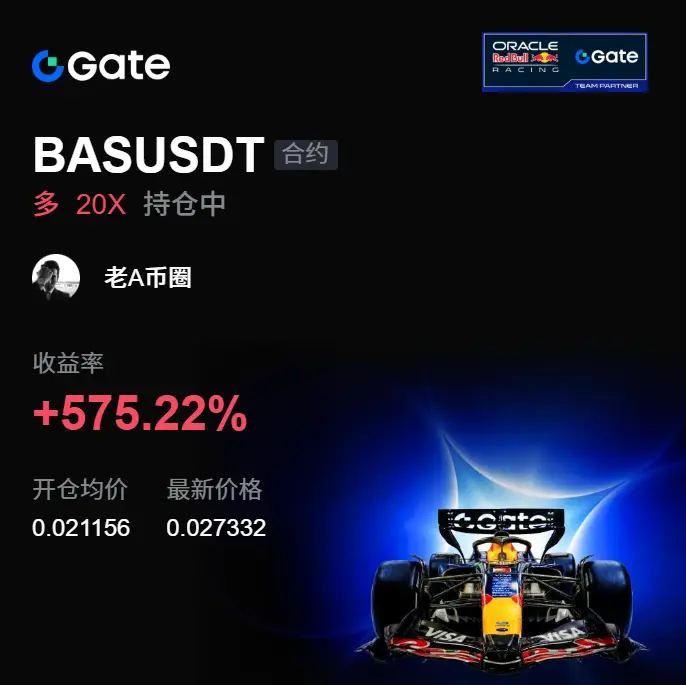
No more talk—this one is purely luck, I don’t dare get cocky. A few days ago, my last look before sleep at $BAS —the price was still ranging, and I watched it around 0.021156. The key level hadn’t broken, and the sell pressure also started to ease. Back then, I said you could take a light position and go long—don’t chase it, just wait for it to show its stance.
Then this morning when I opened the chart, it directly delivered the answer 🔥. From 0.021156 to now 0.027404, unrealized profit +575.22%—this bite of meat is delicious.
That’s the rhythm.
Lock in profits when you should.
Over here, I fi
BAS4.22%
BTC-1.49%
ETH-3.44%
View Original
post-image
  • Reward
  • Comment
  • Repost
  • Share
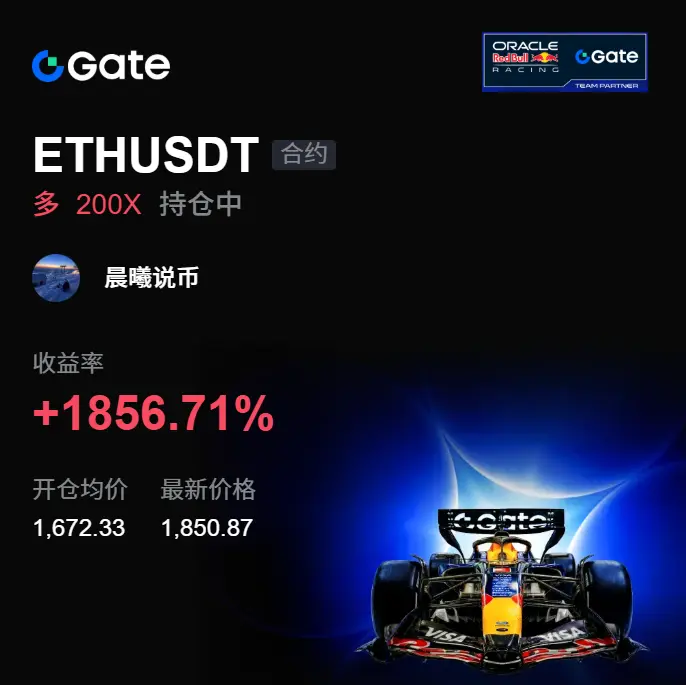
What really caught my attention isn’t a single sudden K-line spike, but the fact that in the previous pullbacks, the key levels were not broken through. These details are very easy to overlook.

My judgment is that the rhythm has been gradually shifting upward, so this time, I didn’t rush to manage the position around 1672.33. After $ETH moved to 1850.92, the price response started to become more obvious.

Currently, the return rate shows +1856.71%. This trade is essentially taking advantage of some upside space in line with the upward momentum. There was some hesitation along the way, but
ETH-3.44%
BTC-1.49%
SOL-2.07%
View Original
post-image
  • Reward
  • Comment
  • Repost
  • Share
When it was $3,000, they said I was running a scam
When it was $20,000, they told me to sell quickly
When it was $120,000, they asked how I bought it
Now Bitcoin is $60,000—guess what they say?
No matter whether you believe it or not, time will prove Bitcoin’s value!
BTC-1.46%
View Original
post-image
  • Reward
  • Comment
  • Repost
  • Share
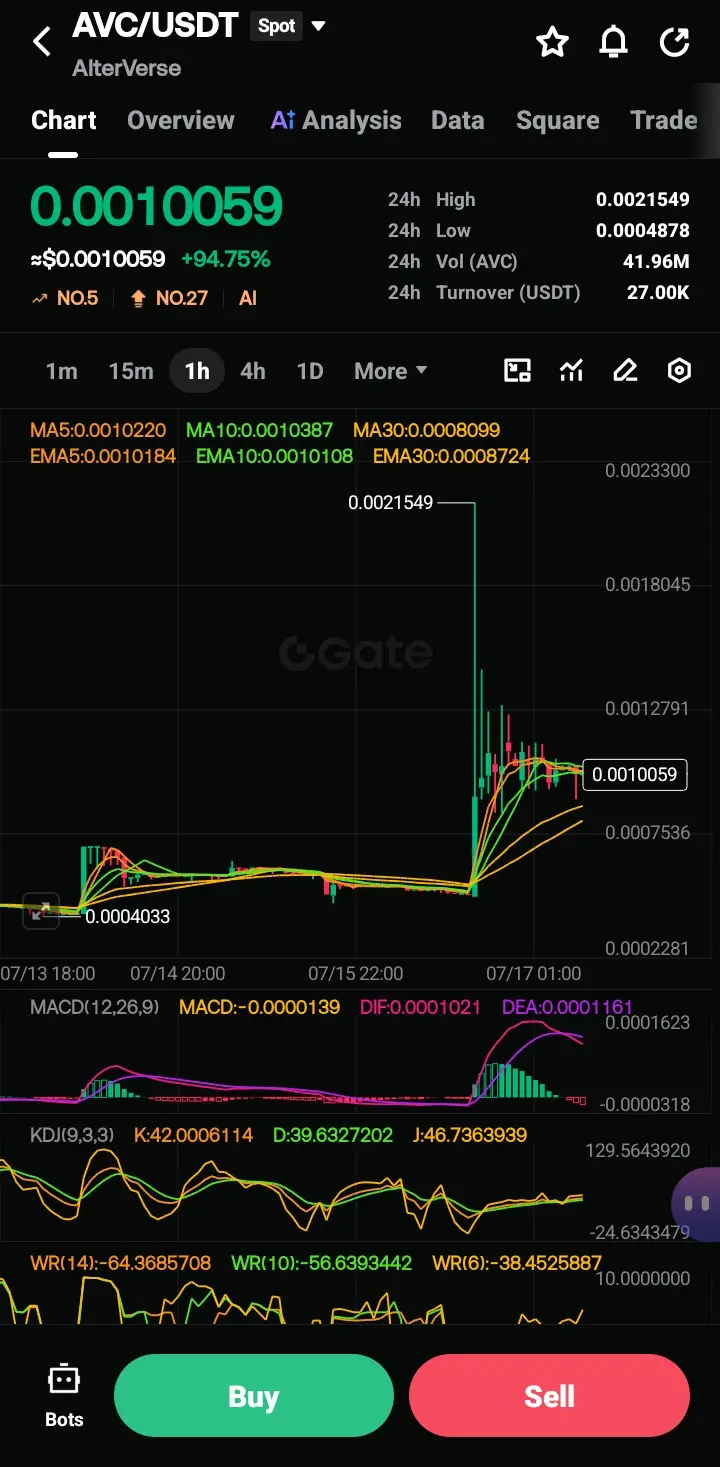
AVC/USDT (AlterVerse) — K-Line Analysis & Trade Plan
$AVC #SummerCreationCamp
📊 Candlestick Pattern Breakdown
Phase 1 — Accumulation (07/13–07/15)
Price flatlined near 0.0004033 with minimal volume
Very tight, compressed candles = classic pre-pump base
Phase 2 — Parabolic Spike (07/15–07/16)
Explosive vertical candle to 0.0021549 (+340% from base)
Classic single-candle pump with likely thin liquidity
Phase 3 — Current: Volatile Pullback & Consolidation
Price collapsed back to ~0.0007–0.0008 then bounced
Now at 0.0010059, forming choppy indecision candles
Long wicks on recent bars = buyer/s
AVC95.01%
post-image
  • Reward
  • Comment
  • Repost
  • Share
Stock trading is actually quite simple—of course, this doesn’t mean I make a lot of money. Every month, many stocks will see month-to-month gains over 100% on their monthly chart. At the beginning of the month, you can filter for stocks with monthly gains over 30%, and then look for stocks that are bullish on the monthly chart. A pullback is a buying opportunity.
View Original
post-image
  • Reward
  • Comment
  • Repost
  • Share
These two girls are pretty good at showing off while riding their bikes, and they probably get along really well too. Even if they fall, they still have to hold each other close—truly impressive…
View Original
  • Reward
  • Comment
  • Repost
  • Share
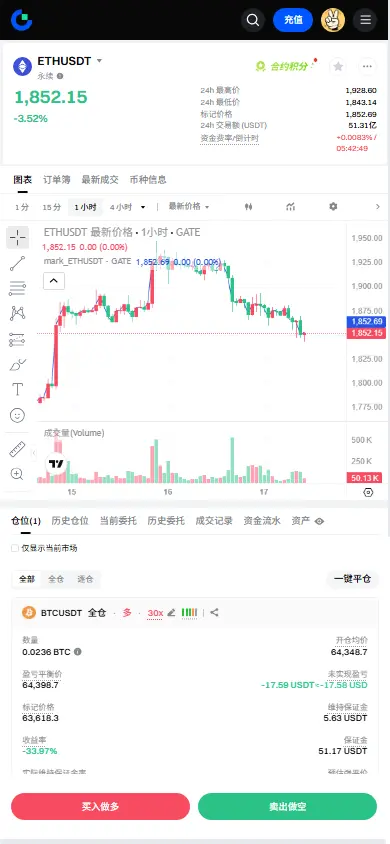
$ETH Signal | Short-term bearishness continues; 4H MACD expansion accelerates
$ETH 4H MACD histogram -6.8 keeps widening, and bearish momentum shows no signs of exhaustion. There are four consecutive bearish candles on the 1H chart; the low around 1842 has been tested multiple times, and buy-side limit orders appear thin. Depth imbalance is 82.11%, with selling pressure dominating. The current price is near the lower band of the 1H Bollinger Bands, but there is no intention to bounce; market sentiment remains bearish.
🎯Direction: short
⚡Entry/Orders: 1846.4739 - 1852.0300
🛑Stop-loss: 1870.55
ETH-3.44%
View Original
post-image
  • Reward
  • Comment
  • Repost
  • Share
Load More

Join 40 M users in our growing community

⚡️ Join 40 M users in the crypto craze discussion
💬 Engage with your favorite top creators
👍 See what interests you
  • Pinned