Share crypto content and earn up to 60% commissions through content mining.
placeholder
gatefun
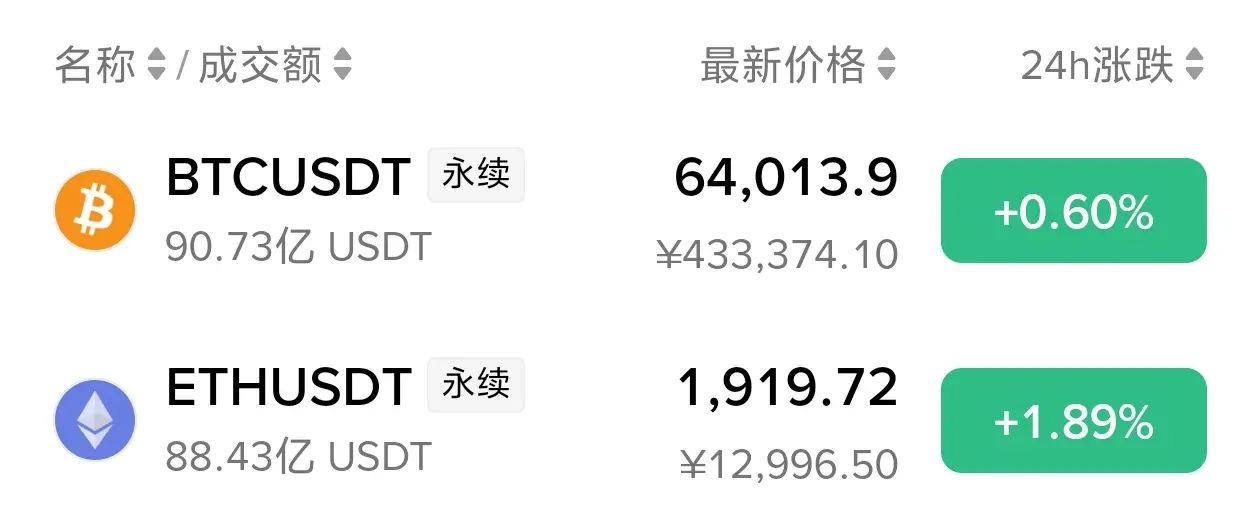
At the daily level, wedge momentum/energy still dominates. The price closes with a lower shadow, forming a doji-like star and a small bullish candle. Below, short-term follow-through from buy orders caused the pullback, but it didn’t sustain; however, the bullish candle body is weak—only a slight stabilization after the decline, without reversing the larger wedge structure.
On the four-hour cycle, the wedge sell pressure is contracting; price is oscillating upward. This is a technical rebound and repair, not a bullish reversal, and it faces resistance above. On the hourly level, wedge power ma
BTC0.94%
ETH1.70%
View Original
post-image
  • Reward
  • Comment
  • Repost
  • Share
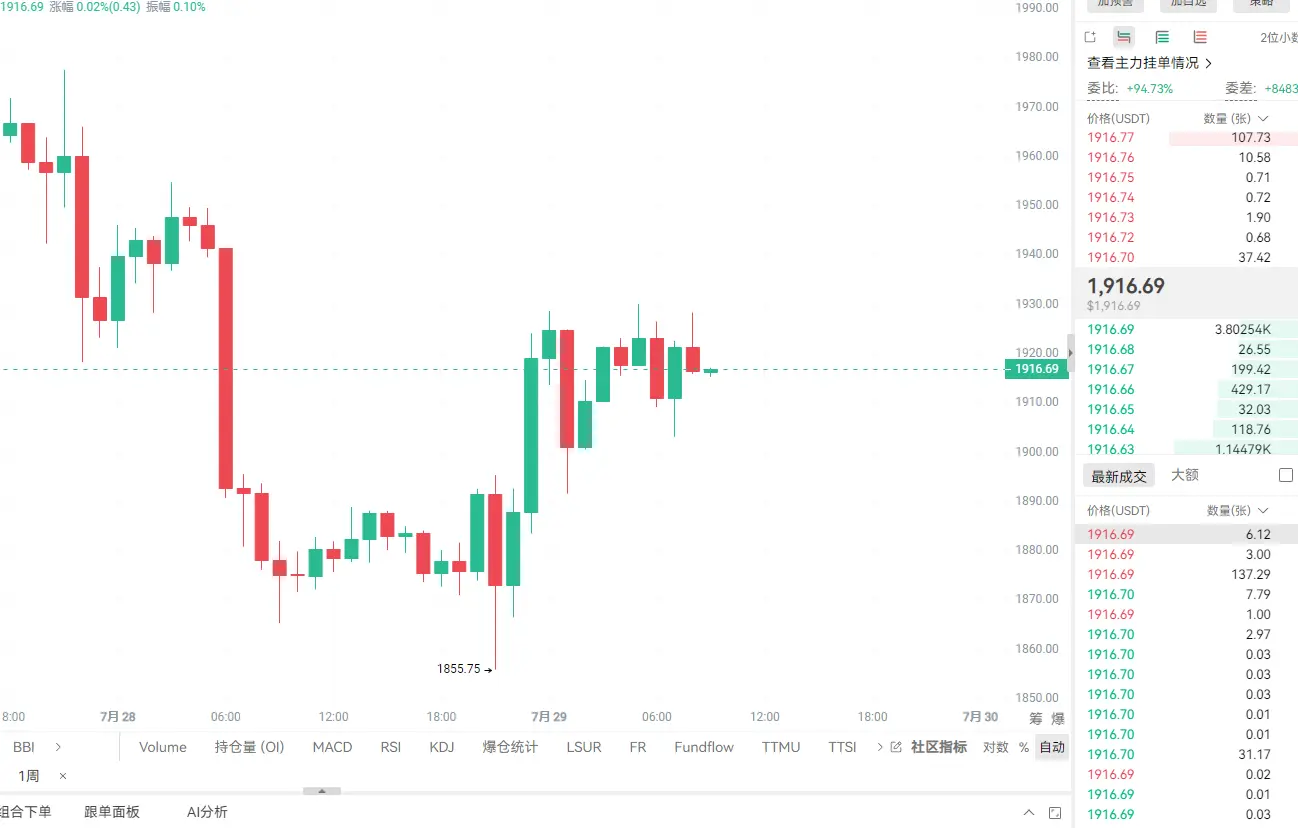
ETH is currently around 1,916 u. Today it’s up 1.3%. After yesterday’s failed attempt to spike higher, it didn’t keep sliding all the way down. Today it has once again reclaimed the level above 1,900.
On a weekly basis it’s basically flat—down just 0.7%. The one-month gain is still expanding, now up to 22%. The strength on the monthly chart still hasn’t been genuinely broken. The 24-hour high is 1,925 and the low is 1,861. Today saw a drop first and then a rise, and it has partially made back yesterday’s losses.
In the earlier move, it touched 1,974 and then got slammed back down. This time, b
ETH1.70%
View Original
post-image
  • Reward
  • Comment
  • Repost
  • Share
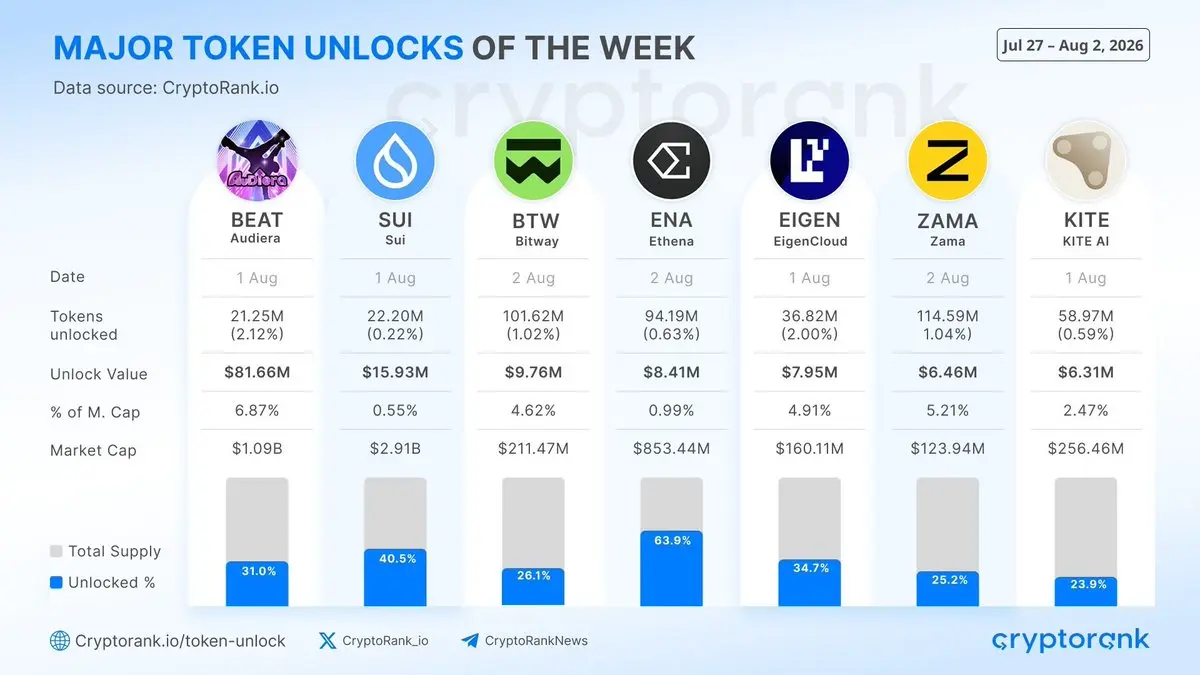
Major token unlocks this week (July 27 – Aug 2):
🔹 BEAT: $81.66M (6.87% of mcap) Aug 1
🔹 SUI: $15.93M (0.55%)
🔹 BTW: $9.76M (4.62%)
🔹 ENA: $8.41M (0.99%)
🔹 EIGEN: $7.95M (4.91%)
🔹 ZAMA: $6.46M (5.21%)
🔹 KITE: $6.31M (2.47%)
BEAT22.31%
SUI1.59%
ENA-0.80%
EIGEN-4.61%
ZAMA1.65%
post-image
  • Reward
  • Comment
  • Repost
  • Share
JUST IN: South Korea eyes a comprehensive review of capital markets, including leveraged ETFs, as AI investment debates and semiconductor supply/demand dynamics drive market introspection. $KOSPI
post-image
  • Reward
  • Comment
  • Repost
  • Share
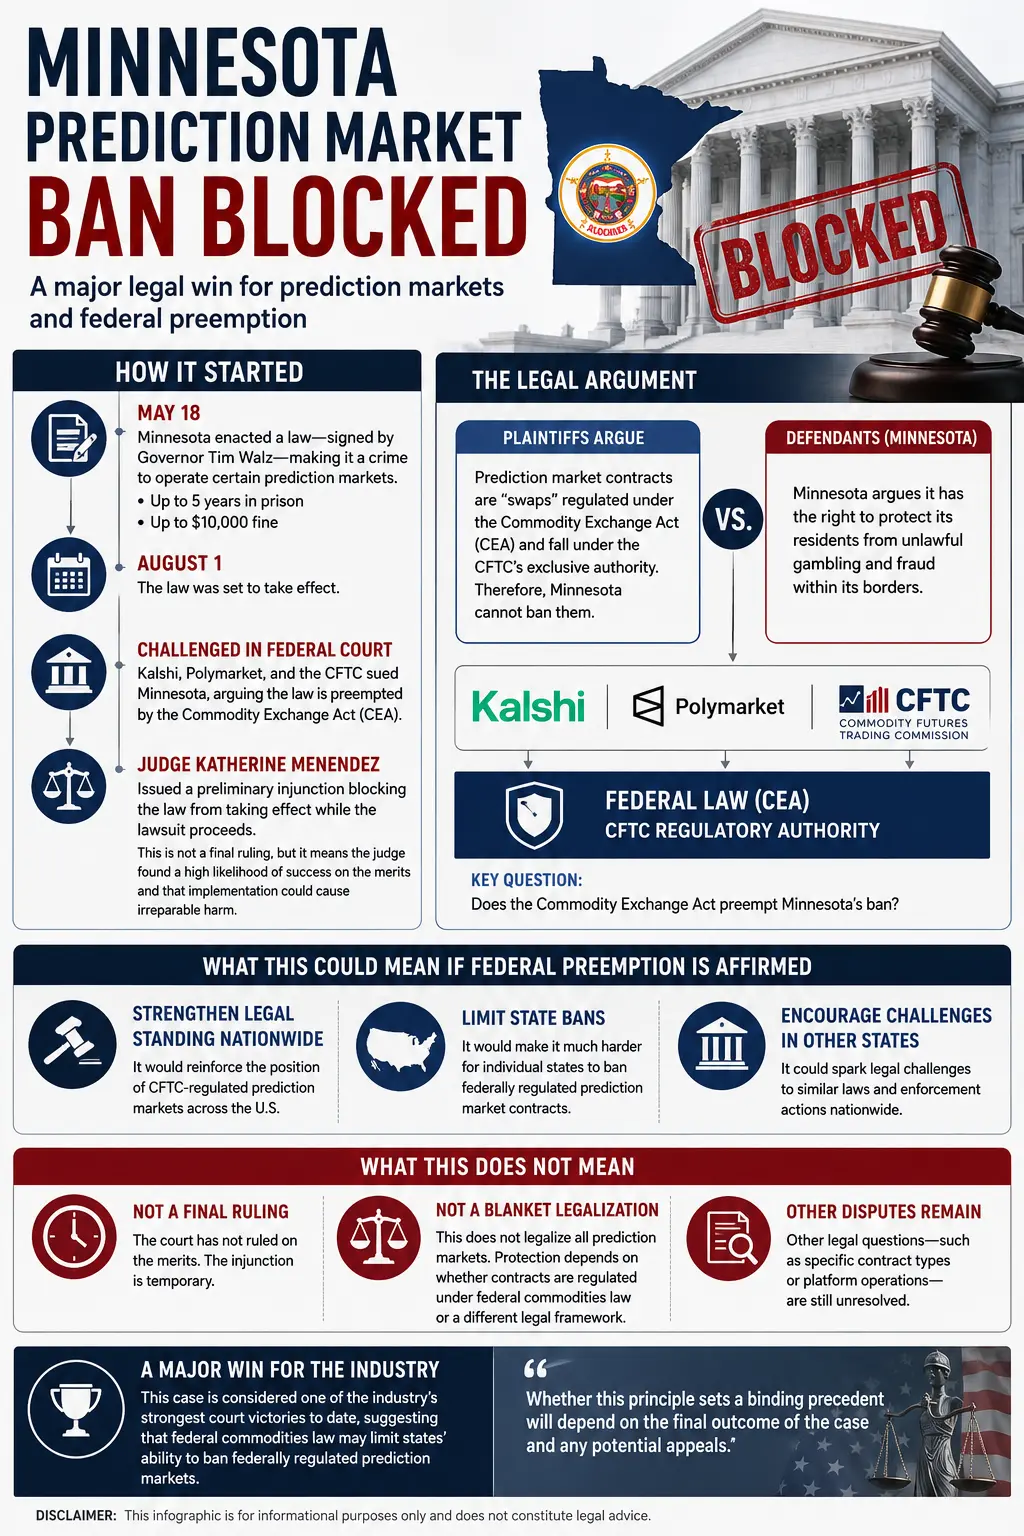
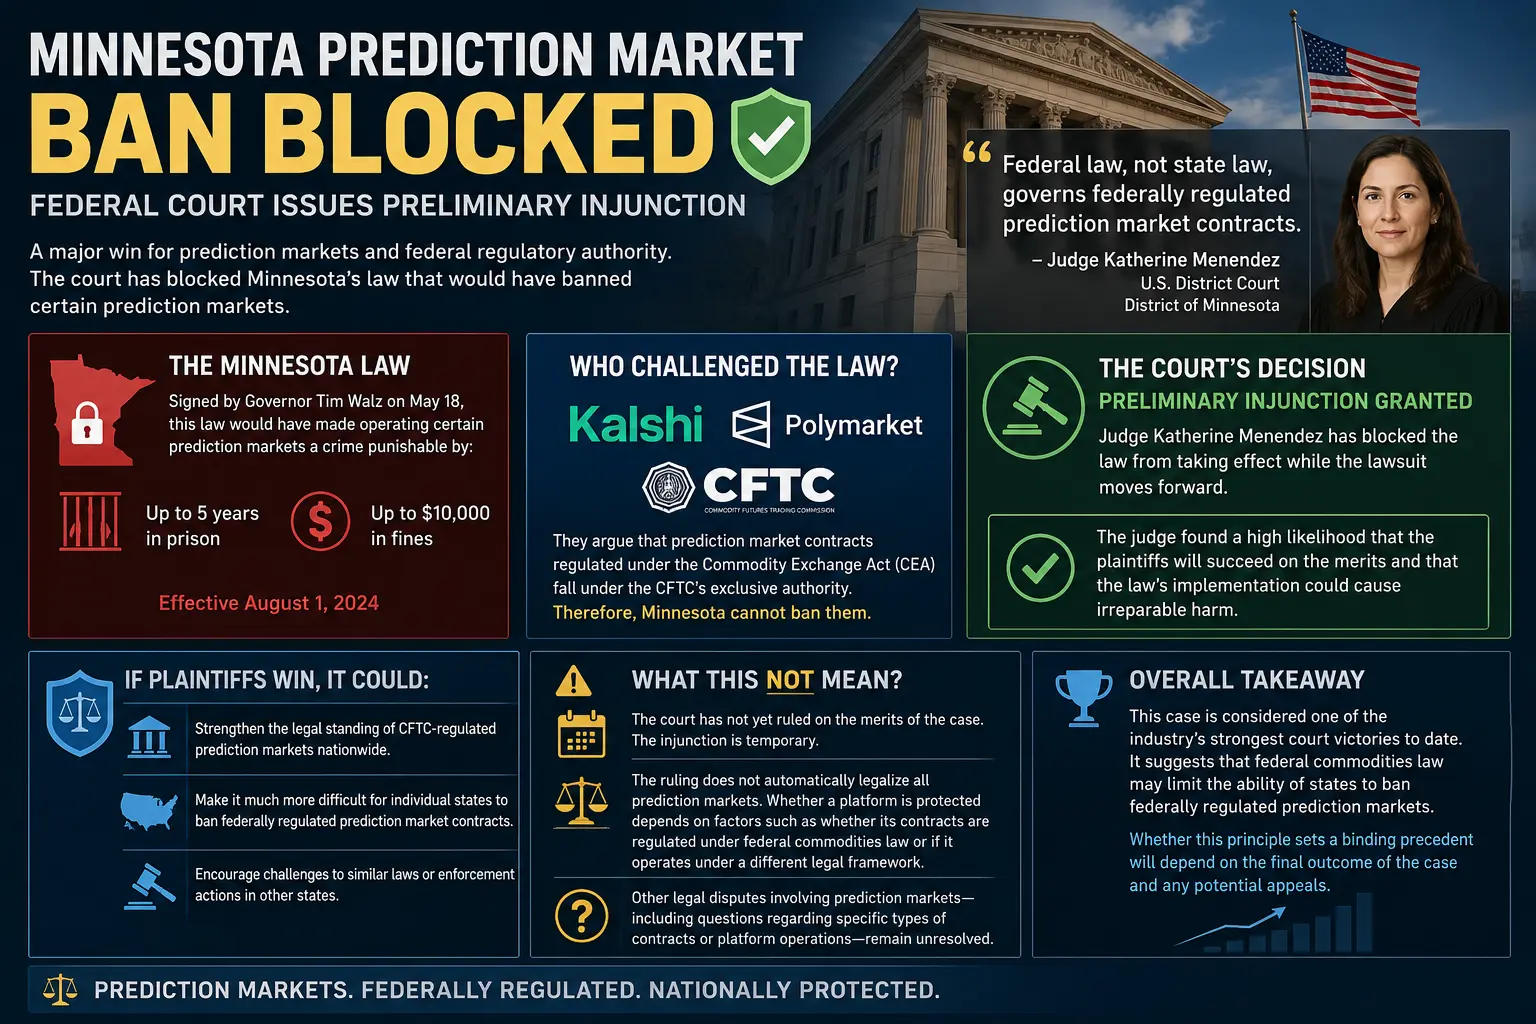
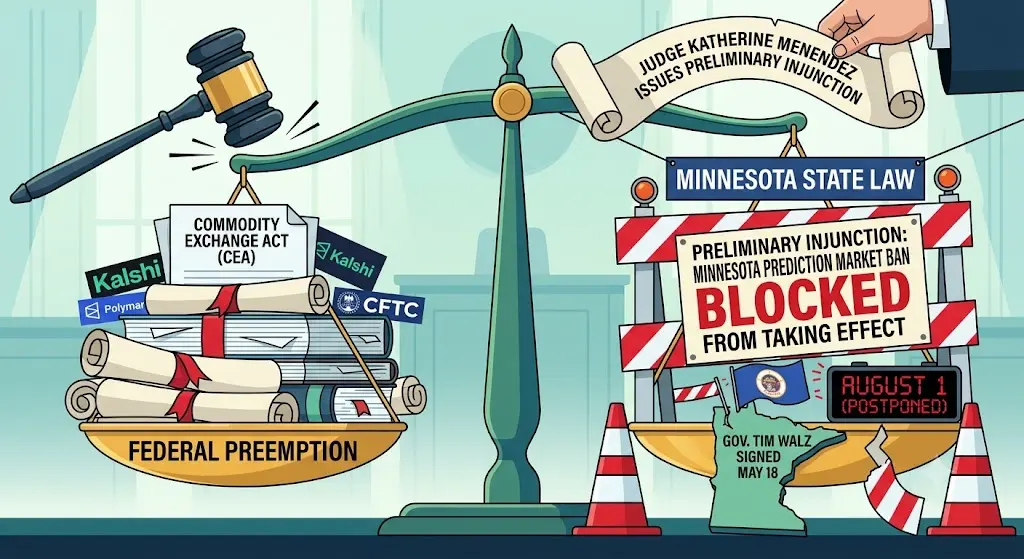
#MinnesotaPredictionMarketBanBlocked
This is a significant development for U.S. prediction markets, as it centers on the question of whether federal law preempts conflicting state law.
Minnesota enacted a law—signed by Governor Tim Walz on May 18—that would have made operating certain prediction markets a crime punishable by up to five years in prison and a fine of up to $10,000, effective August 1.
Kalshi, Polymarket, and the Commodity Futures Trading Commission (CFTC) challenged the law in federal court.
They argued that federally regulated prediction market contracts fall under the Commodi
KALSHI-14.45%
POLYMARKET-16.21%
post-image
post-image
post-image
  • Reward
  • 5
  • Repost
  • Share
ShanDingMediaSiyu:
Get on board now! 🚗
View More
JUST IN: Multicoin unstakes 1.97M HYPE (~$108M), exiting stake after 7-day unbonding; a portion moved to Coinbase Prime. $HYPE has fallen about 10% over the past week.
HYPE-3.21%
post-image
  • Reward
  • Comment
  • Repost
  • Share
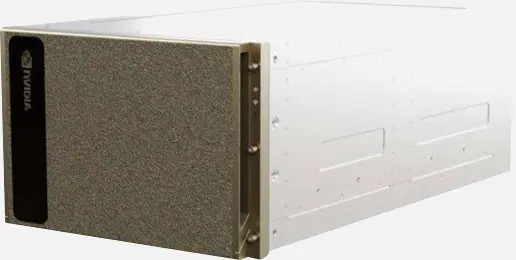
NVIDIA’s AI Vision Points to a Larger Semiconductor Opportunity
gate liveLIVE
1,048
  • Reward
  • Comment
  • Repost
  • Share
JUST IN: Goldman Sachs Japan says the recent AI chip sell-off is a buying opportunity as Intel hikes capex by ~$3B, boosting outlook for wafer equipment suppliers. $INTC $JPN AI semis
GS-1.19%
INTC-5.88%
post-image
  • Reward
  • Comment
  • Repost
  • Share
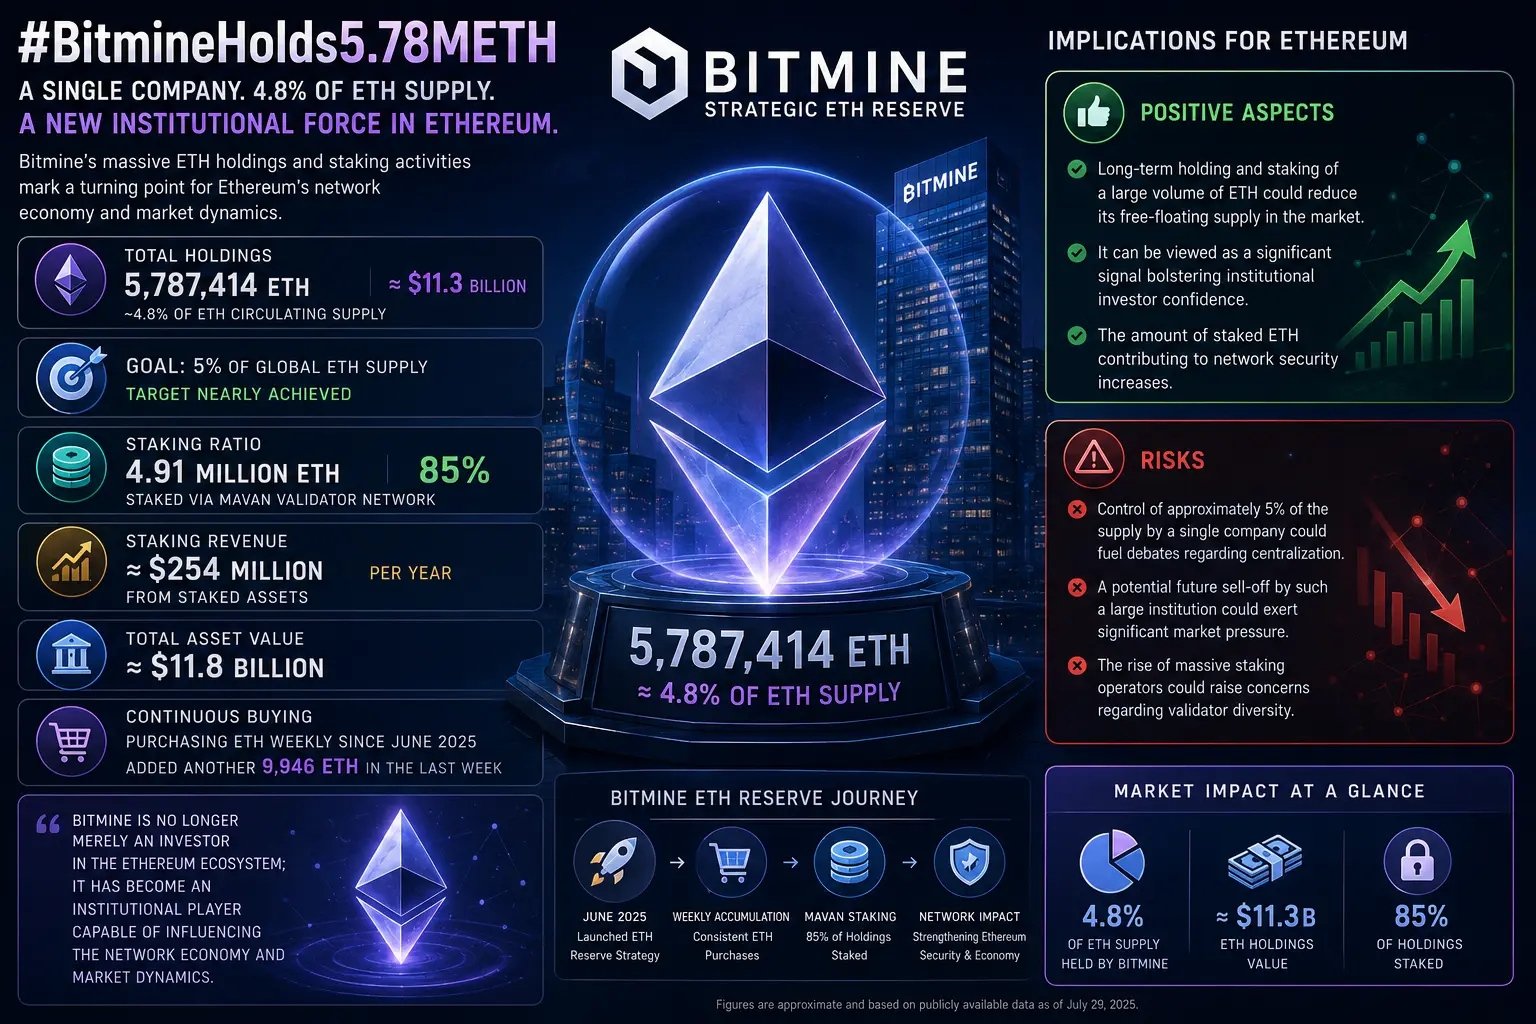
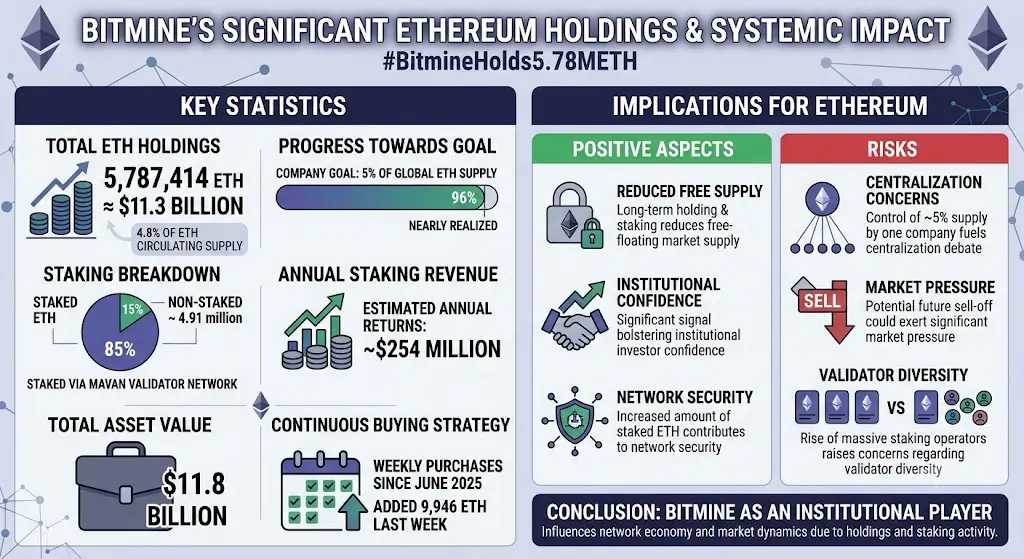
#BitmineHolds5.78METH
This development is noteworthy for Ethereum because the amount of ETH held by a single public company has begun to take on systemic significance.
Key highlights:
Total holdings: Bitmine holds 5,787,414 ETH. Valued at approximately $11.3 billion, this amount represents about 4.8% of Ethereum's circulating supply.
Close to the target: The company's stated goal of owning 5% of the global ETH supply is nearly realized.
Staking ratio: Approximately 4.91 million ETH (85% of the total) is staked via the MAVAN validator network.
Staking revenue: These staked assets reportedly ge
ETH1.70%
post-image
post-image
  • Reward
  • 7
  • Repost
  • Share
ThisIsTranslateContent::
Just go for it 👊
View More
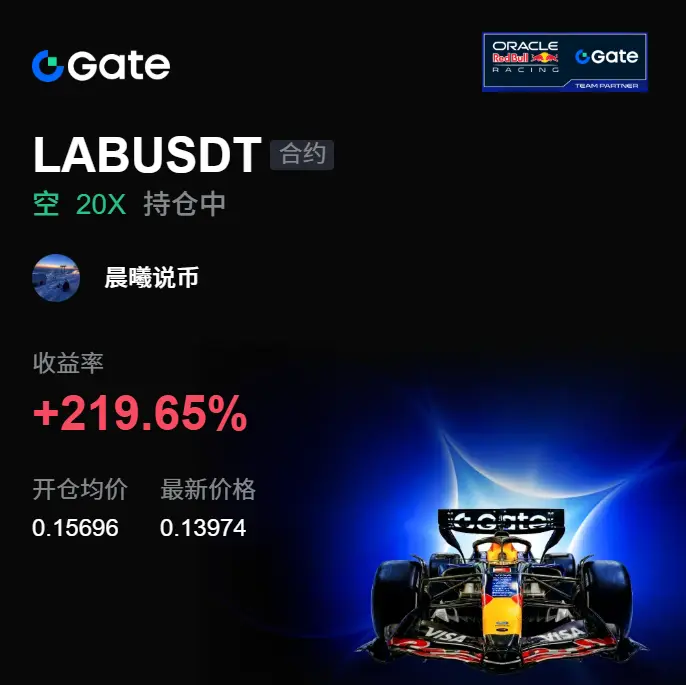
No hype, no bias—after these results came out, I went back and reread everything myself. The chart kept repeatedly battering at high levels, but every time it surged up, there was a lack of follow-through. What really made me commit, though, was that the key level above never got effectively digested.
Shorts were initiated around 0.15696. After the price pulled back to 0.1396, the pace clearly shifted downward, and the +218.02% feedback also shows this call didn’t deviate. During the process, I didn’t rush to chase—I was mainly waiting for the rebound strength to be confirmed.
The more the mar
BTC0.88%
ETH1.66%
View Original
post-image
  • Reward
  • Comment
  • Repost
  • Share
View Original
post-image
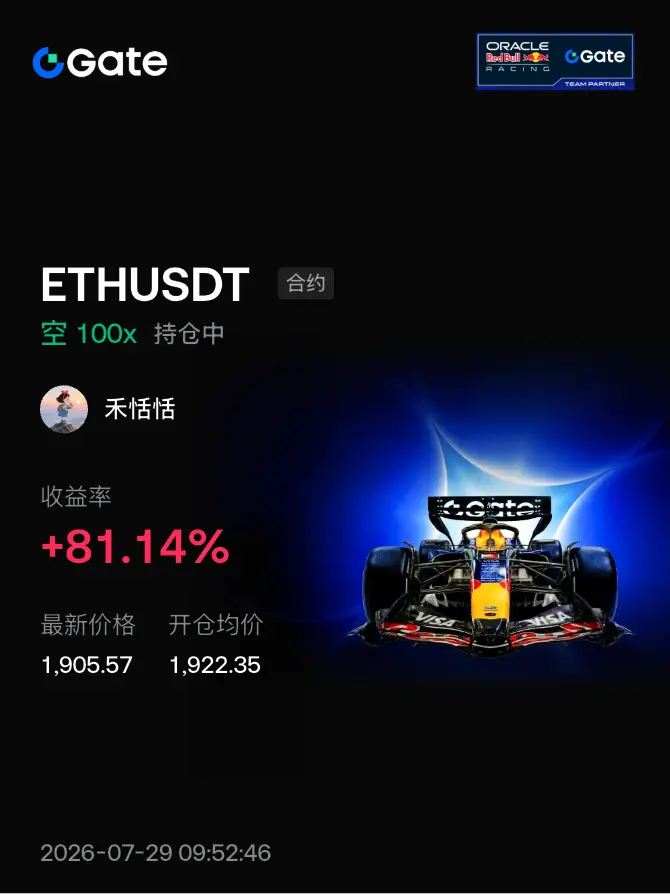
ETH_USDT
Short
Cross 100X
Return %
+81.14%
Entry Price(USDT)
1,922.35
Mark Price(USDT)
1,905.57
  • Reward
  • Comment
  • Repost
  • Share
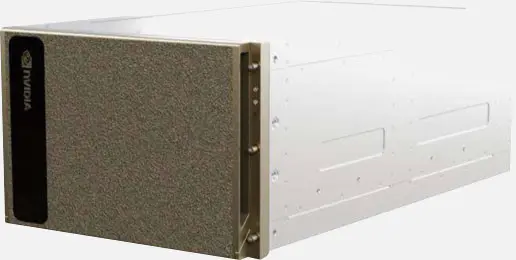
costed out hw to run kimi-k2 locally today
actually feasible from a residence
SOVEREIGN INFERENCE
post-image
post-image
  • Reward
  • Comment
  • Repost
  • Share
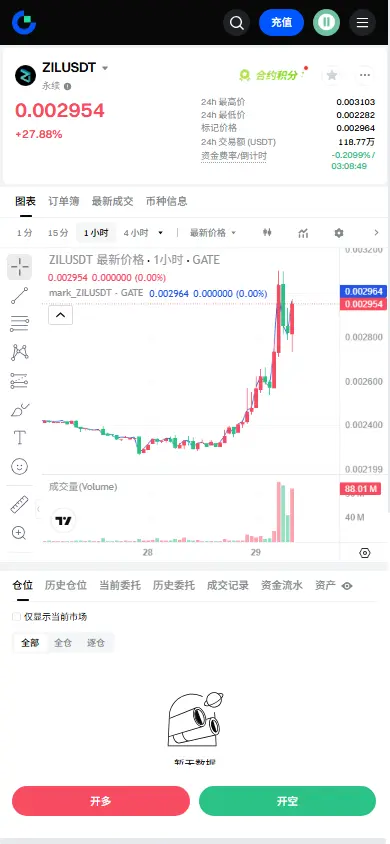
$ZIL Signal】Go long | Negative funding rate squeeze + 1H momentum continuation
$ZIL Funding rate -1.1492%. Shorts are clustered, pushing their average holding cost high. OI is stable, but buy-side depth remains dominant (Bid/Ask Ratio 1.08). On 1H, the MACD long volume histogram is shrinking, but price is still above EMA20 by 0.00288. On 4H, the upper band of the Bollinger band at 0.0028 has been broken by the real body; after the volume peaked at 12.5B, no clear selling pressure has emerged. RSI on 4H is 78.83—overbought, but not turning. There are signs of pullback support around 0.00286,
ZIL14.75%
USD10.02%
BTC0.94%
ETH1.70%
SOL0.13%
View Original
post-image
  • Reward
  • Comment
  • Repost
  • Share
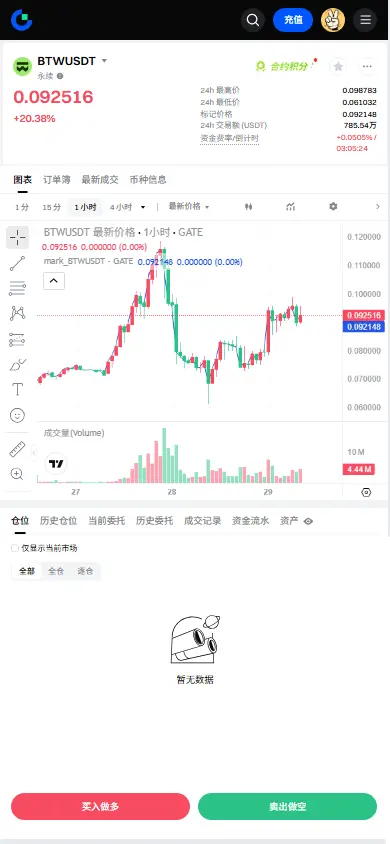
$BTW Signal】1H pullback confirmation + long-side positioning
$BTW 1H RSI 60.26, 4H Bollinger Band upper rail 0.1046, MACD histogram bars are expanding. Buy-side depth -33.47%, funding rate 0.0249% is nearing the extreme value. The long side is still in control; chasing higher prices in the short term requires caution, but a pullback to around the EMA20 is a reasonable buy-the-dip support zone.
🎯 Direction: Go long
⚡ Entry / pending orders: 0.0947449 - 0.0950300
🛑 Stop-loss: 0.0902785
🚀 Target 1: 0.1021573
🚀 Target 2: 0.1057209
🛡️ Trade management: After reaching Target 1, cut the positi
BTW28.05%
View Original
post-image
  • Reward
  • Comment
  • Repost
  • Share
Morning Best Market Breakdown
gate liveLIVE
1,915
live-coin
  • Reward
  • Comment
  • Repost
  • Share
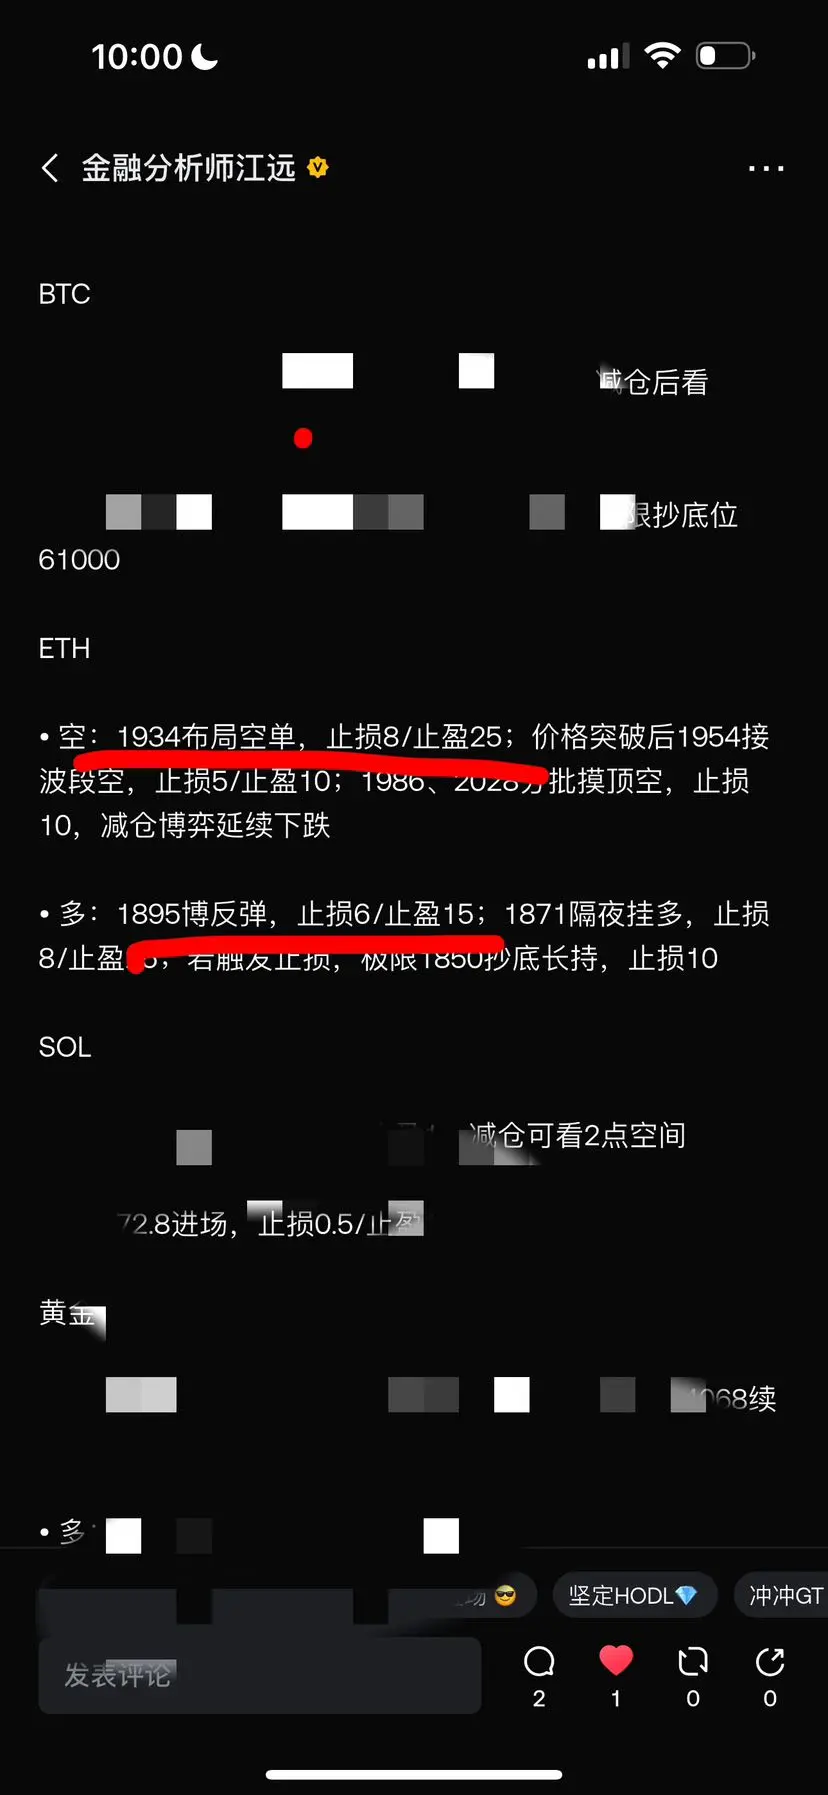
Night trading plan: Ethereum bulls and bears both profit! Seized a 70+ profit; ETH 1895 arrived successfully at the take-profit point at 1930, then flipped to short—currently up 30 points! Bulls and bears both profit! 🎉🎉🎉 Subscribe for members!
ETH1.66%
View Original
post-image
  • Reward
  • Comment
  • Repost
  • Share
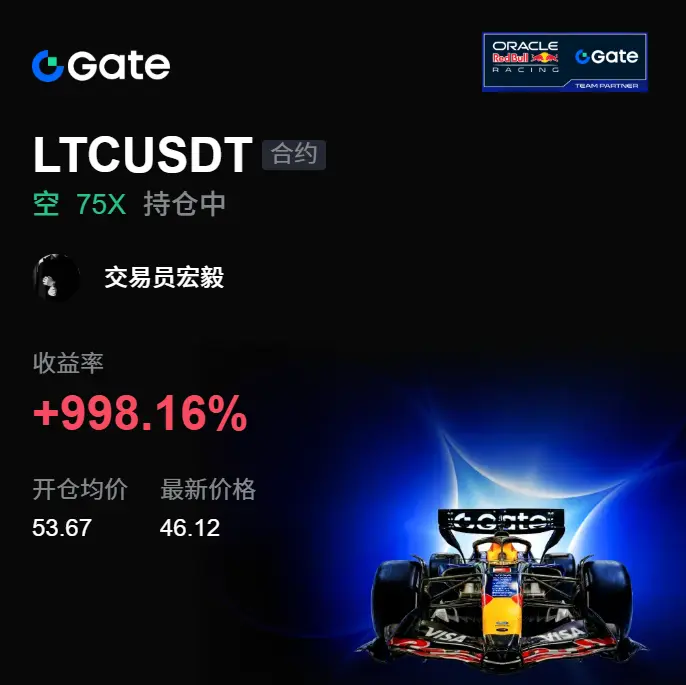
A few days ago, during the afternoon session, the market repeatedly whipsawed—watching it made people a bit sleepy. The real move was actually hidden at the high level. $LTC It didn’t look like there was any clear breakdown, but in reality, every rebound failed to follow through with volume. The moment sell orders came in, the price immediately lost the key level.

At the time, I wasn’t misled by the apparent sideways range. After re-checking LTC, I found that selling pressure above kept holding down consistently, and the lack of adequate bids became increasingly obvious. So around 53.67, I
LTC-0.33%
BTC0.88%
ETH1.66%
View Original
post-image
  • Reward
  • Comment
  • Repost
  • Share
Only 300 and you already hit a bottleneck? Is there anyone here who can help an old friend break through?
View Original
post-image
  • Reward
  • Comment
  • Repost
  • Share
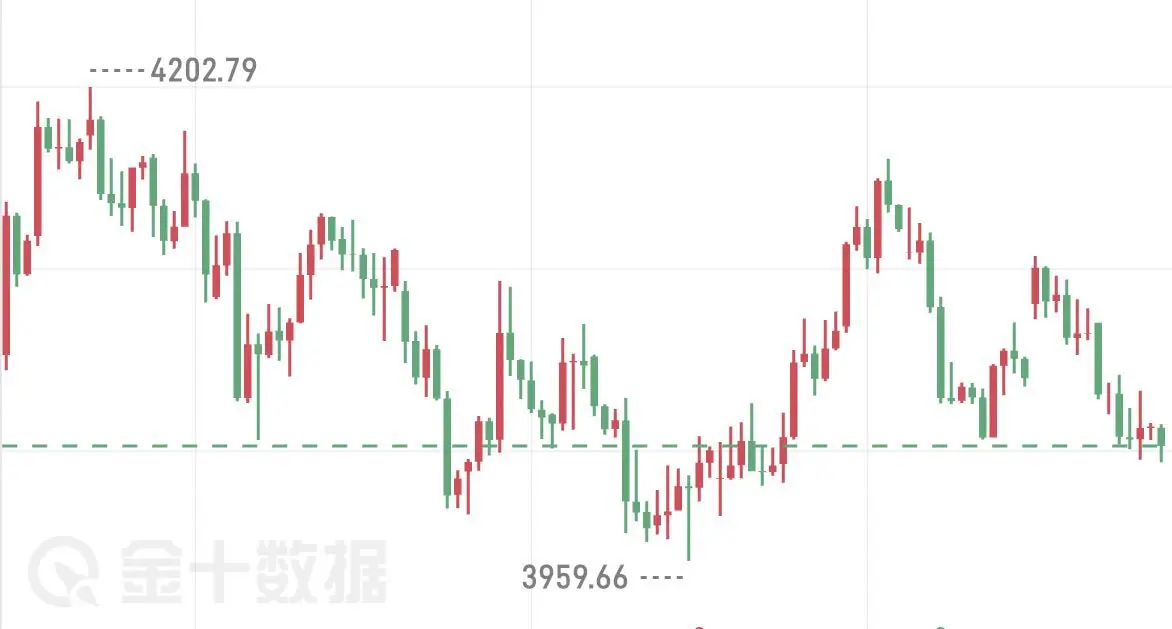
Yesterday, gold prices once again pushed higher but met resistance and then fell. The low dipped to around the 4,110 area.
Since turning down from the 4,116 high area, the subsequent highs have kept moving lower, and the bearish trend is clear.
Although there were brief rebounds along the way, none managed to effectively break through the key resistance; overhead pressure remains obvious.
The US dollar continues to trade at high levels with volatility, suppressing gold prices. At present, the rebound is unlikely to change the weak market structure.
Trading suggestion: short in the 4,035 and 4,
View Original
post-image
  • Reward
  • Comment
  • Repost
  • Share
$DN Selling Exhaustion: The short- and medium-term chart shows that the token has plunged by about 86% just over the last month. This vertical move stretched technical indicators like the RSI (Relative Strength Index), which entered a strong oversold zone, creating room for a technical relief rebound.Relevant Volume at the Bottom: Despite the price drop, trading volume over the last 24 hours remains high, ranging between US$ 3.1 million and US$ 5.5 million. In the chart analysis, high volume maintained in the lowest price region of the historical range suggests that large investors are quietly
DN-3.00%
View Original
post-image
post-image
  • Reward
  • 2
  • Repost
  • Share
ReadyToDaMoon:
Prepare for the next massacre
View More
Load More

Join 40 M users in our growing community

⚡️ Join 40 M users in the crypto craze discussion
💬 Engage with your favorite top creators
👍 See what interests you
  • Pinned