









Square
Following
Hot
News
Notifications
Profile
Share your thoughts
placeholder
Article
#GateLeadsRWAPerpExpansion #ShareWeekly

Gate Is Building a Bridge Between Traditional Finance and Crypto: Why Its RWA Perpetual Growth Matters

The boundaries between traditional financial markets and cryptocurrency are becoming increasingly difficult to define. What once existed as two separate financial environments is gradually moving toward a more connected ecosystem. Real-World Assets (RWA) are playing a major role in this transformation, and Gate is positioning itself as an important participant through its rapidly expanding RWA perpetual trading market.

What makes this development pa
BTC-0.67%
ETH-1.26%
$INIT The long position reached TP3, and the price action looks good. After stabilizing in the 0.087 entry zone, it hit the target at 0.0929. Execution went smoothly. Not investment advice; manage your position size yourself. Current data · Latest price 0.0896600 · P&L +94.12 USDT · ROI +71.37%
post-image
INIT-2.53%
Trenches
IDOL
I
bade
b
IDOL
0x3b...ab07
Market Cap
$.
Change
.
24h Vol
$.
Holders
.
PIEVERSE
P
bade
b
PIEVERSE
0x0e...25a9
Market Cap
$.
Change
.
24h Vol
$.
Holders
.
FIONA
F
bade
b
FIONA
B34n...pump
Market Cap
$.
Change
.
24h Vol
$.
Holders
.
CLAUDIA
C
bade
b
CLAUDIA
2j5S...W2ZM
Market Cap
$.
Change
.
24h Vol
$.
Holders
.
Singularity
S
bade
b
Singularity
7R4M...pump
Market Cap
$.
Change
.
24h Vol
$.
Holders
.
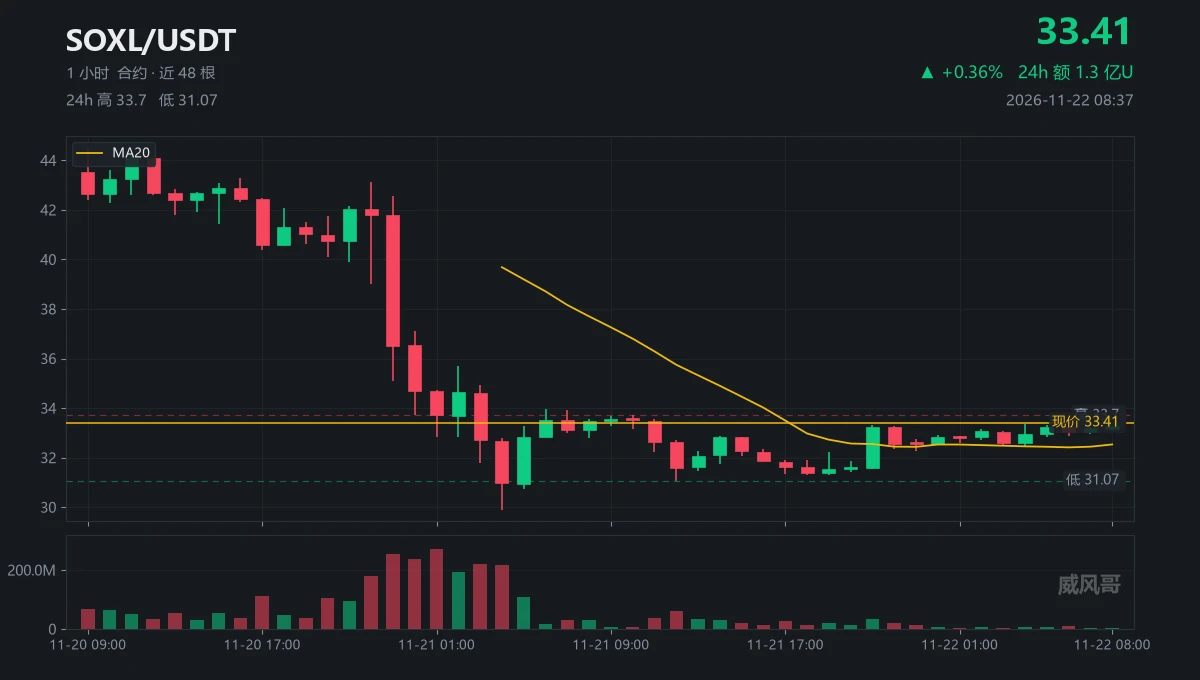
19 hours, from 44.54 to 29.89, down 0.77 bucks per hour
This stretch.
I didn't make that trade.
I was sitting on my hands then; no signal had flashed.
Four bars. 255 million, 238 million, 269 million, 222 million.
All around 4x volume, each one lower than the last.
Even if a signal had flashed, I wouldn't chase the fourth bar—that's how you become someone else's exit liquidity.
Now.
33.41, ranging for 28 hours, with a high of 33.70 and a low of 31.07.
This middle range.
I don't trade it.
If it breaks below 31.07, I'll go short; if it gets above 33.70 and volume returns to 60 million contracts,
post-image
SOXL-1.16%
  • 2
  • 1
This time, I’m really treating the event page like a scoreboard and refreshing it whenever my ranking changes. The Gate Annual Gala is still underway—just head to the event page and you’ll see me. Send me a few support points while you’re there. It’s completely free, and after sending them you can also enter the support-point raffle. You’re the one who wins—I just want my ranking to look better. Longtime fans know the drill: just click the link to do it 😄
https://www.gate.com/zh/competition/Annual-Gala?ref_type=165&ch=Direct&ref=UVdMV1w
  • 2
  • 2
Crypto Barometer, Yibo Talks Crypto is live 📢📢📢
post-image
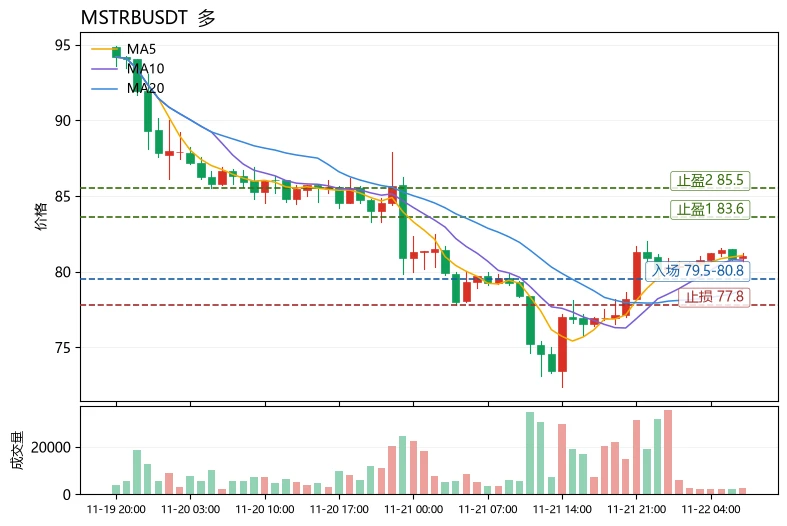
The most unusual detail in today’s market is that the Fear and Greed Index has plunged to 12, deep in the extreme fear zone, while MSTBUSDT bucked the trend and closed up 2.06%. MA5 (81.072) also held firmly above MA20 (78.83), and the MACD histogram remained bullish at +0.5023—a clear divergence between market panic and price structure. Among similarly active assets, $ENSO USDT$ENSOUSDT led with a 13.38% gain, but its MACD histogram showed a bearish signal at -0.001279, while its funding rate of -0.6305% indicates crowded longs and elevated risk of chasing the rally;
$PEPEUSDT fell 2.01% over
post-image
pepeusdt
pepeusdtUncle Pepe
Pump.Fun
MC:$2.33KHolders:1
0%
ENSO-3.03%
$UNI ’s 5.74% rebound, from 4.18 to 4.78 in a single day, isn’t just a crypto story. Last Friday, the U.S. reported core PCE at 0.2% month over month, below expectations, and the dollar index weakened on the spot. That was the first turn of the faucet. The effect reaches crypto through two steps: a weaker dollar and falling Treasury yields. Money first flows into high-beta tech stocks, then spills over into crypto, at the far end of the risk curve. So $UNI ’s move isn’t independent; it’s following the rhythm of Nasdaq futures.
Looking at the structure, the 4.18 low was carved out as U.S. stocks
UNI+3.05%
  • 1
  • 2
The police don’t dare intervene when Indians and Pakistanis carry knives and swords in public, yet they immediately show up at the door, handcuff, and haul away Britons for saying one true thing about Islam online.

This is the real contrast in law enforcement in the UK today—not neutral policing, but selective surrender.

Sharia law is enforced strictly only against Britons, while Muslims get a pass.

Britain no longer belongs to the British. Assimilation is dead. All that remains is surrender or resistance.
Crypto Trade Today
live-cover
LIVE1,039
AAPL-1.83%
AMD-13.27%
PLTR-6.45%
NVDA-13.84%
MU-13.88%
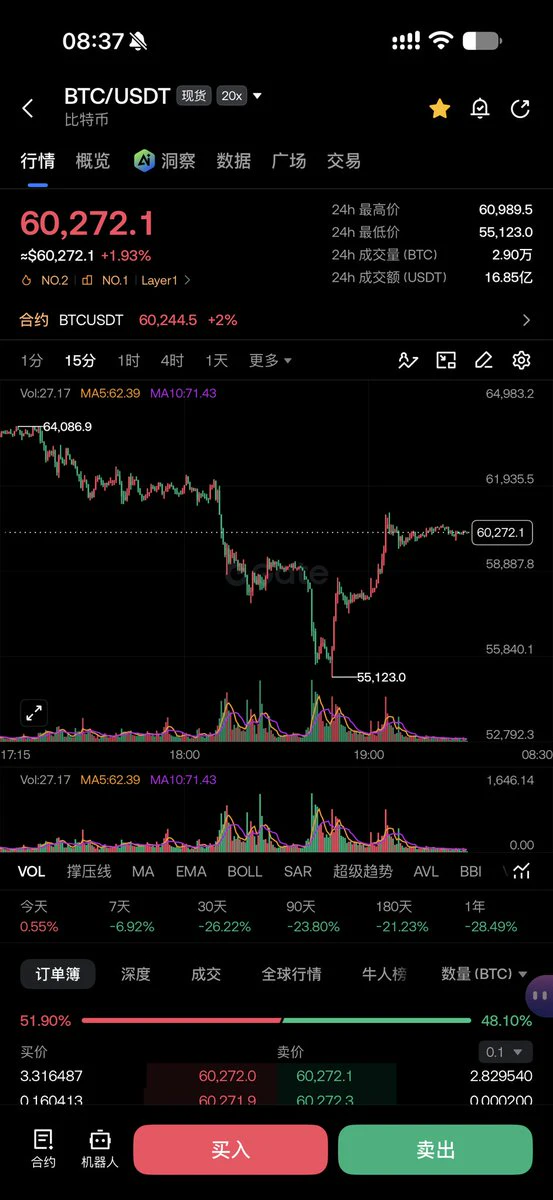
Good morning, Zuo Zuo kept an eye on the crypto market all weekend for you ☕
Early Saturday morning, $BTC got knocked flat in the ring: a low of 55,130, its lowest in more than two years (since September 2024)
Then it got back up on its own: up about 9%, now back above 60,000, around 60,250 at 06:30 Taipei time
The cost of that fall 👇
About 1.8 billion dollars liquidated in 24 hours, including 1.3 billion in long positions
Realized losses hit 11.3 billion dollars in one week, 8 times the profits over the same period
Spot BTC ETFs saw about 1.1 billion dollars in net outflows in one week
The
post-image
BTC-0.67%
330U Copy Aoying Capital | Day 46 · Morning Briefing

Good morning! A new day begins, and we're following Aoying Capital's trades!
These are copied positions, not Aoying himself—please use discretion (^v^)
Starting capital: 330U; return: 207.47%; current funds: 614.66U. (400U has been withdrawn during this period)

A quick update for today:

Currently holding a ZEC short position.
It's under pressure in the short term, but Aoying hasn't closed it. Let's see how it plays out.

Let's keep following along today!
post-image
ZEC+1.29%
#USNOVJoblessClaimsBeatExpectations #ShareWeekly

US Jobless Claims Rise Above Forecast: Why a Cooling Labor Market Is Not Enough to Change the Fed’s Direction

The latest U.S. unemployment claims report has delivered an important message to financial markets: America's labor market is gradually losing momentum, but it is not weakening fast enough to force the Federal Reserve to abandon its restrictive monetary policy. This distinction is becoming increasingly important for investors as inflation concerns, interest-rate expectations, and institutional liquidity continue to influence global fi
BTC-0.67%
US500-3.01%
US30-1.48%
BLK-3.02%
IBIT-5.97%
Bitcoin Rebounds Sharply by 9%, but Wall Street Is Still Pulling Money Out!
BTC rebounded from $55,130 to $60,264, and the market is calling a bottom again.
But what really matters is the flow of funds behind the price:
BlackRock’s IBIT saw record single-day net outflows of $541 million.
U.S. spot BTC ETFs saw net outflows of about $3.592 billion in November.
BTC liquidations totaled $660 million over the past 24 hours.
The Fear and Greed Index fell to 8, putting the market in extreme fear.
Yet hedge fund Abraxas Capital withdrew 5,856 BTC worth $343 million from exchanges.
With money flowing
post-image
BTC-5.94%
🌞 Good morning, another beautiful day!
Rainbow goes into the basket 🌈
post-image
MARKET PREDICTION
live-cover
LIVE1,346
ETH-1.23%
BTC-0.65%
$HYPE Is Strong on the 1-Hour Chart but Weak on the 4-Hour Chart; Direction Remains Unclear
$HYPE is currently at 61.54, up 1.652% over 24 hours, with an intraday range of 55.8‑61.9. The 1-hour chart shows strength, with the price above the EMA20 at 60.8225. RSI14 is at 76.8, entering overbought territory, but the volume ratio is only 0.29, far below average, indicating limited short-term buying participation. The 4-hour chart remains weak, with the price still trading below the EMA20 at 62.93. RSI14 is at 30.86, near the lower end of its range, while resistance is well above at 70.3. Both tim
post-image
HYPE+0.24%
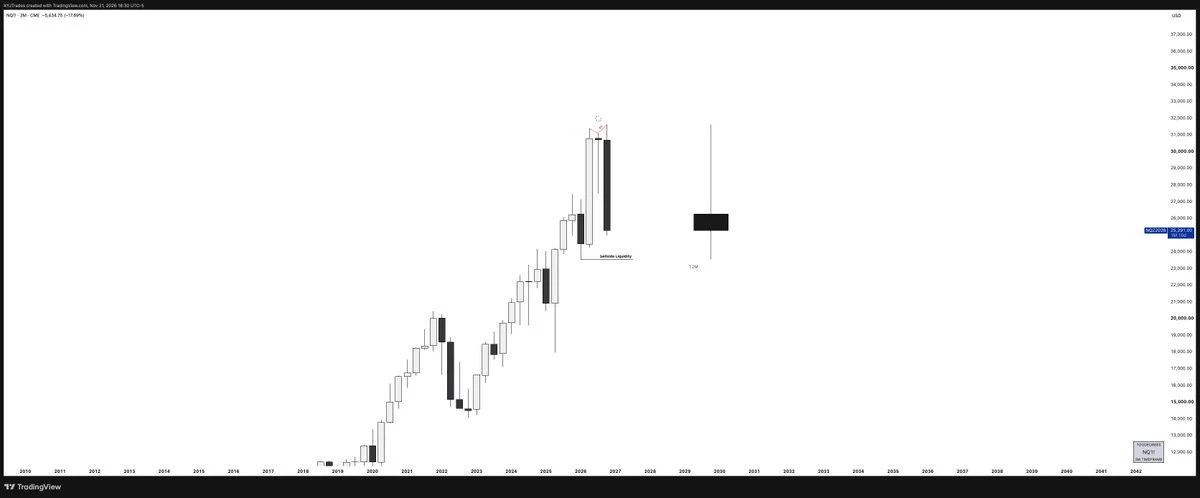
Reversal Sequence; Yearly Candle profiled by quarterly swing formation
post-image
$XRP The current 1-hour and 4-hour trends are showing a clear divergence. The 1-hour timeframe is bullish, with the RSI as high as 74.12, while the 4-hour timeframe is bearish, with the RSI at just 39.37. Short-term traders may see a strong uptrend, while investors focused on longer timeframes may think the market remains under downward pressure. This divergence makes the current trend difficult to assess, especially with the price already nearing the 1-hour resistance level of 0.9389.
I would choose to wait at this level, as chasing a long position carries significant risk. The current price
post-image
XRP-1.15%
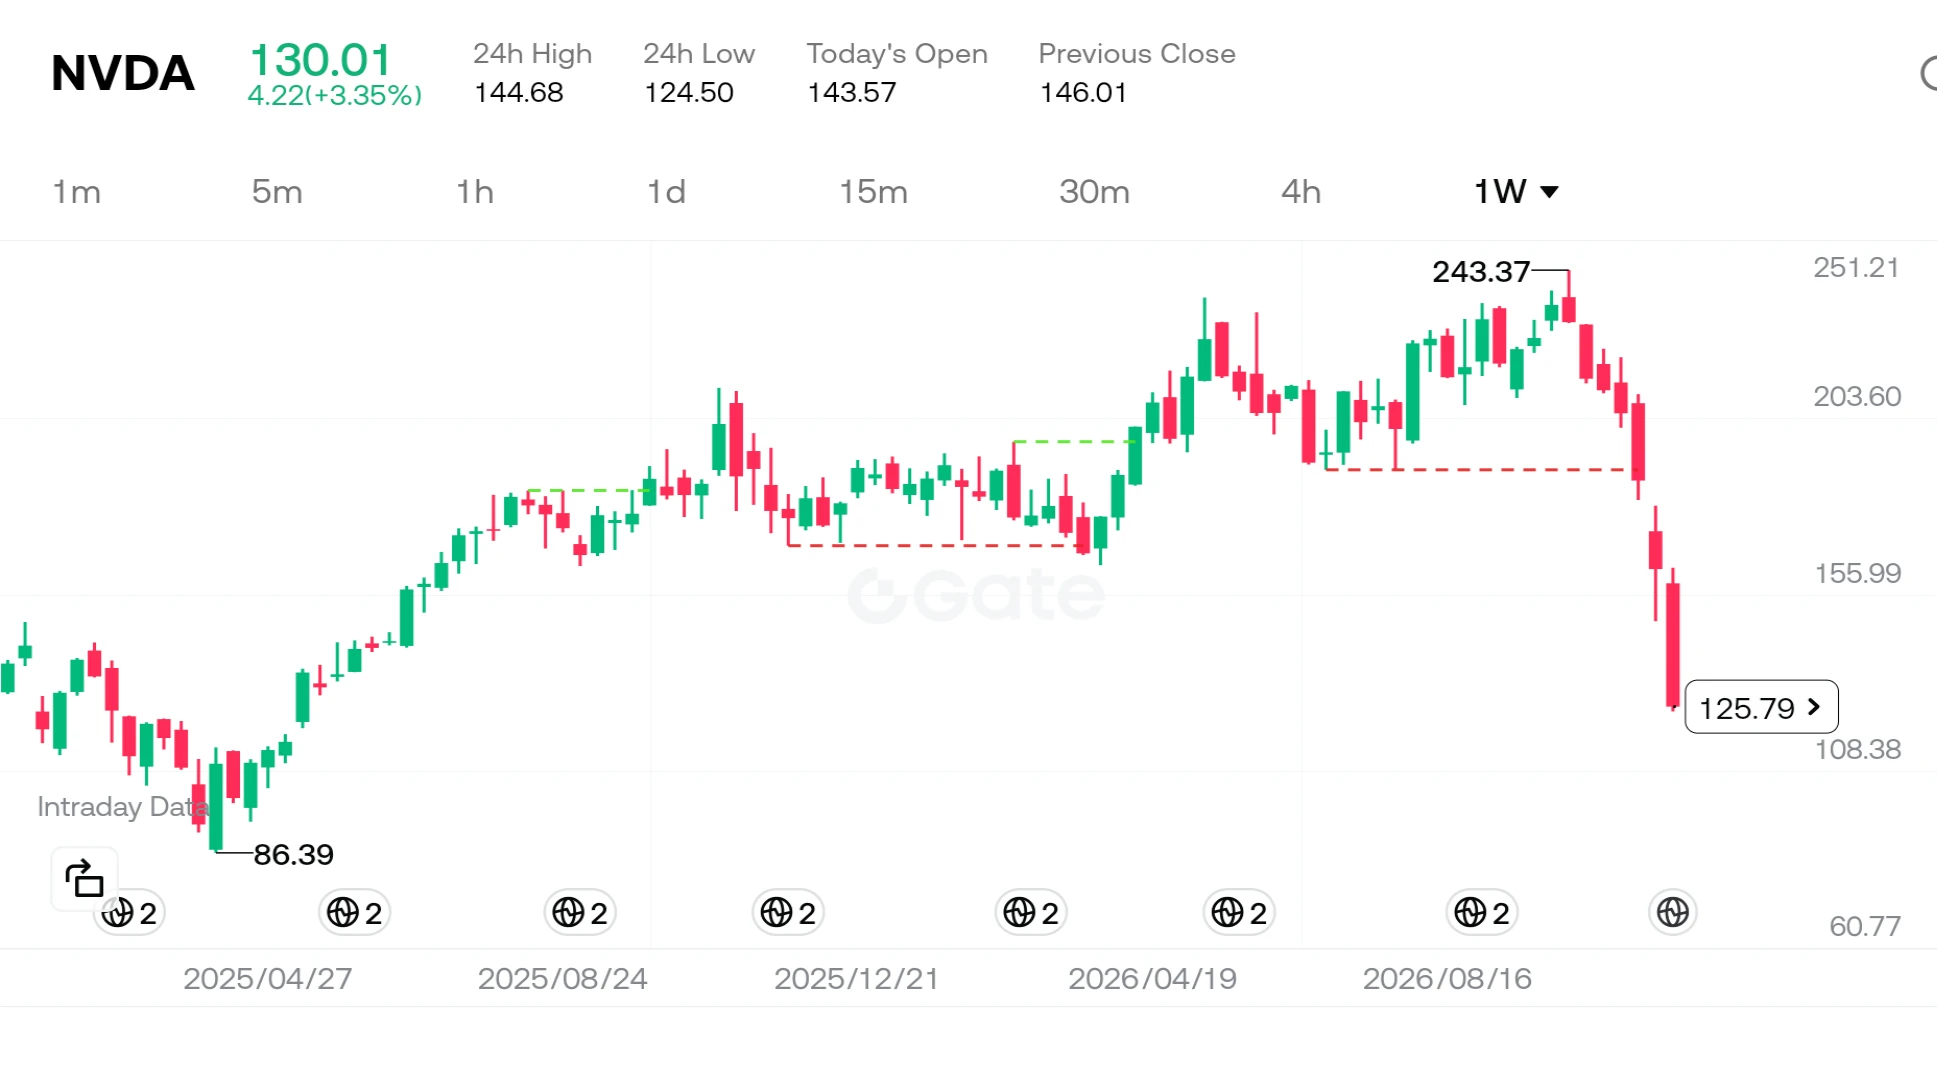
Nvidia shares failed to bring any cheer to investors, slipping to the $130 level in weekend trading. The sharp decline from the stock's peak of $243 can no longer be dismissed as a mere "market correction." The formal investigation launched by the U.S. Securities and Exchange Commission (SEC) into the company’s accounting practices has served as the primary catalyst for this downturn.

So, what does this investigation signify, and why has it shaken the stock price so profoundly?

Looking first at the company itself: as the driving force behind the artificial intelligence revolution, Nvidia has
post-image
User_any
$NVDA ‌
Nvidia has been losing ground for seven consecutive weeks—a trend not seen since 2008. The stock plummeted 14% last Friday alone, bringing its total decline over this seven-week period to approximately 46%. As clearly illustrated on the chart, the price has retreated from a peak of $243 to the $125 range. So, what is the story behind how this once-most-valuable company reached this point?
In reality, this is not merely a stock market correction; it is the result of three major, intersecting storms hitting the same vessel.
First, let’s look at the company’s internal dynamics. Uncertainty within management following a CEO transition, combined with the SEC’s decision to investigate the company’s accounting practices, has severely shaken market confidence. But that is not the whole story. The massive scale of spending on artificial intelligence has led investors to ask: "So much money is being spent—but when will we see a return?"
Meanwhile, macroeconomic headwinds have also shifted. Minutes from the Federal Reserve’s meetings indicate that nearly all officials expect interest rate hikes to continue. A high-interest-rate environment exerts significant pressure on growth stocks, which are valued based on their projected future cash flows. This situation has impacted not only Nvidia but the S&P 500 as well; the index fell 8.6%, marking its worst week since April 2025 and pushing it into correction territory.
Even the major Anthropic IPO that took place last week was not enough to halt this wave of selling. For many analysts, this situation serves as proof that the market is no longer focused on "new narratives," but rather exclusively on "cash flow and profitability." The fact that gold and silver have fallen to their lowest levels in over a year, combined with oil’s decline for the third consecutive week, highlights just how fragile risk appetite has become. Investors have effectively "retreated to their corners."
The most important lesson for individual investors here is that, regardless of how strong a company’s operational performance may be, macroeconomic headwinds and management uncertainties can fundamentally shake its valuation. Nvidia’s core business model remains robust, yet the market is currently pricing in risks rather than the company’s growth story. In times like these, the wisest approach is to avoid leverage and—instead of attempting to call the "bottom"—wait for prices to stabilize.
Do you believe this decline in Nvidia presents a long-term investment opportunity, or are we witnessing the deflation of an artificial intelligence bubble?
#Nvidia #Macro #TechStocks
#ShareWeekly #WCTCS9
Not investment advice.
repost-content-media
NVDA-13.84%
  • 2
  • 2
ELSA | Long 🟢 | Bullish | 15 minutes 24 hours: +0.59% | Volume: 36.4M USDT Long rationale: Price above EMA200; EMA20/50/200 are in bullish alignment; RSI14 is 51.3; MACD histogram is positive; ADX14 is 23.4; volume is 2.87 times the 20-candle average; trend pullback/continuation. Entry: 0.06789 Stop loss: 0.0667006 First target: 0.0693768 | Second target: 0.0702688 | Third target: 0.0714582 For reference only; do not chase the price. Hitting the stop loss invalidates this strategy. Technical analysis strategy only, not investment advice. $ELSA
post-image
ELSA+5.80%
Load More

Join 40 M users in our growing community

⚡️ Join 40 M users in the crypto craze discussion

💬 Engage with your favorite top creators

👍 See what interests you

Trending Topics

BTCBreaksBelow60K

2.1M Views30.1K Discussing

BTC fell below $60,000 on November 20 for the first time since July, alongside a tech stock selloff and broader pressure on risk assets. Will $60K become resistance, or can BTC quickly reclaim it? What price or volume signals would convince you that selling pressure is easing?

GateDirectIPOPhase3ANTAllocates92100Shares

799.8K Views4.9K Discussing

NvidiaDropsNearly14Percent

335K Views7.6K Discussing

View More