



Share your thoughts
placeholder
Article
PRIME MINISTER OF THE UAE SAYS #BITCOIN AND CRYPTO ARE NOW A "NEW SECTOR" FOR ITS ECONOMY
OIL MONEY HEADING INTO $BTC
THIS IS BIG NEWS FOR THE CRYPTO SPACE
post-image
BTC+0.15%
  • 5
  • 2
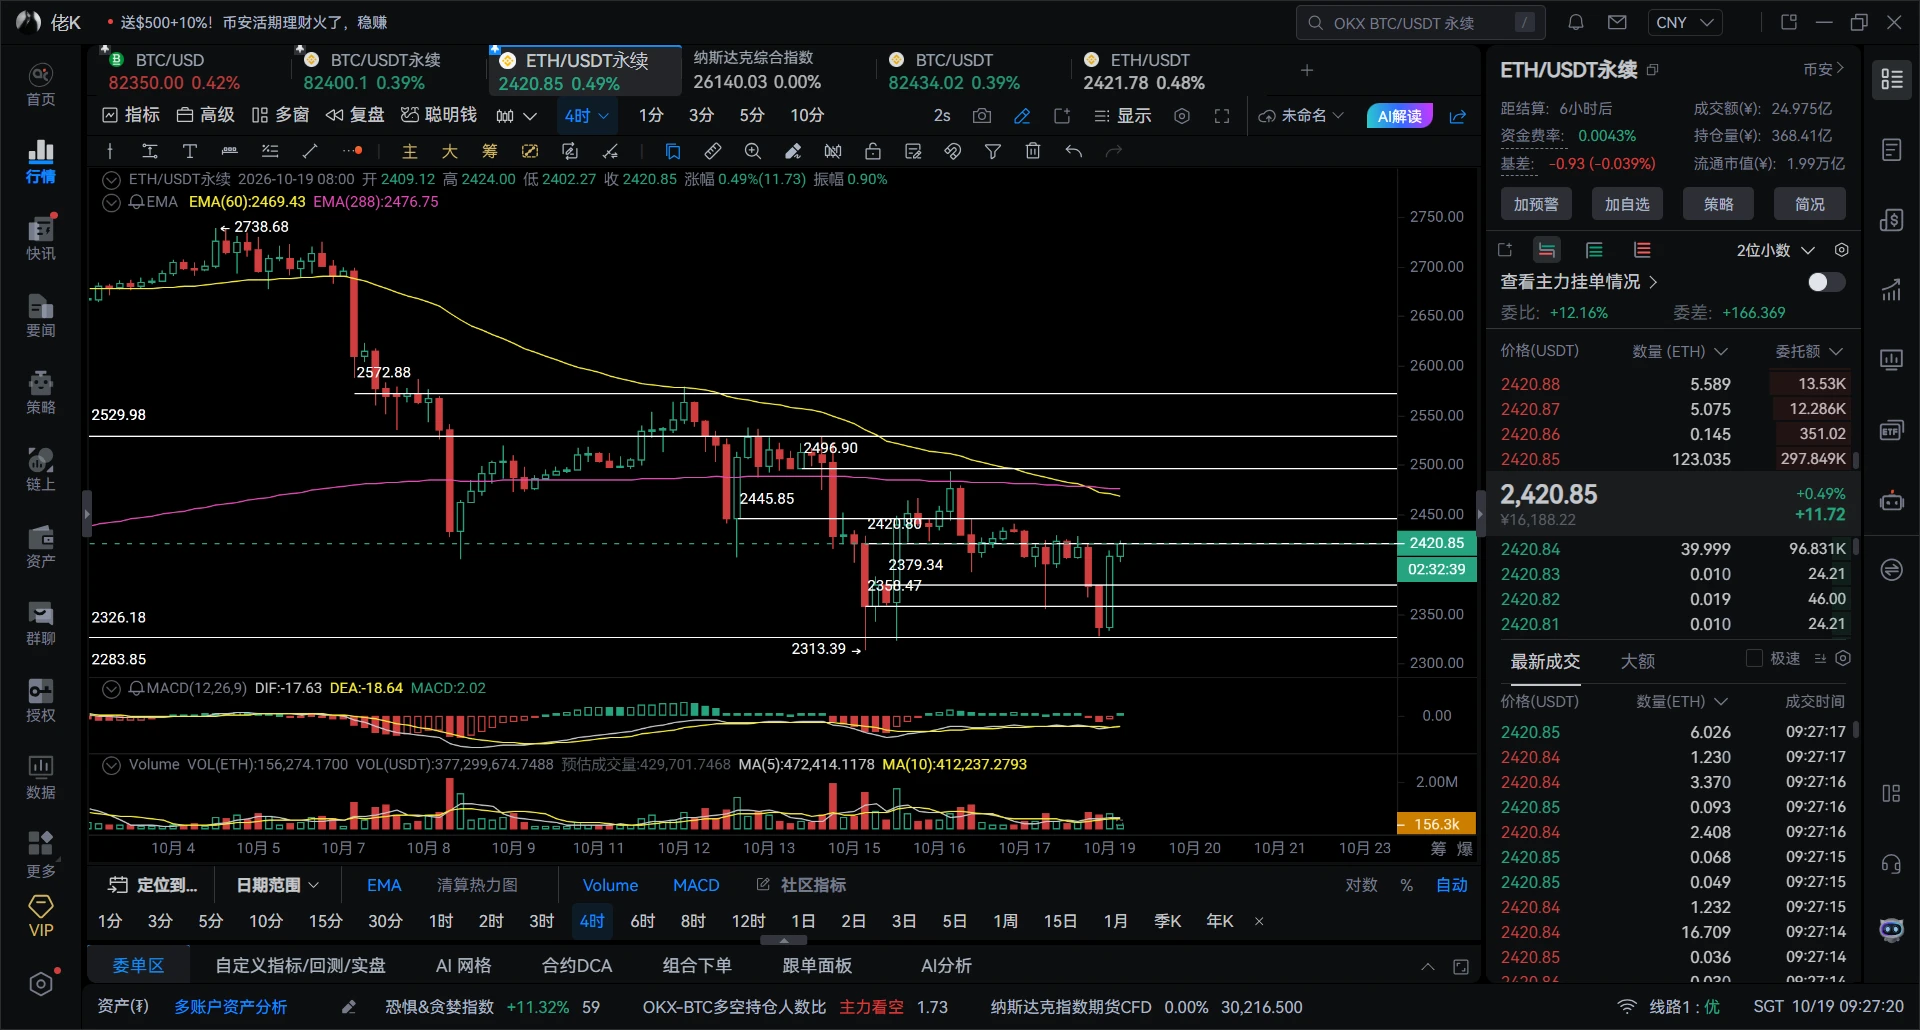
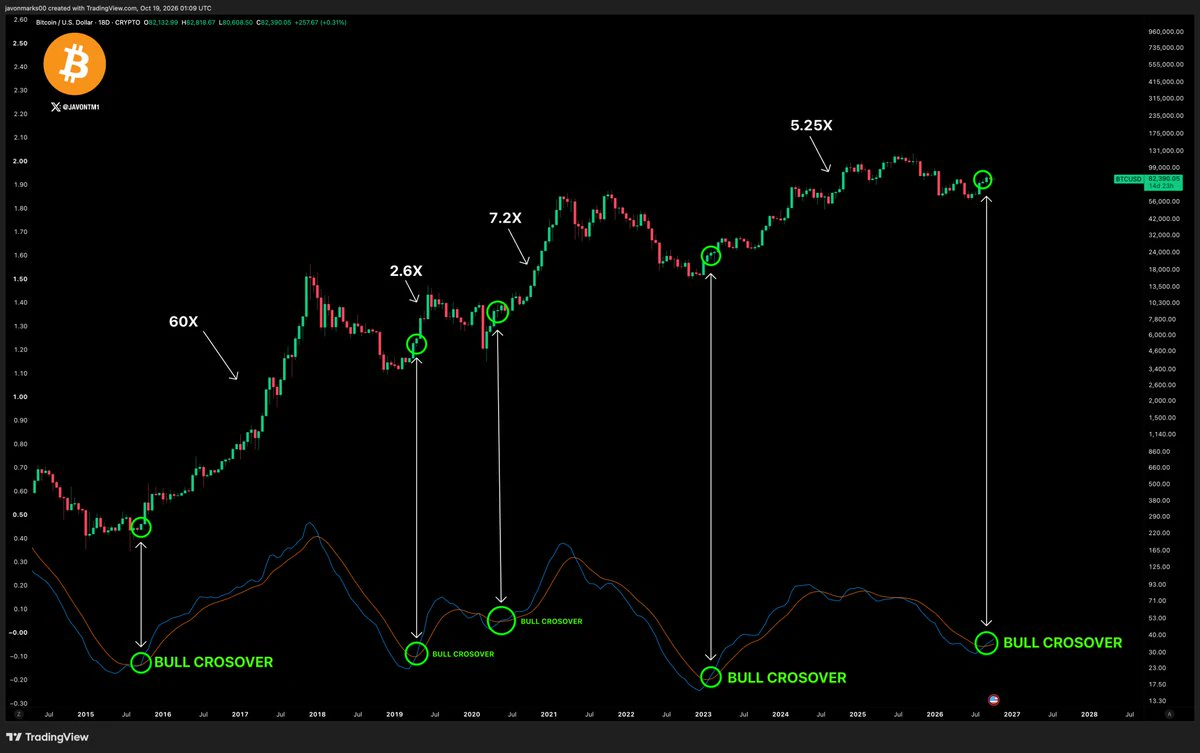
I would expect something liken this for $ETH .
Everyone losing their minds over inflation, hikes, OIL, war, clarity...
It doesn't matter bros.
The chart is telling you how all of that news is being interpreted.
Crypto is back in a bull market, that's it.
We're gonna get chop, we're gonna get swings...
But the regime has changed and higher is now the play.
Don't get shaken out.
post-image
ETH+2.94%
$ELON will retire us this cycle.
Bankr bot created a token for Elon’s stock & he gets all the fees, imagine the smell if he claims those fees?
ELON+4.71%
The stop-loss I nervously canceled a few days ago—looking at it today, it feels like it spared me.
A few days ago in the afternoon, buying pressure strengthened after $HEMI retreated. I judged that the bottom consolidation was about to choose a direction and signaled for longs to follow. The market had not fully started moving yet, and few people dared to enter.
From 0.005583 to 0.006805, +431.28% secured. The timing was spot-on—after all that sluggish action, seeing it break out feels truly great.
Panic comes from having no plan; losses come from overthinking. Money earned is the realization
post-image
HEMI-6.01%
SOL+2.61%
ZEC+2.91%
10x Leverage vs Spot - Best for Beginners
live-cover
LIVE66
Everyone is about to watch $H /USDT get crushed below the daily trend.

$H /USDT - SHORT

Trade Plan:
Entry: 0.08303 – 0.08393
SL: 0.08782
TP1: 0.08022
TP2: 0.07805
TP3: 0.07479

Why this setup?
Why now? The 1h price is hovering at 0.08353 inside a bearish 1D trend, the 15m RSI is stuck at 59.43 showing weak momentum, and the 1h ATR of 0.00181 tells us volatility is compressed before a move. The entry zone sits between 0.08303 and 0.08393, giving a precise trigger near 0.08348. If momentum turns, TP1 is 0.08022 and TP2 is 0.07805, while the invalidation level at 0.08109 is the line in the s
H+4.82%
XRP is range-bound, but the 1h setup suggests a short is forming right now.

$XRP /USDT - SHORT

Trade Plan:
Entry: 1.3563 – 1.3663
SL: 1.4092
TP1: 1.3254
TP2: 1.3014
TP3: 1.2655

Why this setup?
Why now? The daily trend is range, yet the 1h ATR of 0.019968 shows volatility is compressing before a directional move. The 15m RSI sitting at 50.03 means neither side is exhausted, so the 1h price at 1.3613 becomes the pivot for a short bias. The entry zone between 1.3563 and 1.3663 aligns with that exact pivot, giving a clean trigger. TP1 at 1.3254 and TP2 at 1.3014 map out the measured move dow
XRP+0.32%
$MET Signal】Long | Buy the 1H pullback, target the 4H upper band
$MET 4H Bollinger upper band resistance at 0.2738, 1H RSI 65.20, order book depth imbalance -8.32%.
Current price 0.2687 is near-term support, 4H MACD red bars narrowing, 1H MACD also contracting. Bid/Ask 0.85, with sell orders slightly heavier. The risk/reward for this pending order is acceptable, but there is limited room to chase at the current price.
🎯Direction: Long
⚡Entry/Pending order: 0.267894 - 0.268700
🛑Stop-loss: 0.266013
🚀Target 1: 0.272730
🚀Target 2: 0.274746
🛡️Trade management:
- Execution strategy: After reac
post-image
MET+15.10%
🐋 WHALE WATCH : Looking at the current BTC sentiment I find it more noteworthy than scary.
Bearish + Very Bearish is taking up as much as 51% while Bullish + Very Bullish is only 28%. Neutral is 22%.
Personally I usually don't like FOMO when the majority is overly optimistic. On the contrary when sentiment tilts strongly toward pessimism like this I start paying more attention.
Of course bad sentiment doesnt mean BTC will bounce right away. But the market often has a familiar trick: when the majority has mentally prepared for a downside scenario the price chooses to make things difficult for
post-image
BTC+0.15%
I originally wanted to cut my losses and sacrifice them to the heavens, but the ritual failed—the meat roasted itself instead. This is none other than the $XRP short position I opened a few days ago.

While everyone was still waiting and watching, I had already entered around 1.3836. Why the rush? Because before the market had fully started moving, I saw clear resistance above, with selling pressure getting heavier each round, and rebounds unable to hold at all. With this structure, if you don't go short, are you really going to wait for it to drop before buying in?

When I checked the mark
post-image
XRP+0.32%
LAB+66.54%
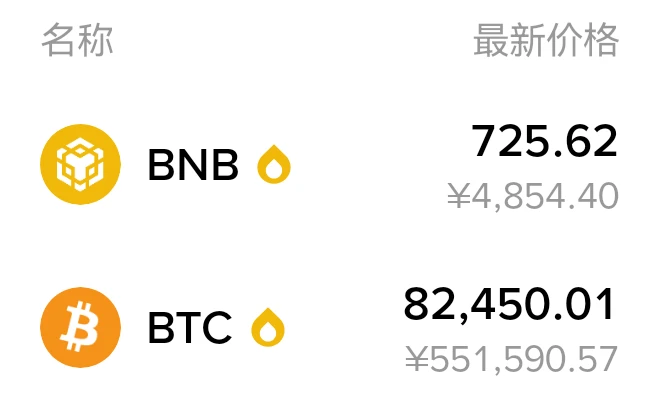
BNB+1.46%
$SAGA This 14-point bearish candle was created with my own real money.
Yesterday at 0.0186, I cleared half my position and bought it back at 0.0160 today. This isn’t hindsight—the market signals had been obvious three days ago: it failed to break through around 0.019 four times in a row, while volume shrank below 80M, a classic sign of market makers trading among themselves to distribute. Look at the 24h trading volume of 53.2M, nearly 40% below the peak. Retail investors were still dreaming of a breakout, so I locked in my profits first.
Here’s the trading strategy: First, push up the price t
SAGA-14.31%
Insiders are quietly loading short positions on $XAU /USDT while the 1h price sits at 4358.21

$XAU /USDT - SHORT

Trade Plan:
Entry: 4353.25 – 4363.17
SL: 4405.82
TP1: 4322.50
TP2: 4298.70
TP3: 4262.99

Why this setup?
Why now? The daily trend is range-bound, which often precedes a sharp directional break, and the 1h ATR of 19.83796 confirms enough volatility to fuel a meaningful move. The 15m RSI at 47.88 shows the market is balanced, not overbought, so a short bias has room to breathe. The entry zone between 4353.25 and 4363.17 aligns with the 1h price of 4358.21, giving a precise refere
XAU+0.68%
The old meme coin that crashed into penny-stock territory came back to life overnight: DOGS surges 18.09% on heavy volume
Well, the old meme coin that crashed into penny-stock territory has come back to life—$DOGS is now at 0.00005365, down 96.71% from its all-time high, and up 18.09% over 24h. I’m bullish but won’t chase; I’ll buy the dip.

Let volume speak first—24h trading volume is 4.15M USDT, with a volume ratio of 3.72; a 15m candle at 01:30 tested 0.00005505.

Derivatives—OI is up 9.11% versus last night’s snapshot, the long-short ratio is 1.586 (61.33% long), and the -0.00064571 fund
DOGS+12.14%
Everyone is about to regret missing $SOL /USDT right now.

$SOL /USDT - LONG

Trade Plan:
Entry: 102.17 – 102.85
SL: 99.23
TP1: 104.97
TP2: 106.61
TP3: 109.06

Why this setup?
Why now? The daily trend is bullish, the 1h price sits at 102.51, the 15m RSI reads 56.84 and the 1h ATR is 1.365291, which together show the asset is resting in a tight entry zone between 102.17 and 102.85 with room to run. The first target at 104.97 represents a clean measured move off the low of that zone, while the second target at 106.61 extends the rally into a zone where momentum historically accelerates. The l
SOL+2.61%
[$Lobster Signal] Long + 4H high-level turnover on volume expansion
$Lobster high-level turnover, depth ratio 1.37, current price 0.050507. Sideways movement after a 4H huge-volume long bullish candle, with thick buy orders. The 4H MACD histogram turned positive, with a bullish cross below the zero line; RSI 48.92, momentum not overheated. EMA20 at 0.0488 provides support, while EMA50 at 0.0571 creates resistance. Funding rate 0.0394%, OI stable. Enter long in the current price range, risk-reward ratio 1.5, stop-loss distance relatively wide, reduce position size.
🎯Direction: Long
⚡Entry/limi
post-image
龙虾+72.85%
BTC+0.15%
ETH+2.94%
SOL+2.61%
I switched to the background to reply to a message, and when I came back, it had already finished the job.
A few days ago that afternoon, when $JCT was pushed upward, the volume couldn’t keep up and the resistance above was extremely heavy. I put it directly: don’t chase it—there’s no one to take it higher.
From 0.002429 all the way down to 0.001495, floating profit reached +943.92%. Those who were on board should have woken up laughing.
Take 80% off first, protect the remaining 20% at cost, and let profits run as it continues downward. If it rebounds, don’t give the profits back.
Panic comes
post-image
JCT+5.38%
ETH+2.90%
SOL+2.61%
Everyone is sleeping on this 95% short signal for XAUT while the daily trend screams bearish.

$XAUT /USDT - SHORT

Trade Plan:
Entry: 4346.1 – 4356.1
SL: 4399.2
TP1: 4315.0
TP2: 4290.9
TP3: 4254.9

Why this setup?


Debate:
Are we hitting TP2 at 4290.9 or getting trapped above 4411.5?

⚠️ Personal market analysis only. NFA — manage risk and DYOR.
Educational content, not investment advice or a recommendation to buy, sell, deposit, or withdraw any asset. No paid promotion or referral/affiliate links.
XAUT+0.55%
$BTW surged during the day, but I didn’t chase it because a long-term trendline was positioned directly overhead, making it difficult to place a stop-loss after entering. I waited for it to pull back and regain stability before entering a long position in line with the lower-timeframe structure.
After entering, it consolidated for a short while. I didn’t rush to trade back and forth. Once the price moved a certain distance away from my entry, I first closed 80% to lock in profits on the core position, leaving the remaining 20% to follow the trend.
After the breakout candle appeared, I first to
post-image
BTW+0.15%
DOGE+0.18%
ETH+2.90%
Last night, Puerto Vallarta, big mama turtle lay eggs.
Load More

Join 40 M users in our growing community

⚡️ Join 40 M users in the crypto craze discussion

💬 Engage with your favorite top creators

👍 See what interests you

View More