





Square
Following
Hot
News
Notifications
Profile
Share your thoughts
placeholder
Article
High prices continue to erode purchasing power, and US consumer confidence remains weak.
live-cover
LIVE57
privacy matters more than anything!
i choose privacy!
i choose @solflare
post-image
Trenches
ZIG
Z
bade
b
ZIG
0x8c...1145
Market Cap
$.
Change
.
24h Vol
$.
Holders
.
BTC
B
bade
b
BTC
C5xp...pump
Market Cap
$.
Change
.
24h Vol
$.
Holders
.
IDOL
I
bade
b
IDOL
0x3b...ab07
Market Cap
$.
Change
.
24h Vol
$.
Holders
.
José
J
bade
b
José
87CQ...1UJT
Market Cap
$.
Change
.
24h Vol
$.
Holders
.
scamsem
s
bade
b
scamsem
41Wp...pump
Market Cap
$
Change
.
24h Vol
$.
Holders
.
#每周来晒 #广场交易达人 #WCTCS9

Review of Position and Asset Allocation

Today I reviewed my positions and assets so far this week and found that my overall exposure is still fairly high, at 80%. This is mainly because I’ve continued to maintain my previous bull-market mindset. In fact, the first major rally has recently ended, so I should reduce my exposure accordingly. That will be my main focus early next week. My current positions are distributed as follows:

Total exposure: 80%

现货:30%,主要持仓GT

合约:50%

比特多单:30%

英特尔多单:10%

AKE多单:10% $A
post-image
AKE+6.39%
$COTI broke strongly to the upside after a prolonged decline, with a strong 1-hour green candle reclaiming the $0.0100 level. Market momentum is shifting toward buyers, and if the price holds above $0.01021, it could rise further. Key level: $0.01021. Before entering, watch to see whether the price can successfully hold the breakout zone. Avoid chasing the initial spike. Buy and trade $TRUMP SNDK
post-image
COTI-2.75%
TRUMP-0.95%
Over seven days, people buying actual $BTC on the US spot venue outspent sellers by +$331M, yet leveraged traders on the global perp market ended net sellers at -$14M. Their selling hit -$223M in the 24 hours to Nov 7.
BTC-0.67%
$ACT It posted an 11.84% green candle over the past 24 hours, and the sentiment gauge flashed two extreme readings: the Fear & Greed Index surged to 78 (the upper end of the greed range), while the funding rate hit +0.035% (longs are paying, and positioning is crowded). How do these readings compare with historical levels? Over the past three months, ACT’s funding rate has risen above 0.03% only twice: once in early February, when it spiked to 0.0145 before pulling back 18% over two days, and once in mid-March, on the eve of a sideways stretch. The pattern is clear: once longs push the funding
ACT-1.76%
Bullish momentum is strong, and the rally is rapid; the momentum behind this breakout is too strong to short. I'm building a long position on $BTW . Position plan: Entry 1.221 - 1.231 Take profit 1.2833 / 1.3291 Stop loss 1.1844 Please be cautious: the 15-minute RSI is elevated, and if volume contracts, a sharp pullback may occur. Don't go all-in, bro. Position size should be based on your own account.
post-image
BTW-7.42%
Just as I thought..
Midline mayhem
BTC/VIX
post-image
BTC-0.67%
11.8
Any longs still around?
I opened the charts this weekend—why is everyone going short?
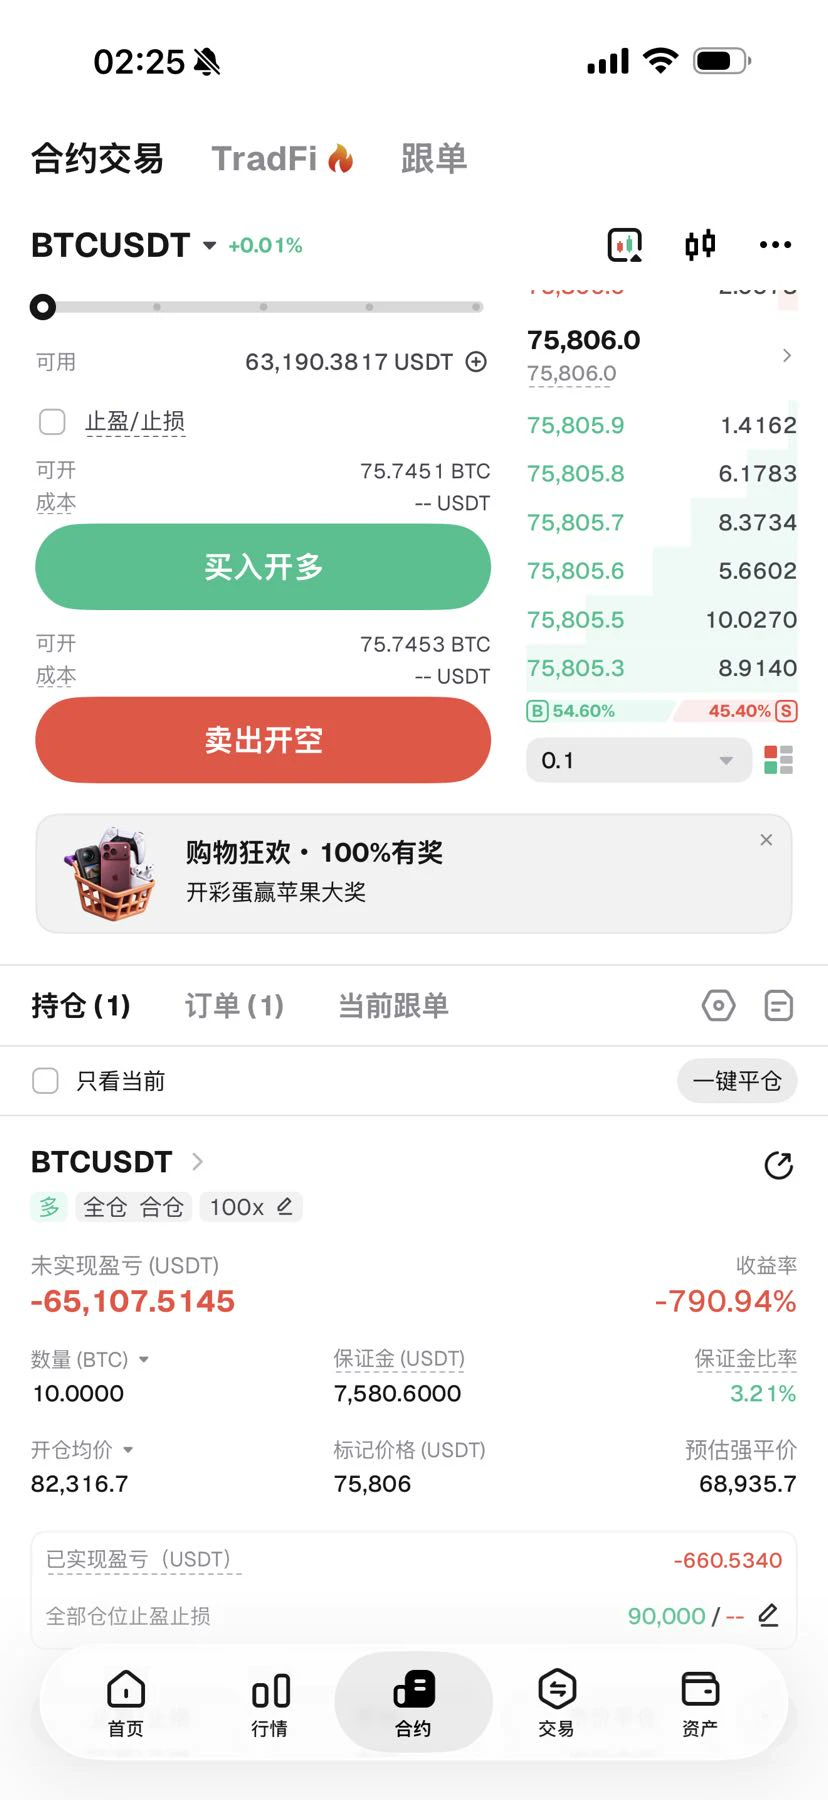
How am I supposed to survive? The actual cost basis on this position is 78k; I only just managed to bring it down by making T-trades.

Longs, leave your UID. I’ll randomly pick someone to win 1u to buy a bottle of Coke. Let’s drink it together!!!$BTC $ETH #美股AI板块遭遇重挫
post-image
FyPaymentMadeEasy
11.7
Weekend Recap
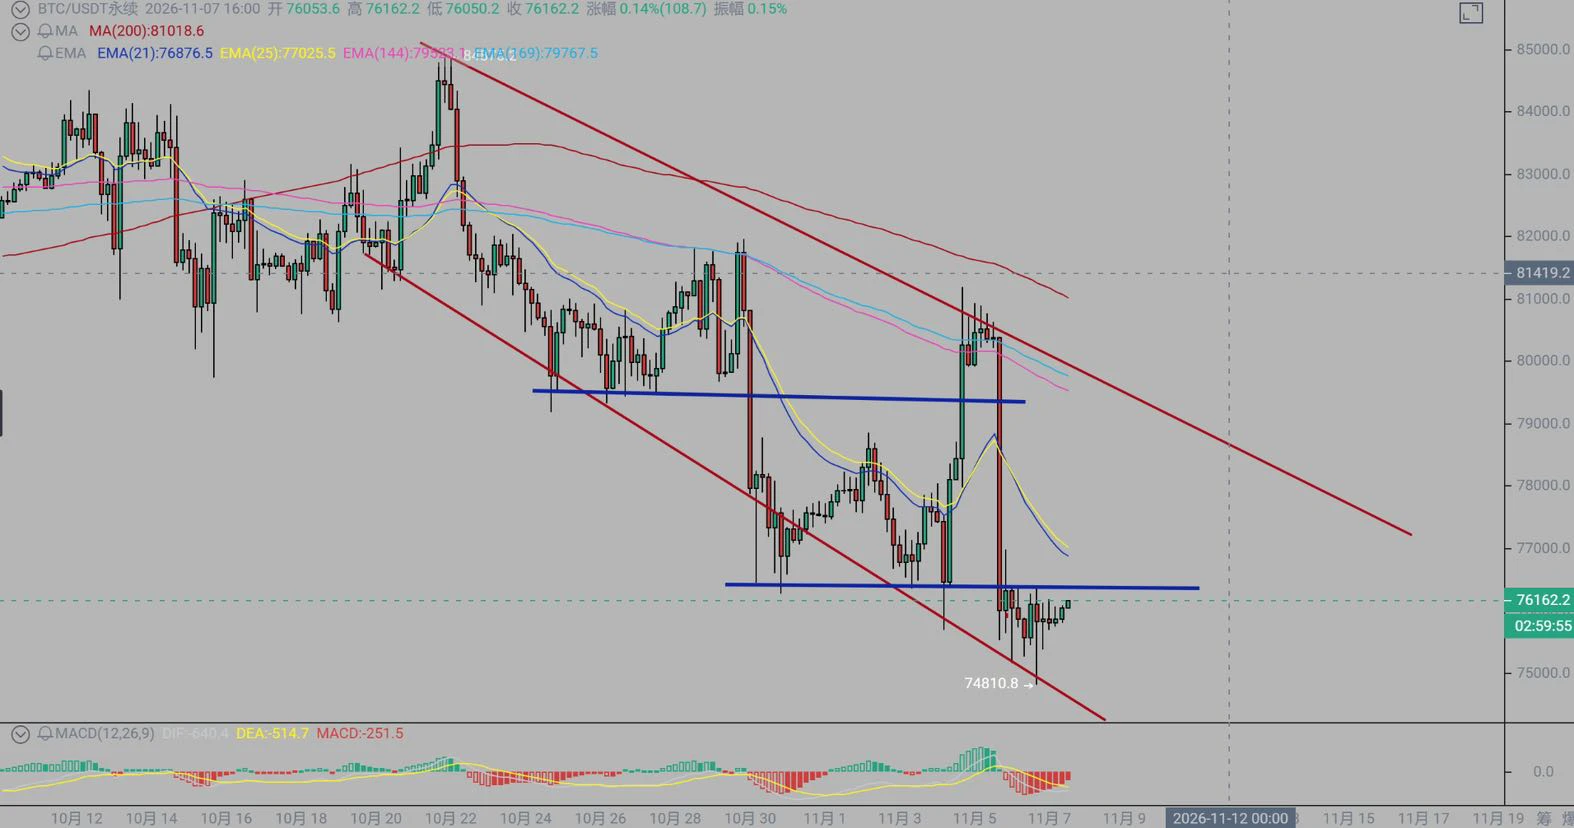
This week’s market action was quite a spectacle, with an “influencer dragon” and a “straight-down plunge”—especially as U.S. stocks fueled panic across the broader market.

I shared my views publicly in advance at 76500 and 78000, along with alerts when I went live. So the result was clear: I made some solid gains.

Few people can share their views in advance and get it right. This weekend, I’m reviewing market action and macro news. Seizing opportunities at key moments depends on macro insight and a solid understanding of micro-level price action. I do my own thing. Wishing you all solid gains!!!
$BTC $ETH #美股AI板块遭遇重挫
repost-content-media
BTC-0.65%
ETH-1.23%
  • 3
Live trading - Analysis crypto coin
live-cover
LIVE2,169
Guys, I'm opening a long position on $ZEC here‼️ Take profit: $1,290 / $1,310 / $1,340 Stop loss: $1,238.62 Be sure to manage risk and wait for a confirmation signal.
post-image
ZEC+1.16%
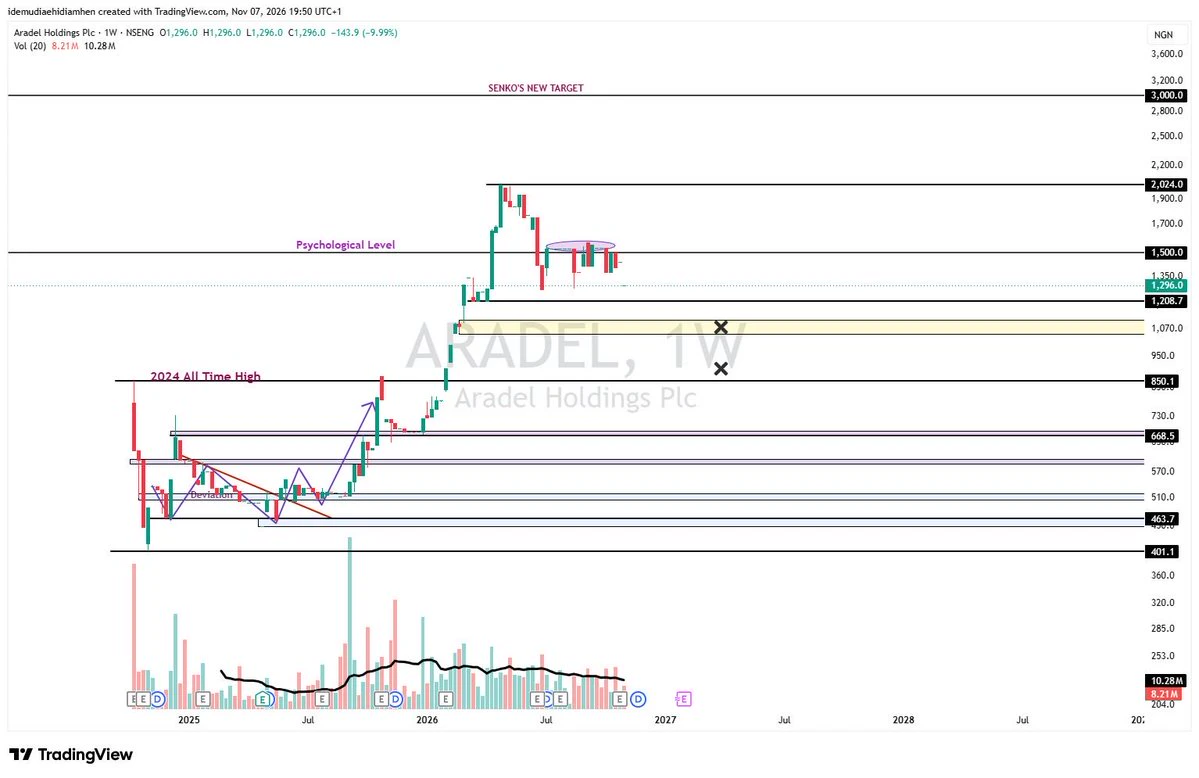
ARADEL
Let me tell you a short story.
Investors were hyped for ARADEL’s Q3 2026 results. With the run we’d seen in global oil prices, the market expected ARADEL to capitalise on it. Then the company delivered a shocker. A net loss.
One line item swallowed the profit. The provision for contingent liabilities.
Some investors expected management to come out with a clear plan for handling it. I wasn’t expecting a firm answer while discussions were still ongoing, and that’s exactly what management said. But the market hates uncertainty. Management now needs to show shareholders how it plans to reso
post-image
At three in the morning, my phone screen was still lit, and my account balance had dropped another notch—this time, I was down more than 300 U.
I’d figured weekend liquidity was low and the market would probably just drift along, but the longer I watched, the more awake I got. This kind of slow, steady decline is the most agonizing; every time I refresh the page, it feels like I’m putting myself through a psychological test.
Here’s a look at my current positions:
$BT contract entry average price: 78596.8; the current price has already slipped to 75787.8, with an unrealized loss of -194.94U (R
post-image
SNDK-0.18%
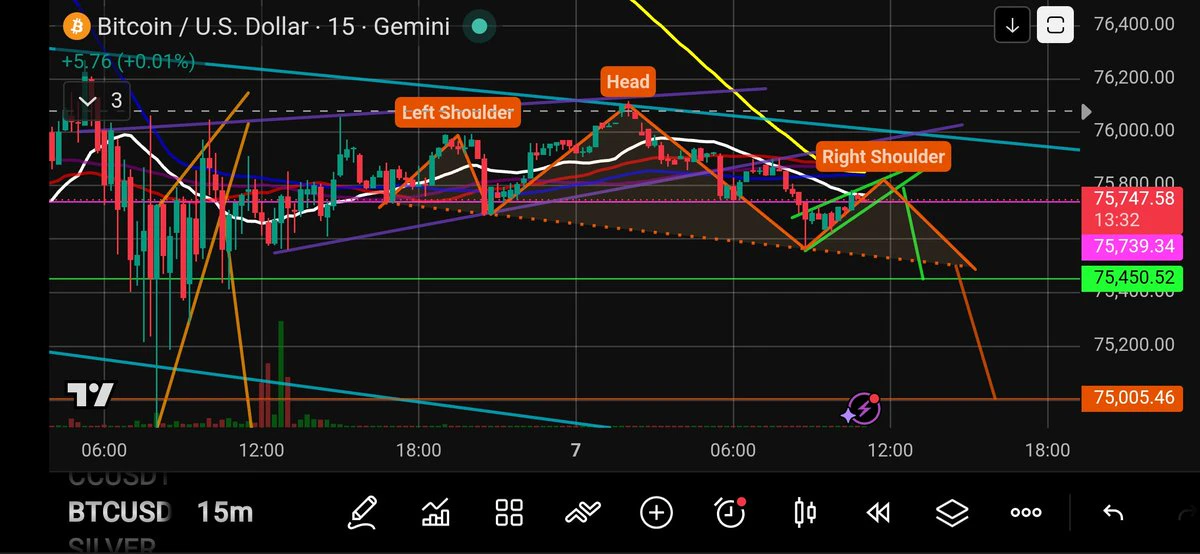
$BTC Rejection Begins! 👀
Now I'll watching this orange head and shoulder reversal pattern forming the right shoulder.
Inside the right shoulder we see a green rising wedge.
The patterns are telling us a bearish story.
Price continues to get chased down by the yellow 15 min 200MA. More bearish confluence.
$BTC Near-Term Bearish Targets 🎯
1) $75,560
2) $75,450 (Approx)
3) $75,000 (Approx)
4) $74,423
Some targets are approximate because the breakdown of the pattern has yet to occur.
NFA, DYOR ⚠️
#Crypto #Trading #BTC
post-image
BTC-0.67%
$COTI After weathering a prolonged, gradual decline, it finally printed a solid 1-hour bullish candle. Buyers pushed the price back above $0.0100 in one go, and buying momentum is clearly returning. The key now is whether it can firmly hold the $0.01021 level. If it does, there’s still room to move higher. The key level to watch is $0.01021—don’t rush to chase the first rally; it’s safer to wait for a pullback to confirm the breakout level is holding before acting. Keep an eye on SNDK as well. $TRUMP Risk warning: The above is only a market observation and does not constitute investment advice
post-image
COTI-2.75%
TRUMP-0.95%
$BTC An $8 billion liquidity wall! Let’s also look at the Bitcoin liquidation map from this angle. We’ve always analyzed it as a bubble chart or heatmap. I’ll be blunt. If the main accumulation zone on the long side rises to $90k, liquidations will exceed $5 billion. That’s a pretty staggering figure, and could even reach $10 billion due to the snowball effect. On the downside, however, liquidations at the $66k level amount to only $3 billion. Yes, proportionally, that’s still a large amount. As for my view, I’ll get straight to the point: I currently think downside liquidations have a greater
post-image
BTC-0.65%
Weekends are the real test, revealing not the market but human nature. U.S. stocks are closed, capital is flowing out, and the market looks like stagnant water—what really torments you at times like this isn’t unrealized losses, but the restless urge that makes you feel “uncomfortable all over if you don’t click the mouse.”
I’ve played Texas hold’em for over a decade, and the most valuable lesson has never been how to win, but how not to lose. Most of the profit at the poker table comes from the junk hands you fold; trading is the same. A low-volume, narrow-range market like this on a weekend
post-image
ETH-1.26%
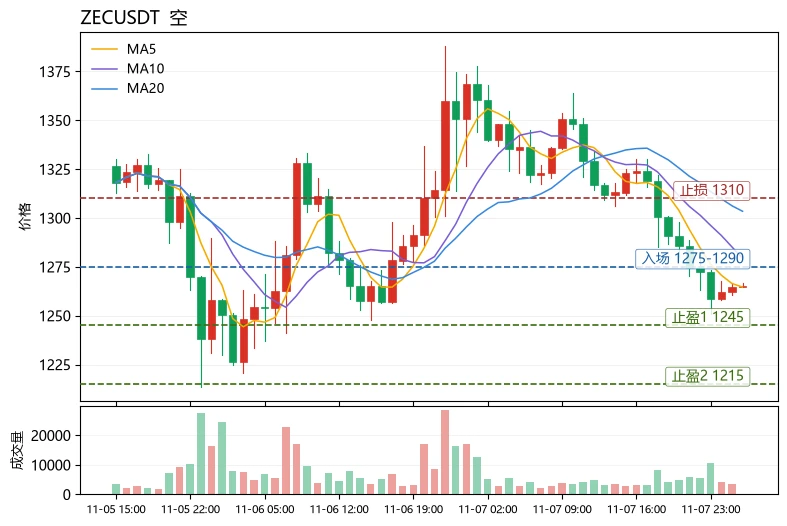
$ZEC Current price: 1265.39. The first resistance above is 1303.45 (MA20), while 1245.75 (lower Bollinger Band) is the line bulls must hold. Price has fallen below MA20 and MA5 has crossed below it; the MACD histogram remains bearish at -6.352, and RSI at 35.6 is nearing oversold territory but has not bottomed. The 10.84% range over 30 candles indicates elevated wick risk. More importantly, the funding rate remains +0.0100%: as the price falls, bulls continue paying to hold their positions, suggesting leveraged longs have not yet been flushed out. Funding favors bears, and chasing longs risks
post-image
eur
eureur
Gate.Fun
MC:$5.55KHolders:3
0.06%
ZEC+1.16%
ADA-1.48%
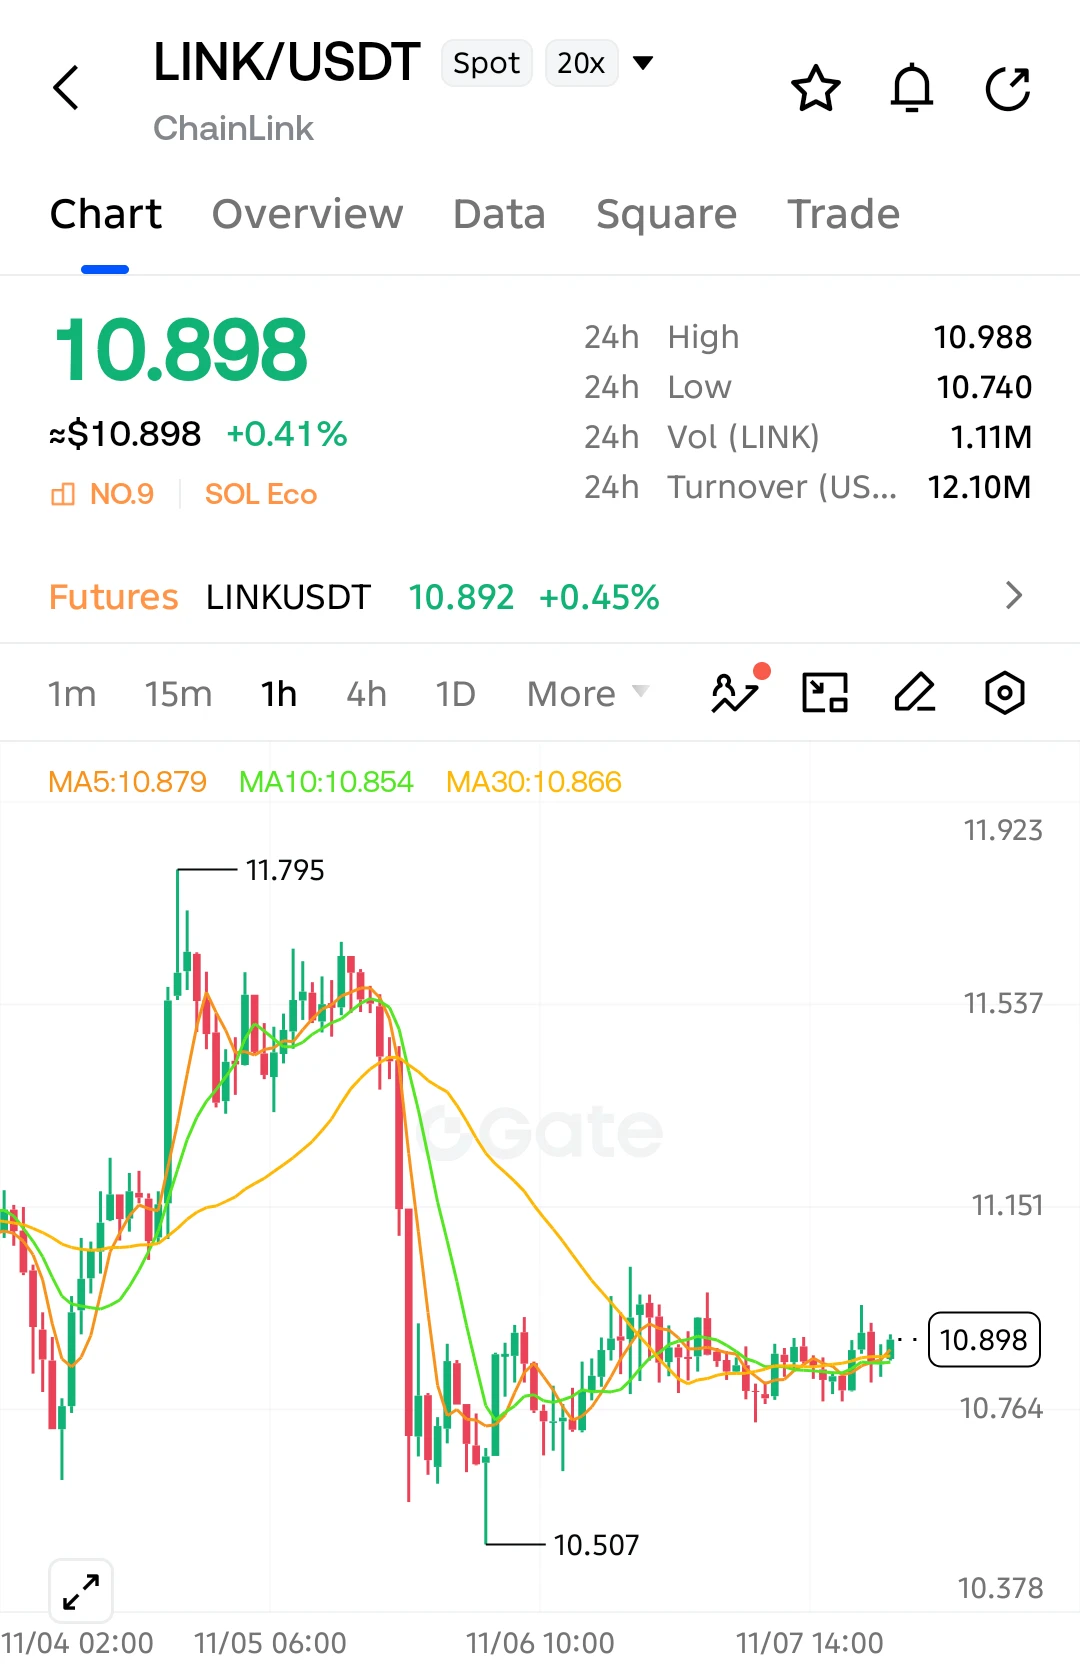
$LINK

Rejected from 11.795, now chopping at 10.898. Price is pinned right at the MAs—tight consolidation after a sharp drop. Break above 10.988 triggers a bounce; failure retests 10.764. Momentum neutral—wait for the close.

Entry Zone: 10.820 – 10.900

TP1: 10.988
TP2: 11.151
TP3: 11.537

Stop-Loss: 10.700

#LINK #ShareWeekly #USAIStocksHitHard #USNonfarmPayrolls #StakeOnLaunchpoolToShare450KVLX
post-image
LINK-0.18%
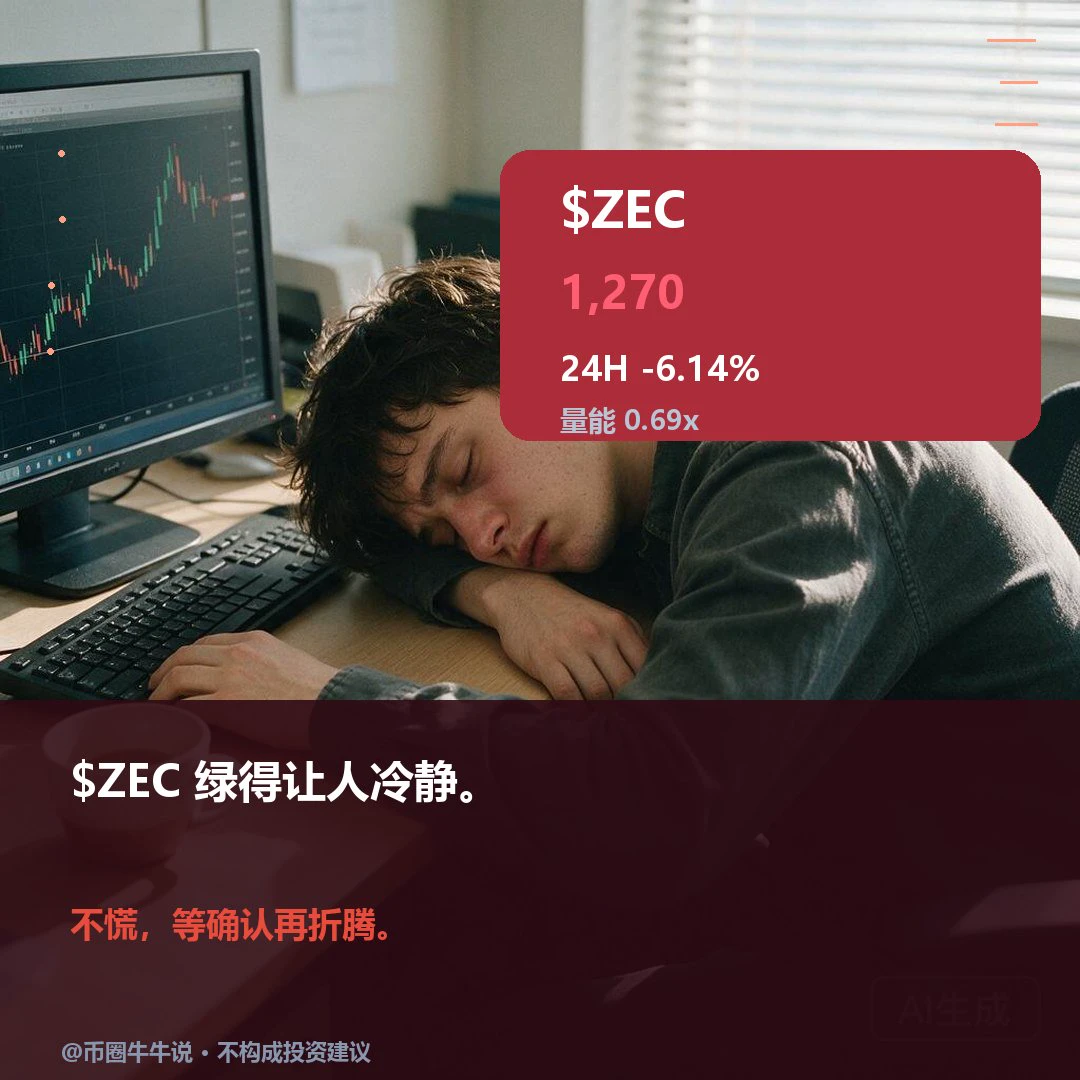
$ZEC Currently at 1270.43, down 6.14% over 24H (range: 1250.67–1364.08). The 1H trend is weak, with RSI at 25.74, price below the EMA20 at 1293.33, and a volume ratio of 0.69. The 4H trend is weak, with RSI at 42.91, price below the EMA20 at 1287.32, support at 1159.00, and resistance at 1387.89. A sustained move above the 1364.08 resistance could signal continuation; a break below the 1250.67 support would weaken the structure. In the review, check whether price holds above 1364.08 and recovers 1250.67; volume is only 0.69x. A hold without volume or failure to recover after a breakdown would
post-image
ZEC+1.16%
Load More

Join 40 M users in our growing community

⚡️ Join 40 M users in the crypto craze discussion

💬 Engage with your favorite top creators

👍 See what interests you

Trending Topics

USAIStocksHitHard

20.78k Views3.67k Discussing

U.S. stocks sold off sharply on Thursday, November 5 (UTC). The Nasdaq closed down around 5.5%, entering correction territory, while the Philadelphia Semiconductor Index plunged roughly 12%, with chip stocks including $NVDA and $AMD posting steep losses. Beyond profit-taking, investors are growing concerned about the pace of AI data center construction, capital spending, and future returns on investment. The key question now is whether the AI sector’s lofty growth expectations need to be repriced. Where do you think the next opportunities will emerge: chip stocks, tech giants, or other sectors?

USNonfarmPayrolls

33.48k Views4.34k Discussing

StakeOnLaunchpoolToShare450KVLX

9.28k Views827 Discussing

View More