Square
Following
Hot
News
Notifications
Profile

MHuy_HCCVenture

vip
No content yet
Peak Tier VIP 31.4 Year(s)
0
Following
17
Followers
148
Liked
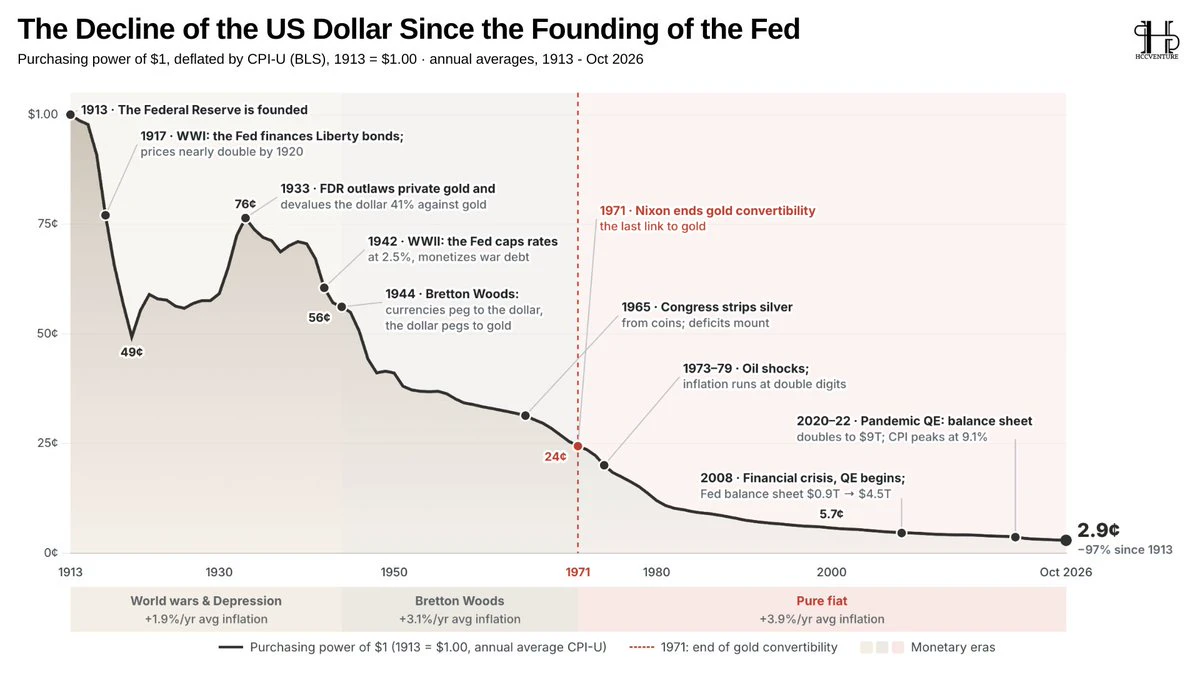
The purchasing power of the US dollar has declined by approximately 97% since the establishment of the Federal Reserve (Fed).
According to the BLS CPI-U data shown in the chart, one US dollar in 1913 would now only be equivalent to about 2.9 cents in purchasing power in October 2026.
The US dollar has lost approximately 97% of its purchasing power over more than a century, a cumulative consequence of inflation over decades, not a decline occurring in a single period.
During the period 1913–1944, the purchasing power of the USD fluctuated significantly through two world wars and the Great Depre
post-image
US-7.23%
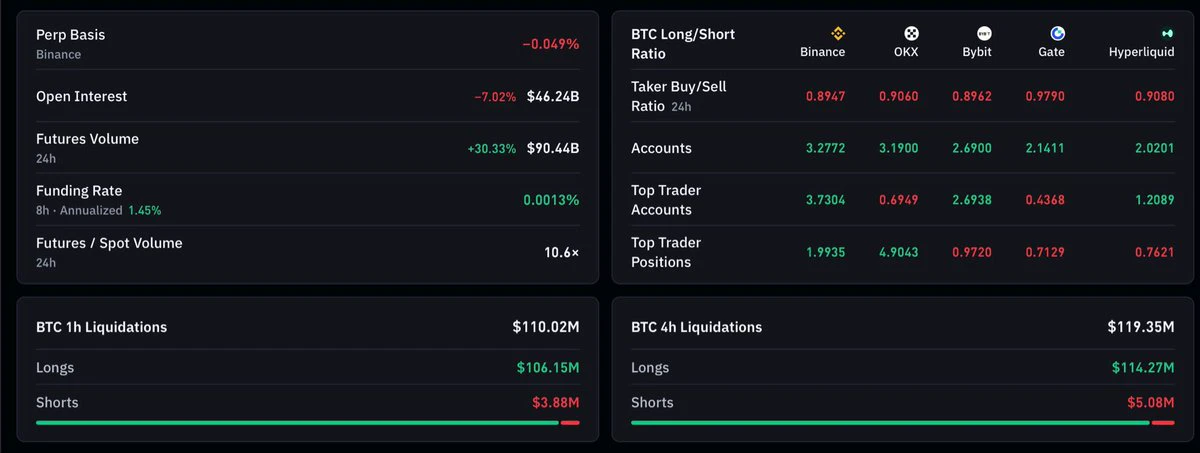
Funding rates on most exchanges are very positive, yet last night, people still opened long positions only to have them liquidated painfully.
In just one night, billions of dollars worth of long positions in the isolated Bitcoin market increased 89 times compared to short positions that were liquidated.
I still don't understand why, when the market is so volatile, people can't just let go of margin positions and derivatives contracts? We have the right to restructure our portfolios for the spot market at a discount, don't we?
For the market to continue growing, it always needs sufficient liqui
post-image
BTC-0.65%
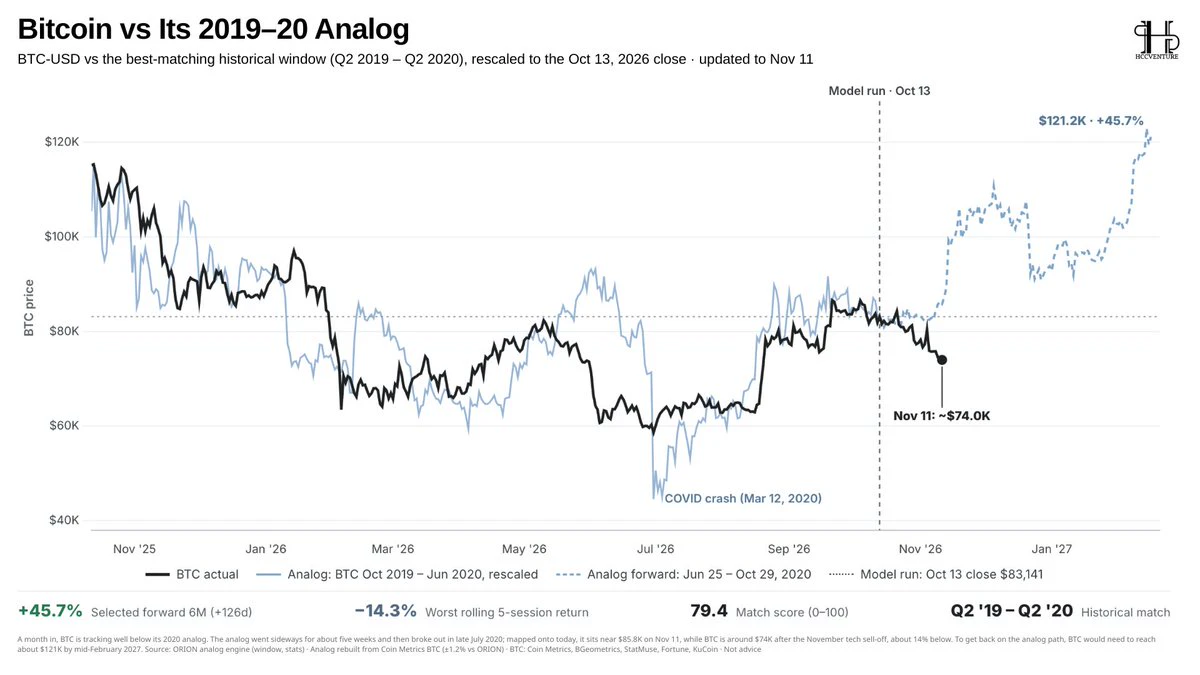
#Bitcoin is deviating from its 2019–2020 cycle trajectory, but the historical analog still leans toward a recovery scenario.
The current Bitcoin benchmark model, comparing the Q2/2019–Q2/2020 period, shows a relatively high degree of similarity, with a Match Score of 79.4/100.
However, actual developments are beginning to diverge: by November 11, 2026, $BTC will be trading around $74,000, approximately 14% lower than the price implied by the analog, which is around $85,800.
Notably, during the chosen historical period, Bitcoin experienced about five weeks of sideways movement before entering a
post-image
BTC-0.67%
  • 2
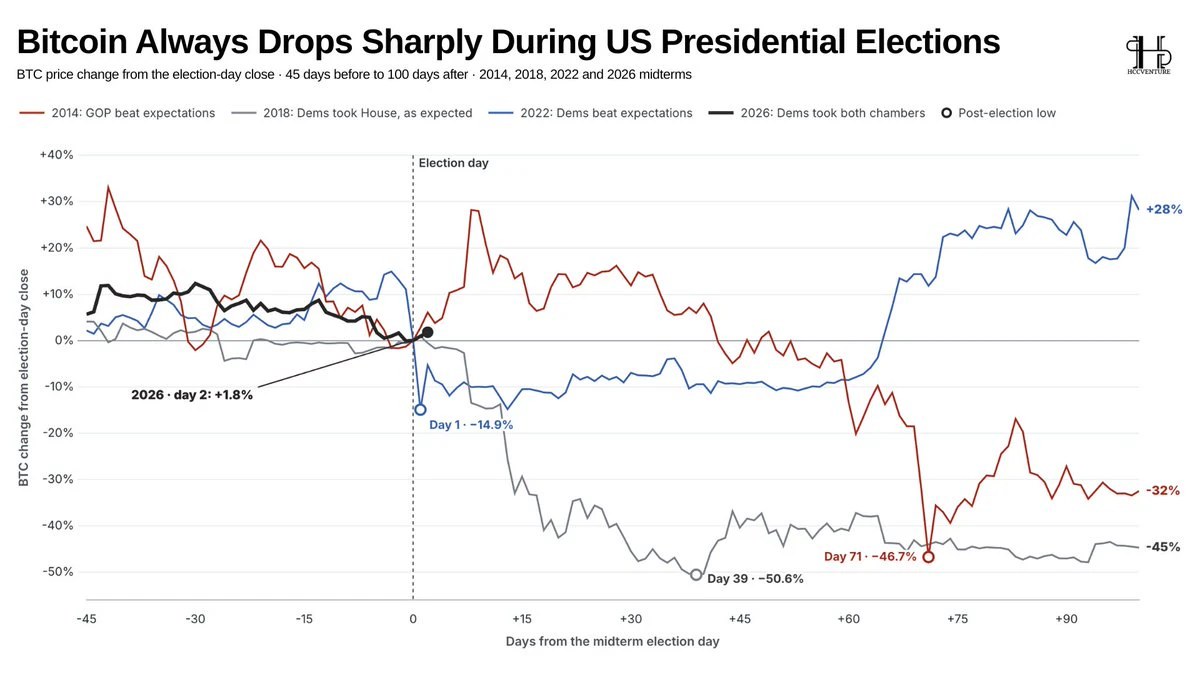
Historical data shows that #Bitcoin has experienced significant corrections after US midterm elections.
In 2014, $BTC experienced its deepest drop of approximately 46.7% in 71 days; in 2018, it recorded a drop of about 50.6% in just 39 days. These two cases demonstrate the risk of prolonged and significant post-election corrections.
However, the events of 2022 offer a different perspective. #Bitcoin fell by about 14.9% on the first day after the election, but then recovered strongly, ending the 100-day period with a gain of approximately 28% compared to the closing price on election day.
For 2
post-image
BTC-0.67%
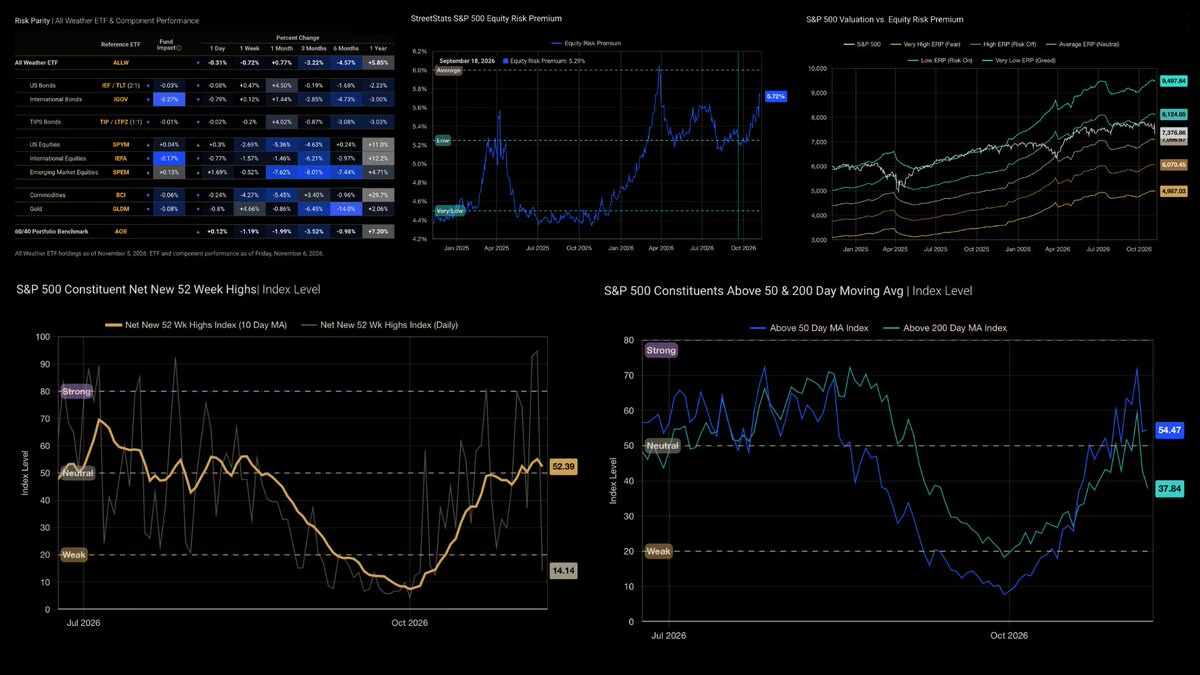
S&P 500: Market breadth is recovering, but risk structure hasn't really improved yet.
Breadth indicators show that the US stock market has recovered significantly from the weakness in early October. The percentage of stocks above the 50-day moving average (MA50) has increased to 54.47%, while the Net New 52-Week Highs Index (10-day MA) has recovered to 52.39 points. This reflects the expanding number of stocks participating in the recovery.
However, the quality of the recovery remains limited. Only 37.84% of S&P 500 stocks are above the 200-day moving average (MA200), indicating that the major
post-image
US500+0.00%
Good morning, Danang city.
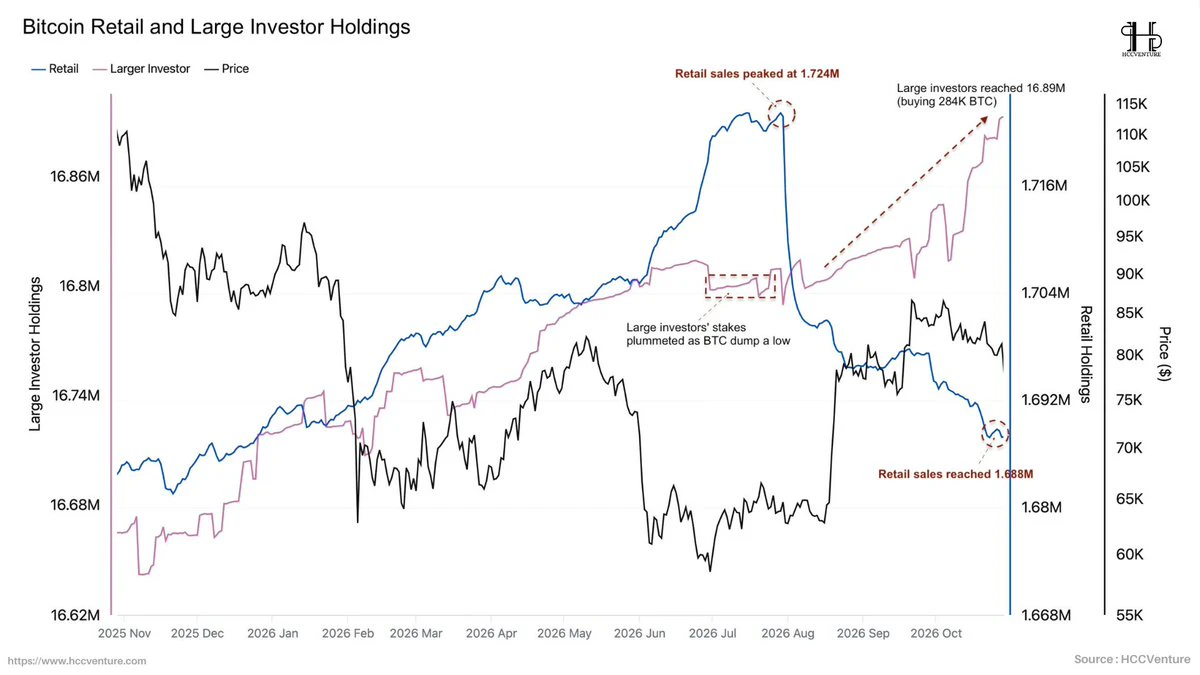
Retail investors are reducing their exposure to #Bitcoin, while large investors continue to expand their positions, a notable shift in $BTC ownership structure.
The supply is shifting towards large investors, creating an increasingly clear divergence between the two groups.
Since July 2026, the amount of Bitcoin held by retail investors has decreased from a peak of 1.724 million $BTC to 1.688 million $BTC, equivalent to approximately 36,000 $BTC, or nearly 2.1%.
This trend reflects a decline in exposure to #Bitcoin among retail investors, possibly due to profit-taking, reduced holdings, or por
post-image
BTC-0.67%
  • 1
I don't want to say anything more about this market, as my team and I at #HCCVenture have been researching it for the past nine months.
Now, just one sentence. Think for yourselves:
"Increasing loss pressure, but supply is shifting towards long-term holdings."
Thank you, thank you to the retail investors and small investors who fled during the recent market crash. You sold me an incredibly "cheap" and "highly promising" asset.
Now it's time for investment funds, whales, and market makers to steer the entire market.
Good luck, short-term investors!
#Gold flows from Hong Kong to China rebound strongly, reaching a 5-month high.
According to data up to September 2026, net gold exports from Hong Kong to mainland China reached 75 tonnes, a significant increase from 58.4 tonnes in August and the highest level since April 2026, when flows peaked at 86.7 tonnes.
Notably, exports have remained above 46 tonnes per month since February 2026, after hitting a low of just 8 tonnes in October 2025.
This indicates that demand for gold in the Chinese market is sustained, rather than stemming from a single transaction.
This development is noteworthy given
post-image
XAU+0.38%
#Bitcoin is the worst-performing asset in terms of risk adjustment since the AI ​​rally in April 2025.
While the Mag 7 and European bank stocks achieved returns of around 42% per year with volatility close to 23%, the S&P 500 recorded around 29% per year with volatility of 13%.
In contrast, #Bitcoin experienced volatility of up to 40% but yielded negative annual returns of approximately 3-4%.
#Bitcoin failed to translate high risk into commensurate returns during the period under review.
Investors had to accept significantly greater volatility than traditional stocks, but the investment result
post-image
#Bitcoin stands out in J.P. Morgan's long-term asset allocation model.
According to the reference chart from J.P. Morgan's 2027 Long-Term Capital Market Assumptions forecast, #Bitcoin is modeled with an expected geometric return of 10% per year and a historical correlation of only 33% with large-cap US stocks.
While large-cap US stocks have an expected return of around 7.5% but a 100% correlation with the reference asset group itself, Bitcoin is at a 33% correlation.
The market is unbalanced with capital flows as investors can access an asset with high growth potential without being entirely d
post-image
BTC-0.67%
Mining stocks continue to outperform base metals in the long term.
The data I've compiled shows that gold and silver mining stocks continue to outperform their base metal prices.
Over the past 12 months, #GDX has risen 18.2% and #GDXJ 12.3%, while spot gold has only increased 2.9%. For silver, #SIL has risen 16.9% and #SILJ 8.9%, compared to a 14.7% increase in spot silver.
This difference reflects the operational leverage characteristic of the mining industry.
As metal prices rise, company revenues can improve faster than mining costs in the short term, thereby supporting profit margins and s
GDX+0.00%
  • 1
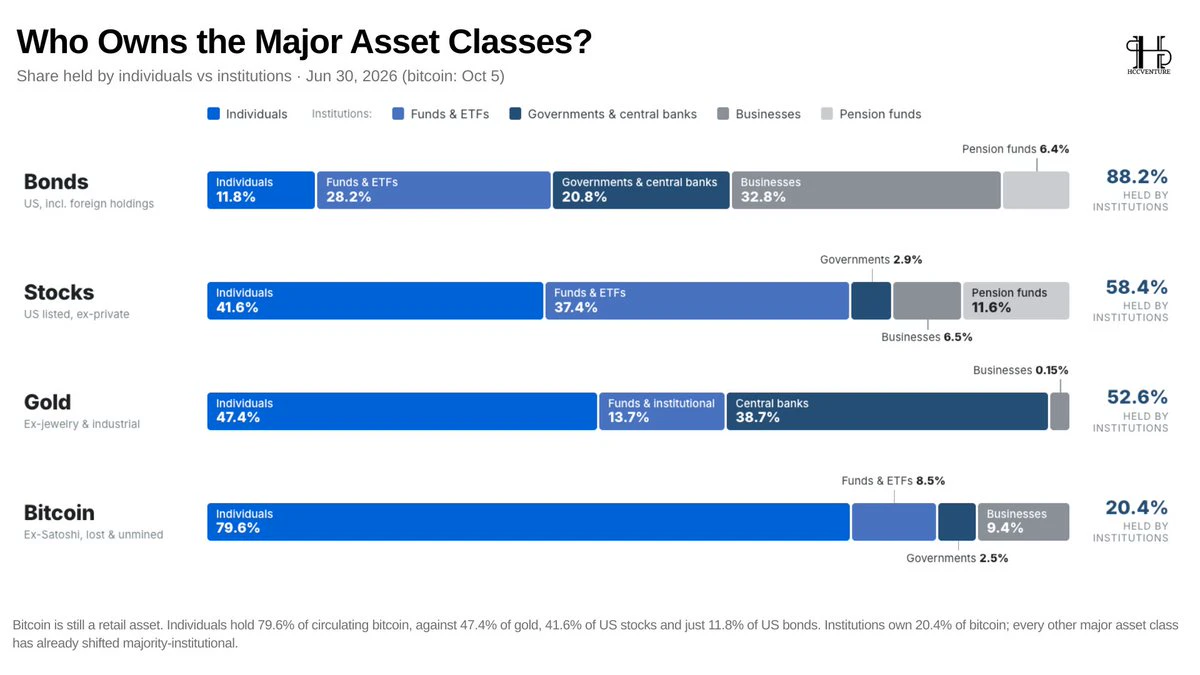
#Bitcoin remains an asset dominated by individual investors, while traditional markets have shifted towards institutional ownership structures.
While 79.6% of #Bitcoin's supply is held by individual investors, this figure is 47.4% for gold, 41.6% for US stocks, and only 11.8% for US bonds.
Notably, institutions currently hold 88.2% of US bonds, 58.4% of stocks, and 52.6% of gold, but only about 20.4% of #Bitcoin according to the chart's classification method.
As #Bitcoin becomes increasingly integrated into the financial system through ETFs, managed investment products, and balance sheet asset
post-image
BTC-0.67%
  • 1
Large Investors Still Hold Gold Below Optimal Allocation Levels
Survey data for 2025-2026 shows that the actual gold weighting in the portfolios of many institutional investors and asset managers remains significantly lower than the optimal allocation levels according to research models.
The largest gap is seen in Family Offices and US Investment Advisors, indicating that gold has not yet become a sufficiently large component in the portfolio structure of many professional investors.
This allocation gap reflects the room for portfolio restructuring, especially as gold is increasingly considere
Trading of Some Stocks Has Outpaced Trading on US Exchanges
Trading activity for tokenized equities on Solana is reaching a significant scale compared to trading volume on US stock exchanges.
VIDA Global's cumulative trading volume on Solana is 7.82 times that of traditional exchanges, while Palatin Technologies is approximately 2.07 times. With 1-800-FLOWERS, this ratio is approaching equilibrium, equivalent to 99.7%.
This indicates that tokenized equities are no longer just about putting stocks on the blockchain, but are beginning to form an alternative trading channel with global reach and
post-image
SOL-0.77%
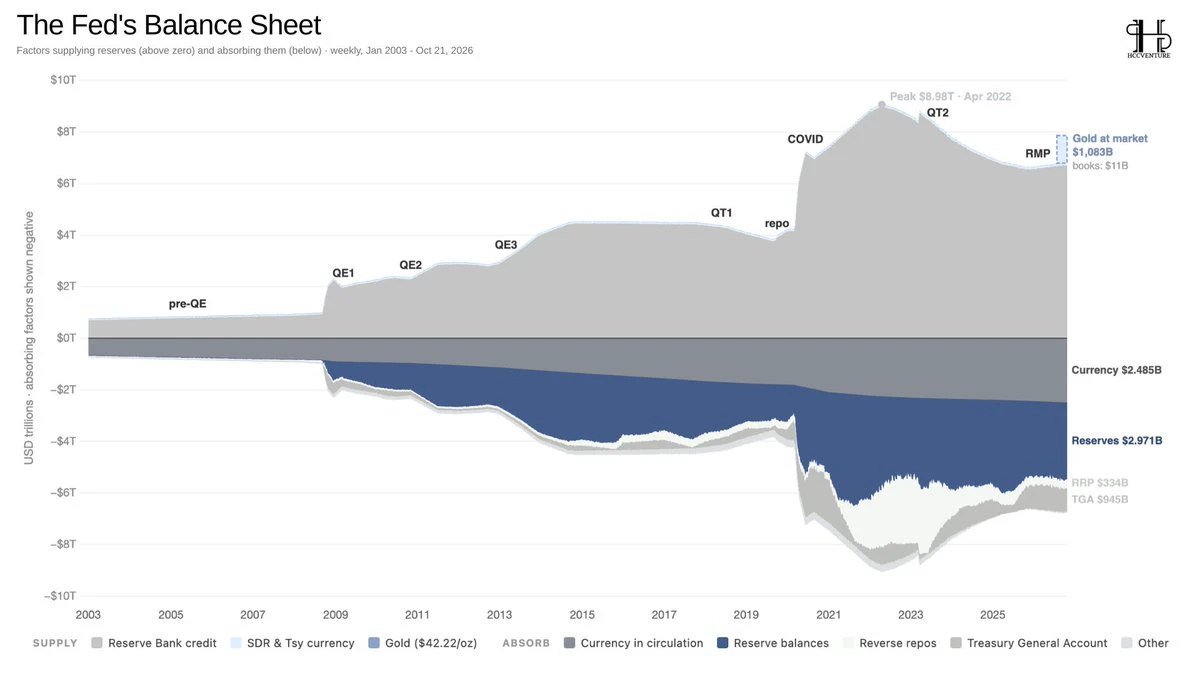
System liquidity remains under pressure even after the end of the fiscal year.
The Fed's balance sheet shows that the liquidity structure has changed significantly since the pandemic. After peaking at nearly $8.98 trillion in April 2022, the Fed's asset size has shrunk, while reserve-absorbing assets such as circulating cash, bank reserves, and TGAs continue to account for a large proportion of the balance sheet structure.
It is noteworthy that the end of the fiscal year does not mean that liquidity will immediately expand.
Even if the Fed slows down or stops shrinking its balance sheet, actua
post-image
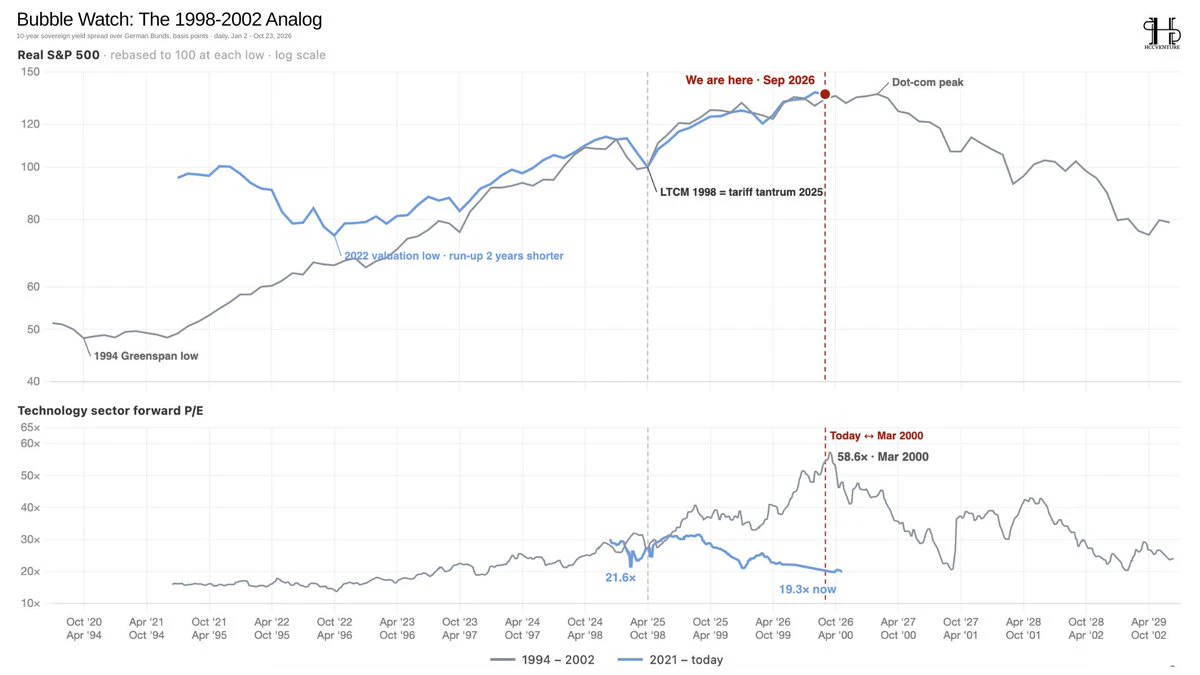
The market is approaching valuation levels reminiscent of the Dot-com bubble.
Comparing the 2021–2026 US stock market cycle to the 1994–2002 cycle reveals a striking similarity: the S&P 500 has recovered strongly from its 2022 valuation lows and is approaching the peak of the Dot-com cycle, while technology sector valuations have not yet reached the extreme levels of March 2000.
According to the data on the chart, the forward P/E ratio for the technology sector is currently around 19.3 times, significantly lower than the 58.6 times at the Dot-com peak.
However, the fact that the stock index is
post-image
US500+0.00%
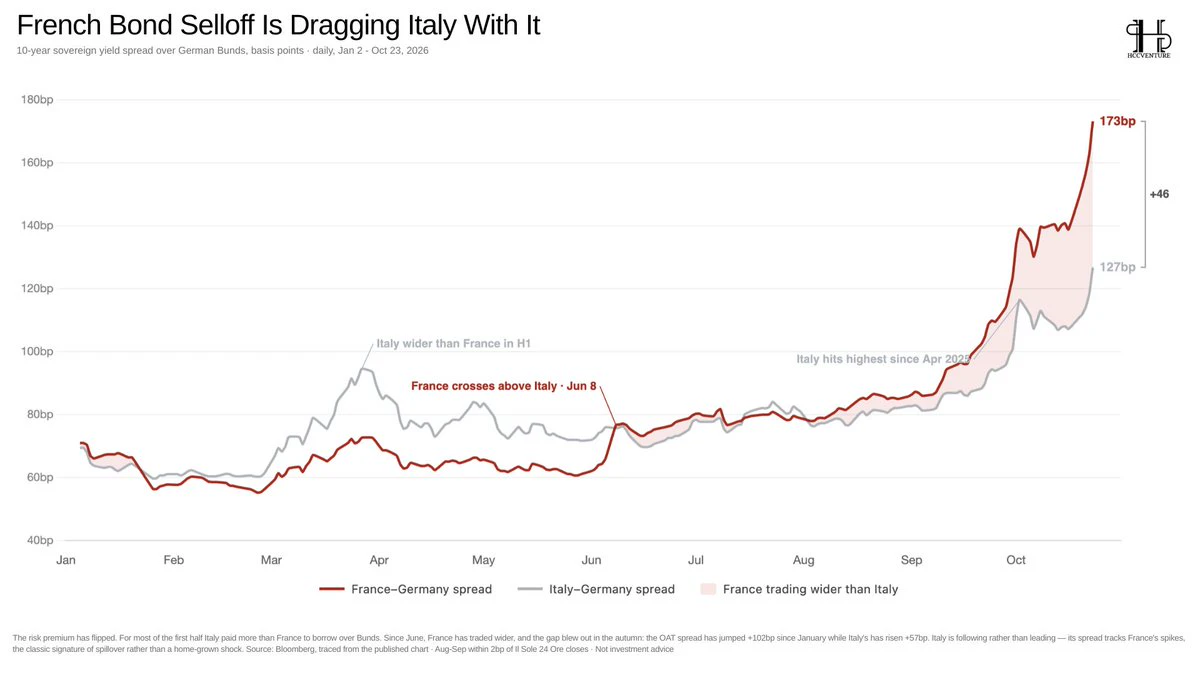
Pressure on French bonds is spreading to Italy, with the yield spread between 10-year French and German government bonds widening to 173 basis points, surpassing Italy's 127 basis points.
A notable reversal: France, which had a lower spread than Italy for much of the first half of the year, is now becoming a greater source of pressure on the eurozone bond market.
As investors demand a higher risk premium for holding French bonds, volatility could spill over into Italy through the re-pricing of public debt risk, market sentiment, and the cost of raising capital. The sharp increase in Italy's sp
post-image
BTC-0.67%
  • 1
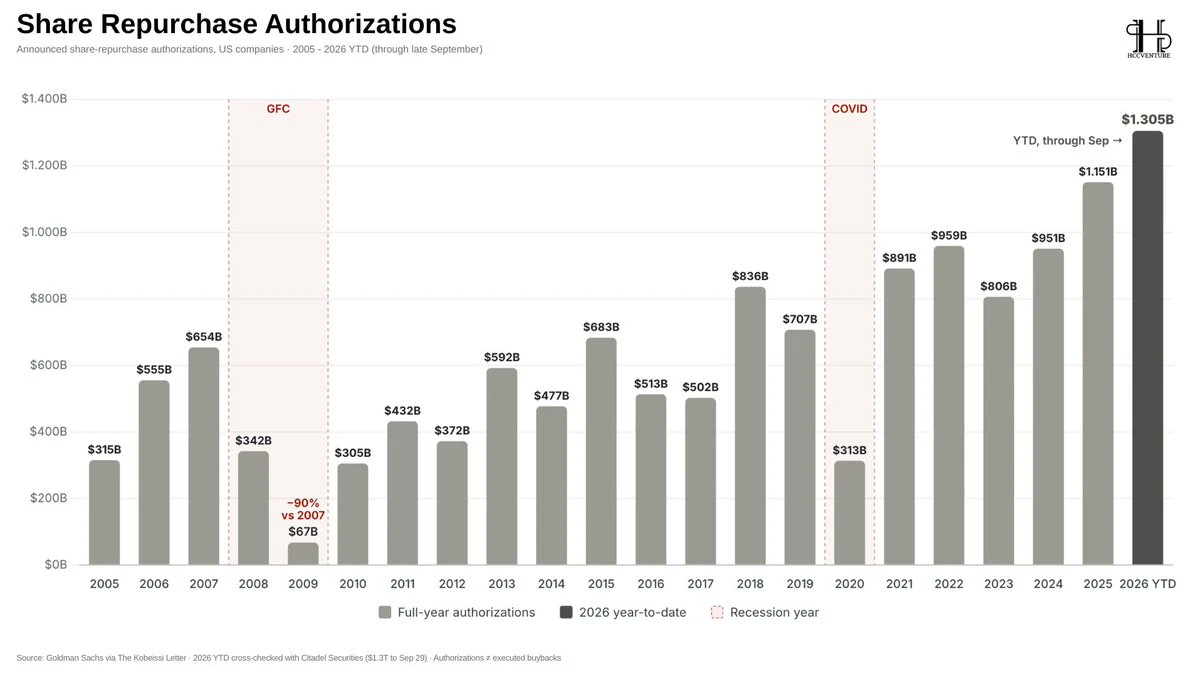
US companies are expanding buyback programs, a signal of cash flow and confidence in valuations.
US share repurchase programs are reaching new record sizes, with total share repurchase authorizations for 2026 reaching $1.305 trillion as of the end of September, surpassing the $1.151 trillion for the whole of 2025.
-> Businesses are continuing to allocate significant resources to return capital to shareholders, despite uncertainties about interest rates and asset valuations.
However, we have experienced two major shocks to the financial markets:
(1) During the global financial crisis, the value
post-image
Load More