






#USConsumerSentimentNearRecordLow #ShareWeekly
Sentiment says recession-like gloom, while spending says business as usual. Which one do risk assets listen to? Here’s how I’d sort it.
1. The reading in context
The final October read was 48.0, down 0.1 from September’s 48.1 and the second-lowest on record, 3.2 points above May’s low of 44.8 (my math). It came in above the 46.3 consensus, so it’s a “less bad” beat. The survey’s director said sentiment is 10% below a year ago and 15% below February, before the Middle East conflict.
2. The split inside the number
Current conditions fell 8.3% to 46.7, while expectations rose 5.4% to 48.8. Households are hurting now but expect a little relief. The more important part for markets is inflation: one-year expectations rose to 4.7% (3.4% in February) and five-year expectations to 3.5%, both the highest since May. Against September CPI of 3.7%, households expect inflation about 1.0 point higher than what was just printed (my math).
3. Sentiment vs. spending
Consumer spending rose 0.9% in August, and GDP held up through the summer. So the drag from weak confidence is a risk, not yet a fact. I treat sentiment as a mood and spending as the vote. Moods matter when they turn into votes, and one report noted buying conditions for durable goods hit a record low (single-source), which is where I’d look first.
4. Why risk assets care
Weak sentiment and high inflation expectations put the Fed in a bind. The Fed meets on October 28, two days from now, after hiking to 3.75%–4.00% in September. A strong spending print keeps hike risk alive, and a weak one hits earnings. Neither is cleanly bullish for risk assets.
5. Cross-asset map (levels from my screenshots)
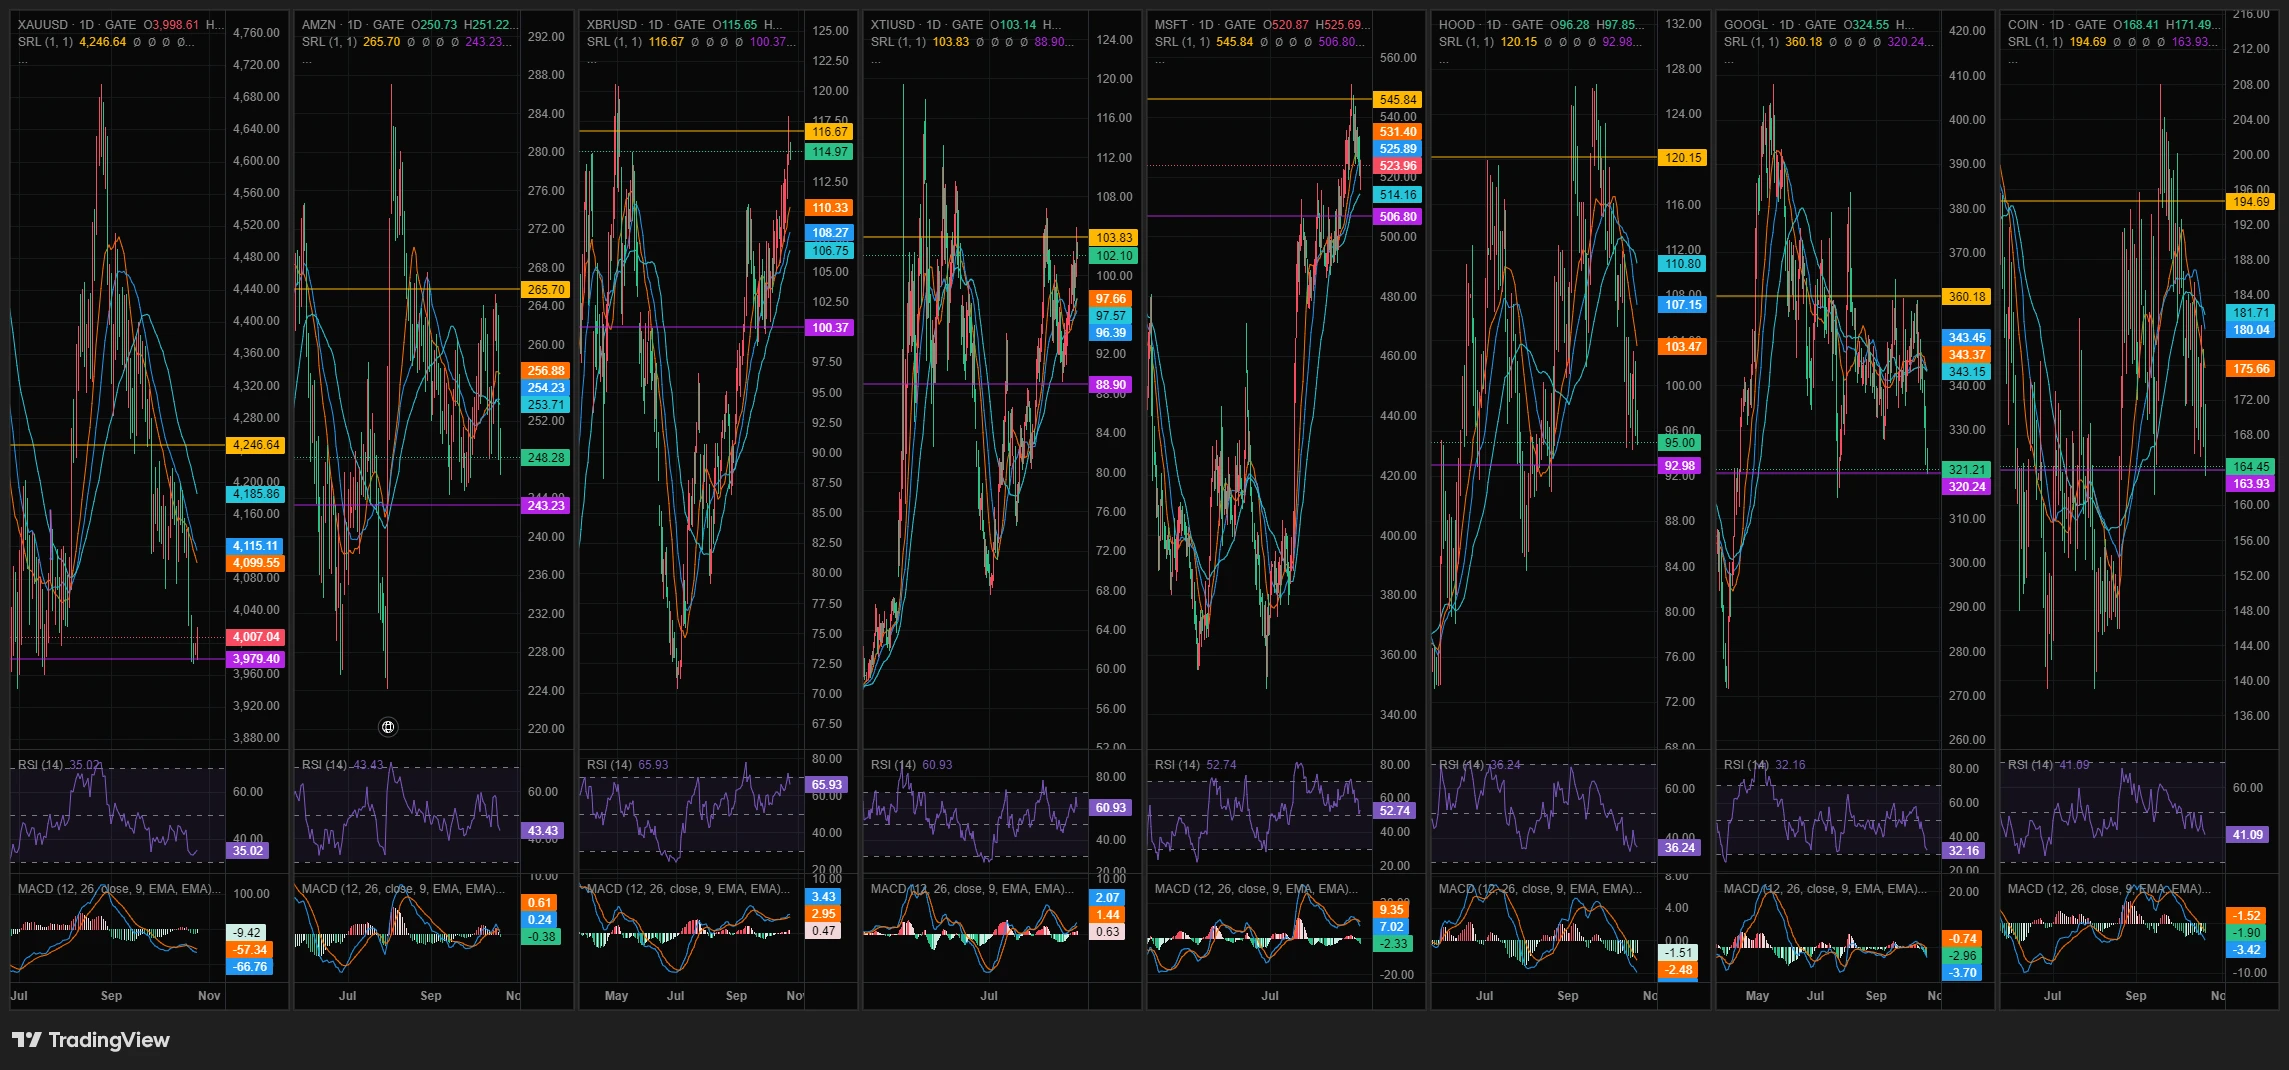
Oil: Brent at 114.97 and WTI at 102.10, RSI 65.9 and 60.9, both pressing resistance. That’s the cost side of weak sentiment.
Consumer-linked names: AMZN at 248.28 has RSI 43.4 and sits 2.0% above support (243.23). HOOD at 95.00 has RSI 36.2, 2.1% above support. COIN at 164.45 has RSI 41.1, 0.3% above support.
Defensive megacaps: AAPL at 347.72 has RSI 64.0, just 0.5% below resistance at 349.54.
Gold: 4,007 sits 0.7% above support at 3,979, with RSI 35.0.
My read is that the market is paying for defensiveness and punishing consumer-sensitive risk.
6. BTC (levels from my screenshot)
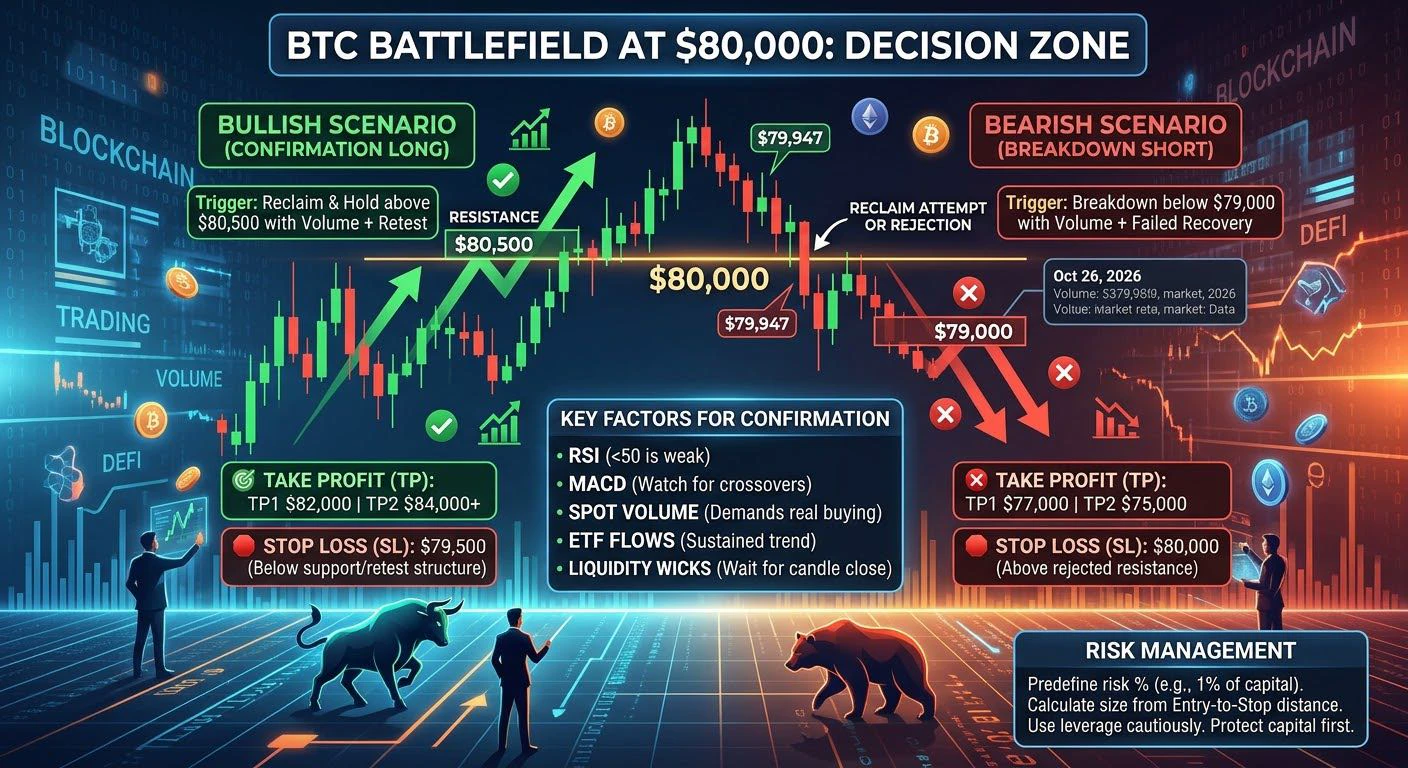
BTC is 79,994, sitting 0.1% above support at 79,880.
50-day at 81,808: +2.3%
Resistance at 84,178: +5.2%
My marked levels at 77,020 (-3.7%) and 75,500 (-5.6%), with the 99-day at 75,720 (-5.3%)
200-day at 72,994: -8.8%
RSI is 41.3, and MACD is below its signal line
A daily close below 79,880 puts 77,020 next. A reclaim of the 50-day would be the first sign that macro fear is easing.
My take: low sentiment alone doesn’t sink markets. What matters is whether it turns into weaker spending, or keeps inflation expectations high enough to hold the Fed hostage. I’m watching the Fed on the 28th, the PCE data, and 79,880.
Not financial advice.
Do you think weak sentiment will show up in spending data, or is the consumer still the economy’s anchor? And is your line on BTC 79,880 or 84,178?
@Gate_Square
Sentiment says recession-like gloom, while spending says business as usual. Which one do risk assets listen to? Here’s how I’d sort it.
1. The reading in context
The final October read was 48.0, down 0.1 from September’s 48.1 and the second-lowest on record, 3.2 points above May’s low of 44.8 (my math). It came in above the 46.3 consensus, so it’s a “less bad” beat. The survey’s director said sentiment is 10% below a year ago and 15% below February, before the Middle East conflict.
2. The split inside the number
Current conditions fell 8.3% to 46.7, while expectations rose 5.4% to 48.8. Households are hurting now but expect a little relief. The more important part for markets is inflation: one-year expectations rose to 4.7% (3.4% in February) and five-year expectations to 3.5%, both the highest since May. Against September CPI of 3.7%, households expect inflation about 1.0 point higher than what was just printed (my math).
3. Sentiment vs. spending
Consumer spending rose 0.9% in August, and GDP held up through the summer. So the drag from weak confidence is a risk, not yet a fact. I treat sentiment as a mood and spending as the vote. Moods matter when they turn into votes, and one report noted buying conditions for durable goods hit a record low (single-source), which is where I’d look first.
4. Why risk assets care
Weak sentiment and high inflation expectations put the Fed in a bind. The Fed meets on October 28, two days from now, after hiking to 3.75%–4.00% in September. A strong spending print keeps hike risk alive, and a weak one hits earnings. Neither is cleanly bullish for risk assets.
5. Cross-asset map (levels from my screenshots)
Oil: Brent at 114.97 and WTI at 102.10, RSI 65.9 and 60.9, both pressing resistance. That’s the cost side of weak sentiment.
Consumer-linked names: AMZN at 248.28 has RSI 43.4 and sits 2.0% above support (243.23). HOOD at 95.00 has RSI 36.2, 2.1% above support. COIN at 164.45 has RSI 41.1, 0.3% above support.
Defensive megacaps: AAPL at 347.72 has RSI 64.0, just 0.5% below resistance at 349.54.
Gold: 4,007 sits 0.7% above support at 3,979, with RSI 35.0.
My read is that the market is paying for defensiveness and punishing consumer-sensitive risk.
6. BTC (levels from my screenshot)
BTC is 79,994, sitting 0.1% above support at 79,880.
50-day at 81,808: +2.3%
Resistance at 84,178: +5.2%
My marked levels at 77,020 (-3.7%) and 75,500 (-5.6%), with the 99-day at 75,720 (-5.3%)
200-day at 72,994: -8.8%
RSI is 41.3, and MACD is below its signal line
A daily close below 79,880 puts 77,020 next. A reclaim of the 50-day would be the first sign that macro fear is easing.
My take: low sentiment alone doesn’t sink markets. What matters is whether it turns into weaker spending, or keeps inflation expectations high enough to hold the Fed hostage. I’m watching the Fed on the 28th, the PCE data, and 79,880.
Not financial advice.
Do you think weak sentiment will show up in spending data, or is the consumer still the economy’s anchor? And is your line on BTC 79,880 or 84,178?
@Gate_Square