Share your thoughts
placeholder
Article
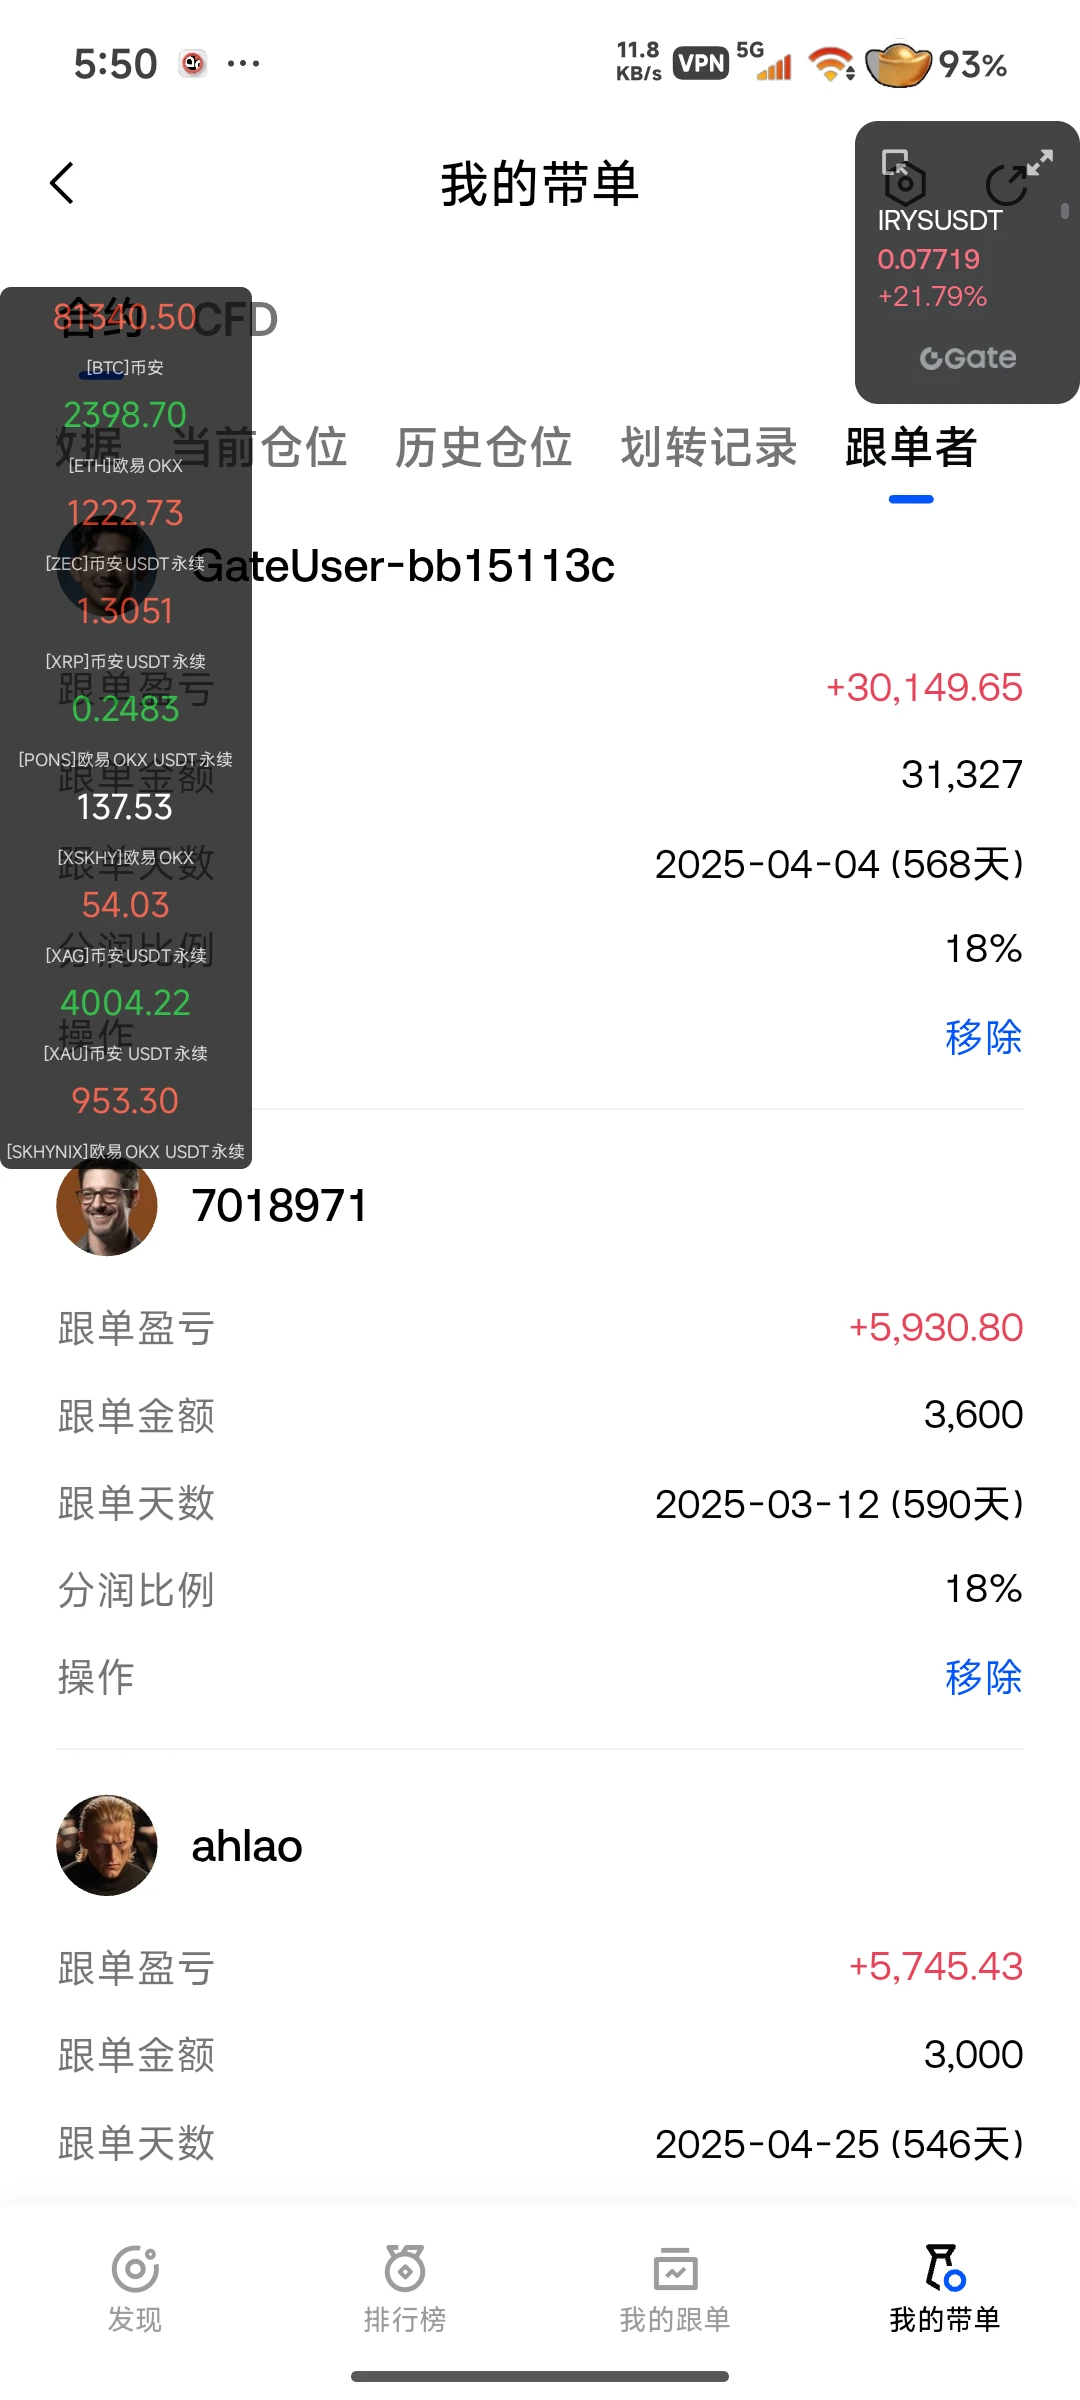
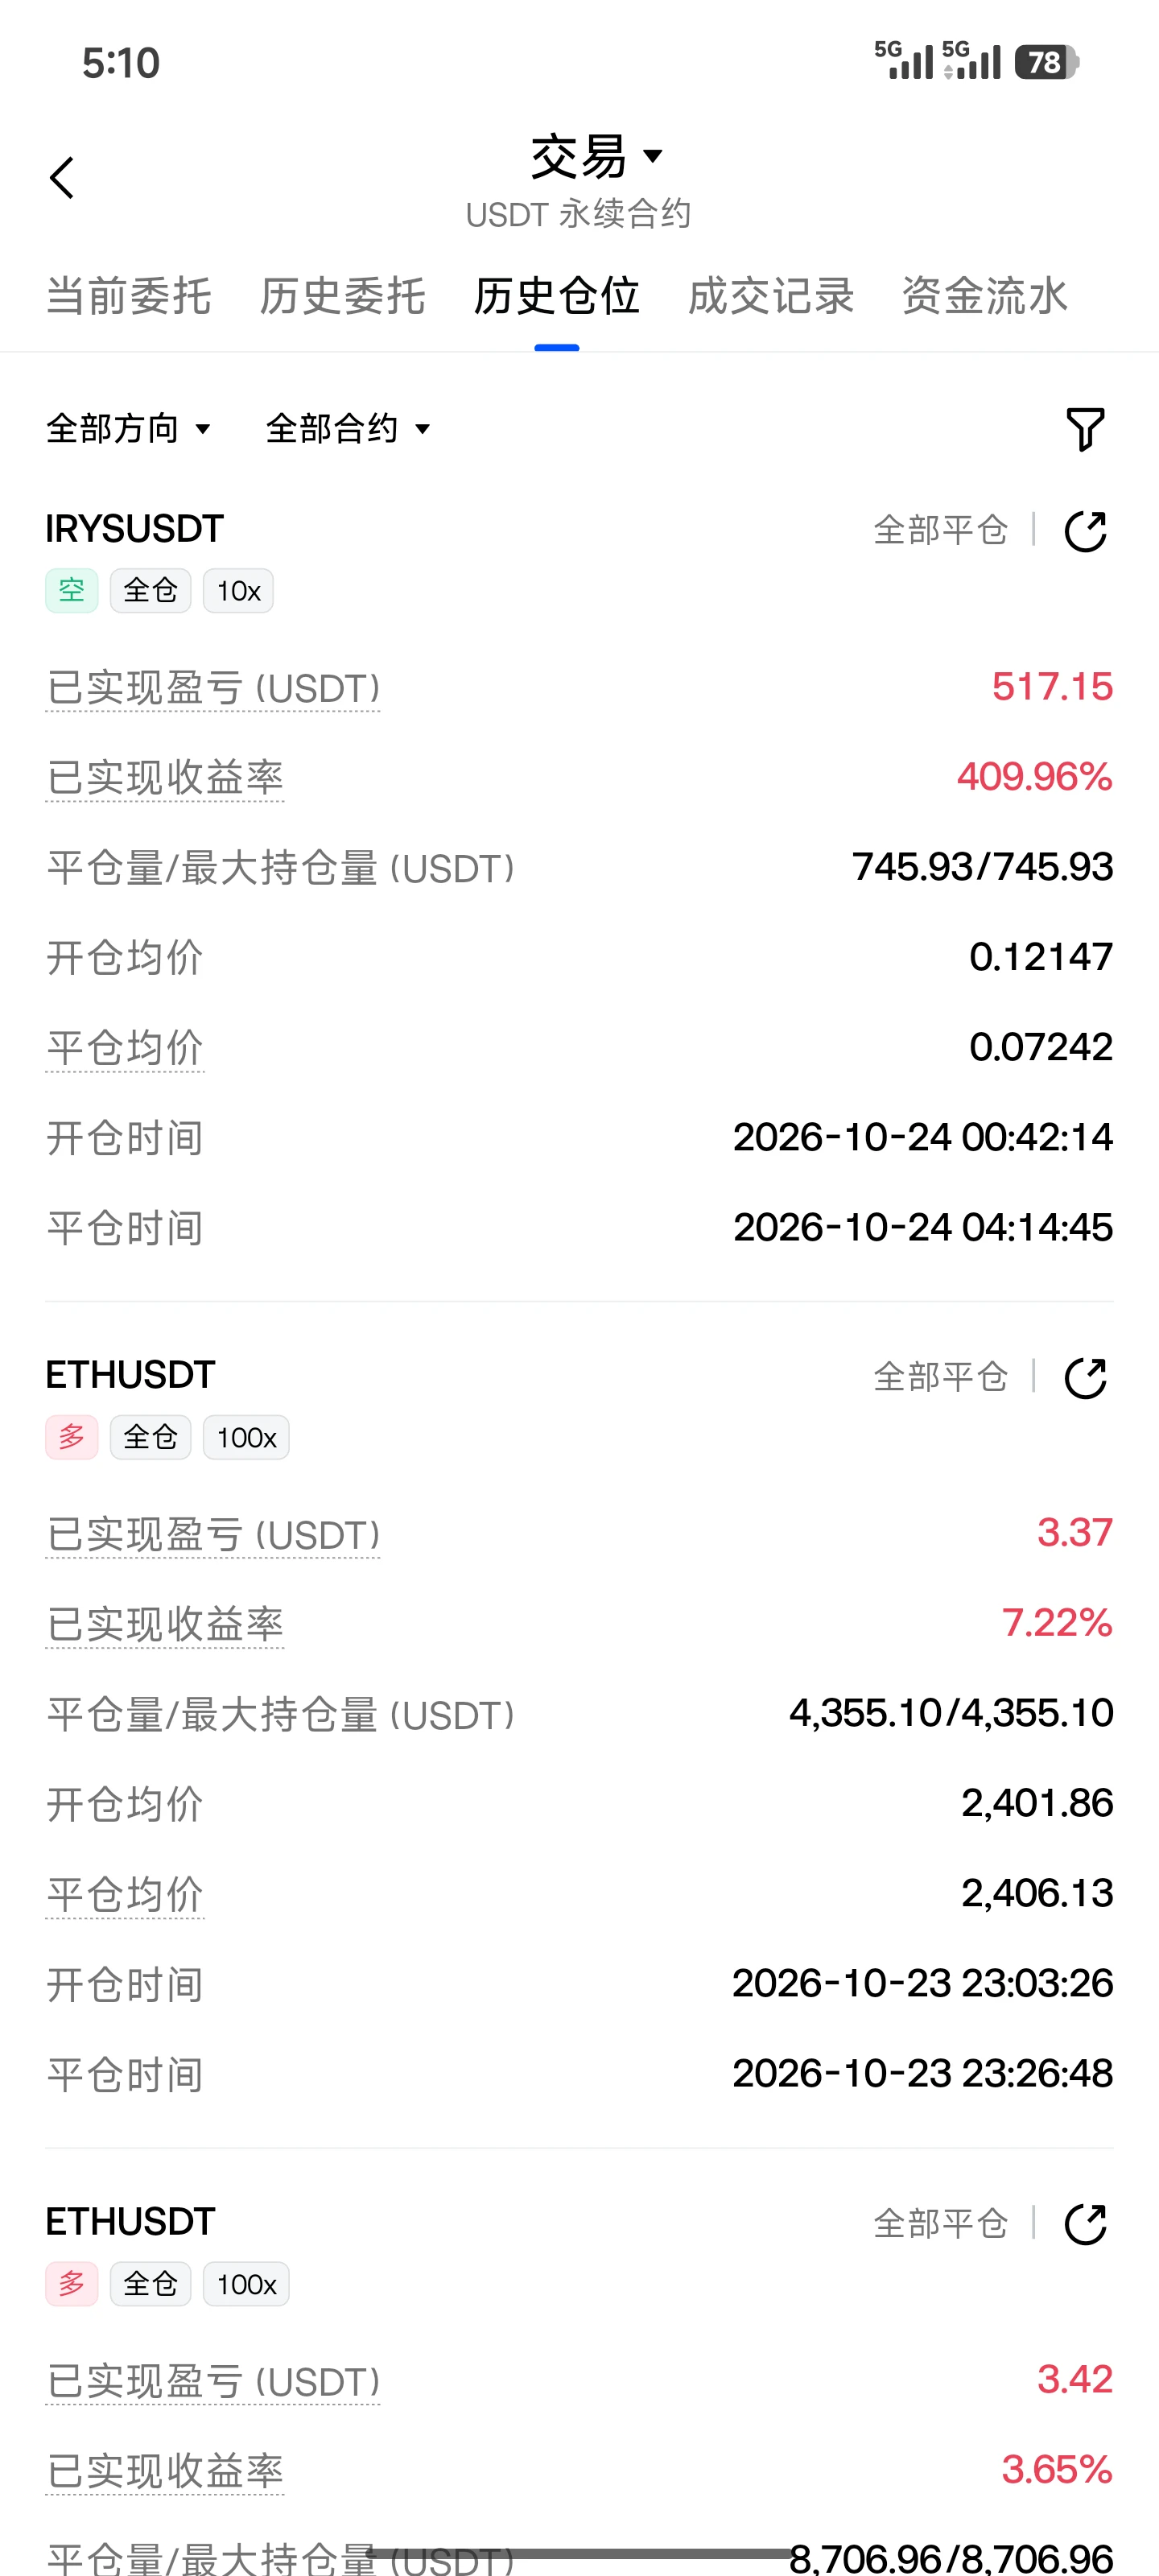
#Share My Futures Return#
Quickly take my pocket money; I’ll close it, okay, bro☕🐂🀄
post-image
  • 3
  • 1
Prince/9/17‖ETH‖Analysis Summary
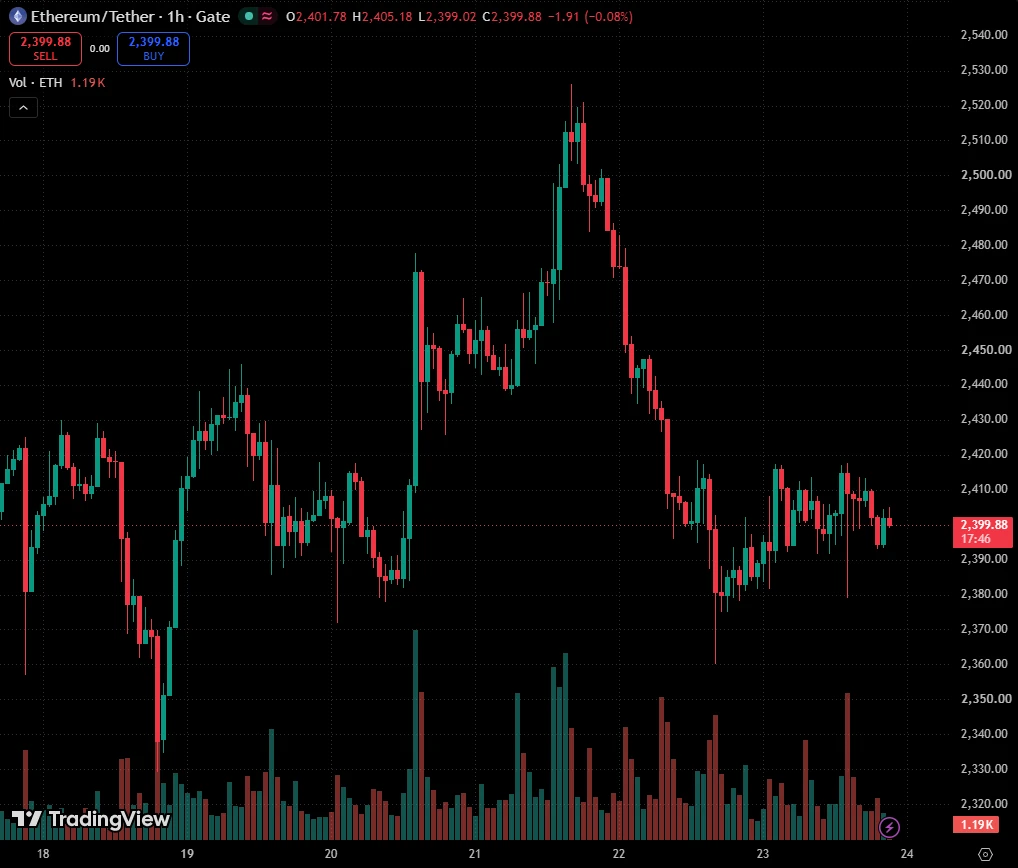
ETH saw an intraday volatile session that first weakened and then rebounded. In the early session, affected by external macro expectations and heightened risk aversion, it once dipped to an intraday low near 2366. As capital entered to provide support at lower levels, the price subsequently climbed amid volatility, currently returning to around 2467, with the intraday decline narrowing to a slight loss.
Market highlights:
1. Technical pattern: From the chart, ETH showed relatively strong short-term support around 2360. It quickly recovered after the sharp drop
post-image
ETH+3.49%
I’m back again!
The U.S. Dollar Index failed to break above 100.4, retraced to the 50% level on the one-hour timeframe at its lowest point, and then continued to rebound. Therefore, as long as it cannot rise above 100.4, the low of its next pullback should be lower than that of this pullback. In other words, as long as it fails to hold above 100.4, the U.S. Dollar Index will move sideways to the downside.
Conversely, gold’s pullback levels will become increasingly higher each time. As long as it fails to hold firmly above 100.4, gold will move in a sideways-to-upward pattern.$XAUUSD Personal
XAUUSD+2.34%
  • 10
The pain of being deeply trapped in a position is something only those who have been there understand: watching the market all day, your emotions rising and falling with every move, then lying awake at night with unrealized losses and costs running through your mind. Regretting the impulse to chase highs, hating yourself for hesitating to cut losses, watching your position sink deeper and deeper until you no longer even dare to trade.
“Building a position is easy, getting out of one is hard,” but being trapped is not frightening; what is frightening is losing your composure and discipline. A t
post-image
BTC+1.52%
ETH+3.49%
$XRP Current price 1.3045, 24h +2.92%, trading volume 234.9M USDT. MA5=1.3044 has just moved above MA20=1.2999, RSI=52.6 is neutral, the MACD histogram at +0.001632 has turned bullish, the funding rate is -0.0000%, and the Fear & Greed Index is 50, neutral. The data indicates that the trend is in a “weak bullish recovery” phase rather than an acceleration phase.
Here, via $XRP , is a reusable chart-reading method: use moving-average alignment to assess trend health. A healthy bullish trend does not mean the farther the price is from the moving averages, the better; rather, after MA5 crosses a
post-image
XRP+3.20%
WLD+6.53%
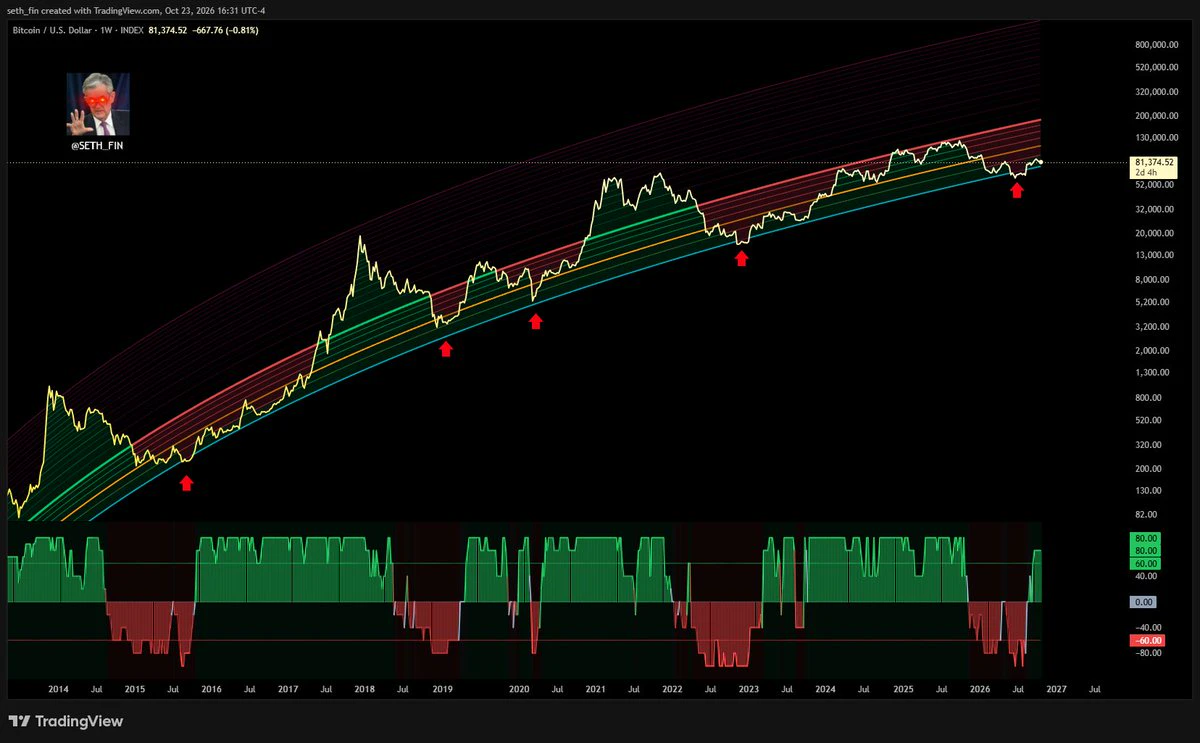
Bitcoin’s chart is showing a fairly unusual movement right now.
It’s compressing quite a bit; it looks like a big move is coming.
post-image
BTC+1.52%
Behind Paradigm disclosing its ZEC holdings and ZEC hitting a new high, I smell distribution? Guys, ZEC hit another all-time high today, briefly reaching $1,388. It’s up 160% in a month and 25x in a year—those figures would make anyone stop and stare. The NU7 upgrade vote has just passed, with 99.9% of voters agreeing to cut block times from 75 seconds to 25 seconds. Paradigm has also publicly acknowledged holding ZEC, while the ETF’s assets look set to approach $1 billion. But let’s read the charts. Yesterday’s candle surged on heavy volume before pulling back to close lower, then rallied aga
post-image
ZEC+16.57%
DASH+10.66%
Base DeFi TVL Just Hit $5.7 Billion.
post-image
I had already finished complaining to my friends about this week’s market action, but now I have to take it all back—kind of awkward. A few nights ago, before bed, I watched $JCT bounce. Every push upward fell just short, with insufficient buying support, so I chose the short side and warned against chasing longs.
When I opened the charts this morning, from 0.002429 to 0.001608, the +825.8% profit was handed straight to me. Nailed it. That bite of meat went down nicely.
I’d rather miss a limit-up move than catch a falling knife and end up covered in blood.
Being out of the market is not a sin
post-image
JCT+8.57%
ZEC+16.37%
SOL+4.57%
#ArcEcosystemAndMemeCoinsPlunge 🚨 THE ARC ECOSYSTEM IS UNDER PRESSURE — AND MEME COINS ARE FEELING IT FIRST.
Crypto markets are once again demonstrating one of their oldest lessons:
When liquidity disappears, narrative-driven assets can reprice faster than almost anything else.
The latest weakness across the Arc ecosystem and meme-coin segment is therefore bigger than a simple red candle.
It is a reminder that markets built around momentum, speculation and rapidly changing narratives can experience extremely sharp reversals when traders begin reducing risk.
#ArcEcosystemAndMemeCoinsPlunge
The
post-image
$BTC From the Market Update video that I posted this morning..... Lets see if the bulls can clean up the rest of the contract inside tha box OR do we drop from here to the red line?
post-image
BTC+1.52%
Liquidity isn't just cash. It is the ability to make a decision later.
When markets fall, not every investor has the same options: some are fully invested, while others have preserved room to act.
That is where the hidden value of liquidity appears.
An investor who is fully positioned may need to sell an existing position before taking advantage of a new opportunity.
Liquid capital creates another option:
Wait.
Evaluate.
Act if necessary.
That's why viewing the stablecoin market simply as “parked money” can be incomplete.
The total stablecoin market is now around $290.6 billion, highlighting h
post-image
xxx40xxx
Seeing a 10% APY doesn't necessarily mean you are actually earning 10%.
The headline yield and the return you ultimately keep are not always the same thing.
Fees, token prices, inflation, depeg risk and platform risk can all change the final result.
For example, if part of a high APY is paid in a platform token, a decline in that reward token can reduce the effective return.
A better framework is:
Nominal APY
– fees
– realized losses
– asset/depeg risk
= a more realistic return.
With the stablecoin market now worth roughly $290 billion, yield opportunities are naturally attracting more attention.
But a larger market also means more choices — and therefore more research.
So instead of asking:
“What's the APY?”
ask:
“Where does this APY come from, and what risk am I taking to earn it?”
💬 Which cost or risk do you think investors overlook most when calculating APY?
Risk Note: Yields can change, and past performance does not guarantee future results.
This content is not investment advice. Always perform your own research before making financial decisions.
$BTC $GT $ETH
#每周来晒 #牛熊未定闲钱该放哪 #WhereToParkStablecoinsWhileWaiting #GateSquareMidAutumnReunion #Gate广场中秋团圆局
BTC+1.52%
GT+3.09%
ETH+3.51%
  • 2
【Mid-Autumn】🔹Less Than 24 Hours After the CLARITY Act Setback, a Crypto Tax Reform Bill Is Moving F
live-cover
LIVE2,138
  • 1
BTC 76,696 — V-Shaped Recovery: Long or Short?
live-cover
LIVE1,330
JUST IN: Robinhood stock down 5% after insider-trading allegations tied to a crypto executive.
Retail trading platform weathering scrutiny as fintech-crypto overlap tightens regulatory lens.
post-image
HOOD+3.05%
During today’s early session, there was some volatility due to the Federal Reserve’s meeting decision, but it was not very large—around 1,000 points. So why didn’t the price continue falling? A rate hike is clearly bearish, isn’t it? Because the large funds had already exited early to avoid risk. The main players took advantage of the news to liquidate both longs and shorts, which resulted in this kind of huge wick. The decline has currently stopped because large funds have been entering gradually. Since the uncertainty surrounding the Federal Reserve has been resolved, they now dare to enter.
post-image
BTC+1.52%
ETH+3.49%
Bitcoin Is Holding $76K. But U.S. Buyers Aren’t Confirming It.
$BTC remains above $72K–$74K support after the Fed hike.
$78K–$79K → breakout trigger
$72K–$74K → key support
The signal to watch: Coinbase Premium ≈ -0.08, suggesting weak U.S. spot demand.
Price is holding. Demand needs to catch up.
#Bitcoin #BTC #MarketAnalysis
post-image
BTC+1.52%
The price kept pulling back and struggling at the daily candlestick resistance level all day, and I didn’t open a single position... I can’t go on like this. When will I finally be able to properly get onto A8? I’m feeling a bit lost. #XAUUSDT
A8-0.48%
Load More

Join 40 M users in our growing community

⚡️ Join 40 M users in the crypto craze discussion

💬 Engage with your favorite top creators

👍 See what interests you

Trending Topics

GateTopsStockPerpetualCoverage

36.02k Views1.77k Discussing

According to the latest DefiLlama report, Gate has listed 385 stock-related perpetual contracts, ranking first in coverage; average daily volume is about $1.15B and average open interest about $738M, both ranking third in the industry; liquidity depth for its five highest-volume contracts — SNDK, SKHYNIX, SPCX, SOXL, and MU — ranks first across the board. How do you view Gate leading in both coverage breadth and liquidity depth? [👉 Full Report](ttps://defillama.com/research/spotlight/deep-enough-trade-gate-case-tokens-stocks)

GateTrenchesExclusive0GasTrading

46.21k Views819 Discussing

FedHikes25bpsForFirstTimeIn3Years

30.77k Views8.16k Discussing

View More