Share crypto content and earn up to 60% commissions through content mining.
placeholder
gatefun
#GateStockInsightsChallenge
The stock market is full of opportunities, but finding them requires more than simply watching prices move. The is a great reminder that strong market insights begin with research, analysis, and the ability to explain why a particular stock deserves attention.
Every market participant has a different approach. Some focus on earnings and revenue growth, while others study technical charts, market trends, valuation, sector performance, or upcoming catalysts. The strongest analysis often comes from combining several of these factors instead of relying on one indicator
post-image
  • Reward
  • Comment
  • Repost
  • Share
Financial News, Crypto Market Updates, Real Trading Strategies
gate liveLIVE
1,301
  • Reward
  • 5
  • Repost
  • Share
CryptoShine:
2026 GOGOGO 👊
View More
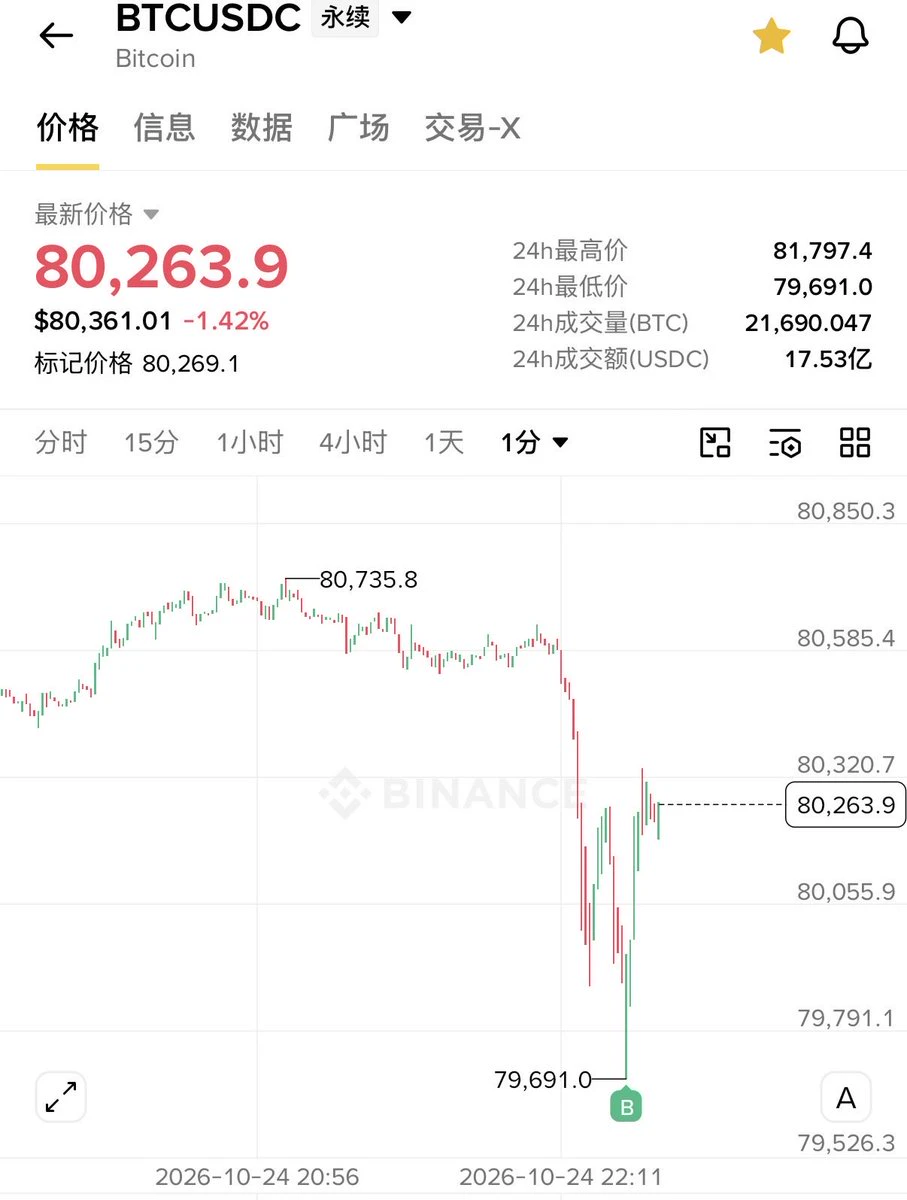
8.25 Bitcoin chart analysis

Direction: After finding support on the pullback, launch another upward move and surge to test the area near the previous high of 79974.8. The bullish trend continues; prioritize entering long positions on short-term pullbacks.
Long: Around 78800–79300, stop-loss below 78500, targets 79800/80500.

After stabilizing at the pullback low, Bitcoin has once again begun a strong upward move, approaching the previous high of 79974.8, with the current price at 79678.1. This rise has driven the moving averages to turn upward again and form support. The relatively shallow
BTC3.28%
View Original
post-image
  • Reward
  • Comment
  • Repost
  • Share
No trades, no analysis, just sheer luck—this performance is embarrassing to even talk about.😂
While everyone was still waiting and watching, the signal I saw was that the key level held and buying pressure was strengthening. At the time, $CAP was chopping around 0.02038, so I immediately called for a long.
Now look up: 0.0692, with a return of +4717.26%. It really dragged at first, but the move turned out beautifully—those who got on board should be laughing in their sleep.
Act decisively: Take profit on 80% first and secure the gains, then move the stop-loss on the remaining 20% to the entry
CAP-1.43%
ADA1.45%
DOGE-0.81%
View Original
post-image
  • Reward
  • Comment
  • Repost
  • Share
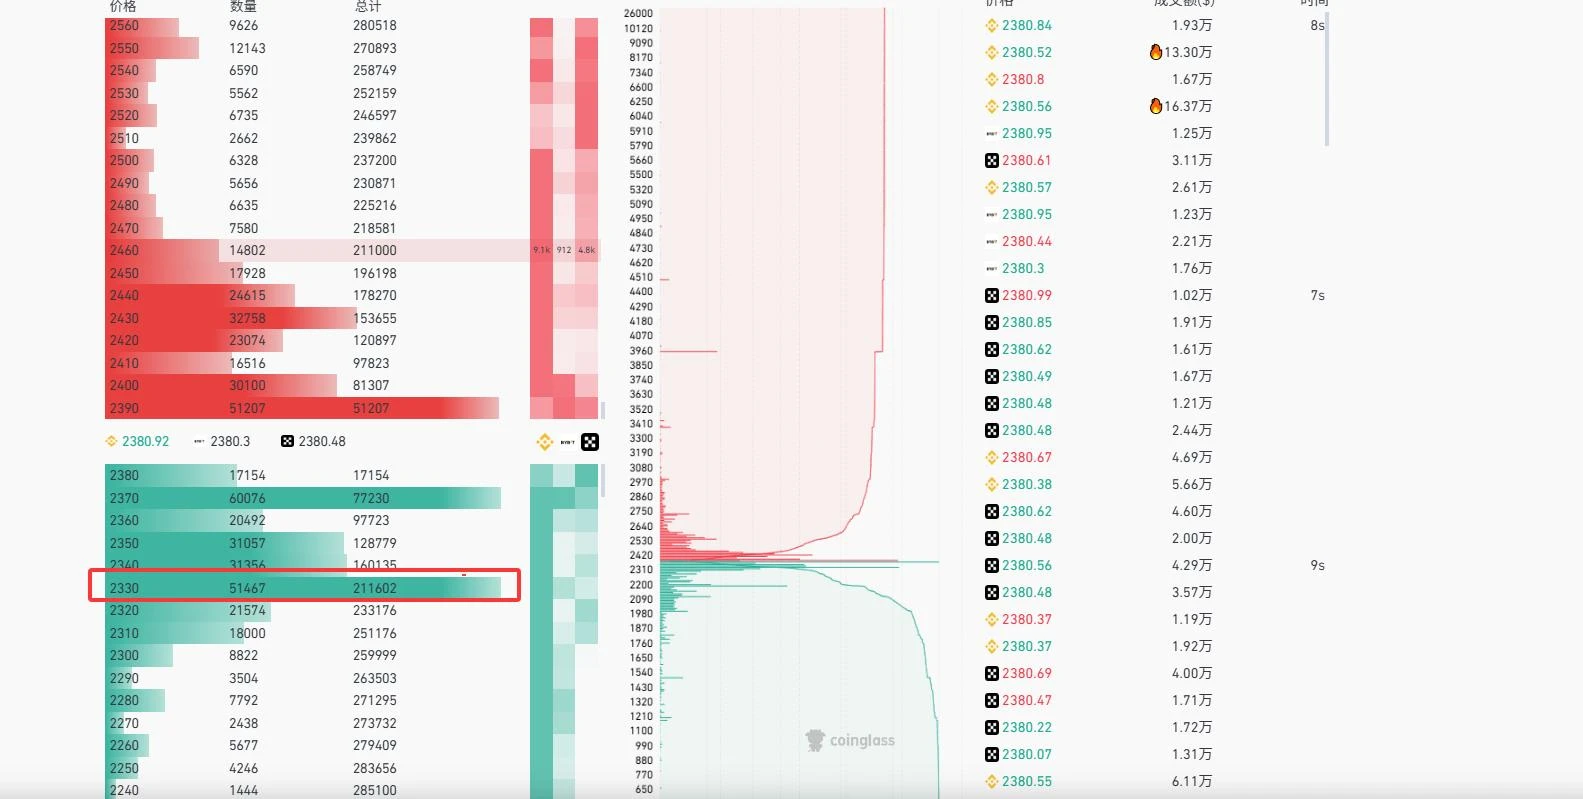
8.25 ETH/BNB Strategy/
After a surge, selling pressure was released in concentrated fashion. The rebound failed to break through the resistance above and will continue downward to test moving average support; if support holds, the market will maintain high-level repeated fluctuations; once it decisively breaks below moving average support, a deeper correction will begin.
So, without further ado, today’s strategy:
Suggested entry: Go long on a pullback around 2460
First take-profit: Around 2500
Second take-profit: Around 2520
Stop-loss: 2400.
ETH2.02%
BCH1.79%
View Original
post-image
  • Reward
  • Comment
  • Repost
  • Share
I’m doing better too
A major influencer in the Simplified Chinese community
Cat God followed me
View Original
post-image
  • Reward
  • Comment
  • Repost
  • Share
My hand trembled slightly when I set the stop-loss a few days ago, only to realize this morning that the filial piety was unnecessary. While everyone else was running, I casually mentioned $GIGGLE instead; funds quietly moved in, trading volume gradually picked up, and it formed a base without breaking down. This kind of token was just one push away.

Entered at 30.24, and GIGGLE has now climbed to 35.99, +916.36%. Feels good, brothers—the profits are solid.

Take some profits first; don’t get greedy for the last bite. Take 80% off in profit, protect the remaining 20% at the entry price, and
GIGGLE-2.74%
LAB-2.97%
ADA1.45%
View Original
post-image
  • Reward
  • Comment
  • Repost
  • Share
I originally just wanted to join in on the fun, but this move ended up giving my empty account a full spa treatment. A few days ago, the last thing I saw before bed was $VVV still stubbornly holding on, with a weak rebound, volume failing to keep up, and every push higher falling just short—a strong bull-trap vibe. I told myself then that if I didn’t short it here, I’d be doing a disservice to the whole performance it was putting on. Looking at it now, at 16.793 after steadily sliding down from 17.372, I’ve pocketed +160.5% in profits. Feeling great, brothers. What a delicious chunk of meat.
VVV1.27%
DOGE-0.81%
BTC3.28%
View Original
post-image
  • Reward
  • Comment
  • Repost
  • Share
A few days ago, I was still calculating whether I had enough money for instant noodles this month; this morning, I was already wondering whether to add sausage🍜
The last thing I saw before bed was $XRP moving sideways at the bottom, with funds quietly entering. I judged there would be another wave and signaled a long entry around 1.0482.
When I opened the chart this morning, the current price was 1.5044, and the return shot straight to +4050.35%. With a move like this, I didn’t even need to think—the account was dancing on its own.
Operationally: Take profit on 80% first, move the stop loss o
XRP1.95%
BTC3.28%
BNB1.34%
View Original
post-image
  • Reward
  • Comment
  • Repost
  • Share
This is Bitcoin’s chart since 2022.
If you had bought every single time this indicator flashed BUY NOW, you’d be filthy rich by now.
The crazy part?
It’s never too late. 🚀
#btc #crypto
BTC3.18%
post-image
  • Reward
  • Comment
  • Repost
  • Share
8.25 SOL Analysis
Analysis: Go long on a pullback around 98.5–99.8, with defense at 96.0, first target at 102.6, and second target at 104.5
On the SOL 1H timeframe, the price has risen strongly from the low of 93.60, reached a high of 102.84, and then pulled back slightly. It is currently consolidating around 101 to digest the gains. The overall trend is fully bullish, the Bollinger Bands are opening upward, and the price is holding firmly above the moving average. This rally has been accompanied by strong volume. However, after the consecutive short-term surge, the market needs a pullback and
SOL6.17%
View Original
post-image
  • Reward
  • Comment
  • Repost
  • Share
Four Markets, Four Answers
——At Monday’s open, the four markets gave four different answers. What really matters next is not who continues rising or falling, but who is the first to admit they were wrong.
At 6:00 a.m. Beijing time on Monday, an unusual opening:
- Oil opened slightly lower with a small gap down, with Brent crude falling below $92;
- U.S. Treasury yields also edged lower, with the 10-year Treasury yield slipping to 4.72%;
- Gold, meanwhile, opened with a $20 gap up before giving back some of its gains;
- At the same time, U.S. stock futures opened higher, then gave back all thei
BZ0.25%
GLDX0.82%
PAXG-0.01%
View Original
post-image
XAUUSDT
Short
Cross 100X
Return %
+15.86%
Entry Price(USDT)
4,681.81
Mark Price(USDT)
4,665.87
What price will Ethereum hit in August?
↑ 2,600
1.41x
71%
↓ 2,400
1.64x
61%
$419K Vol+36 more
  • Reward
  • Comment
  • Repost
  • Share
LINK 4-hour chart hides danger—do you dare follow this bearish signal?

$LINK /USDT - SHORT

Trading plan:
Entry: 11.721 – 11.795
SL: 12.116
TP1: 11.489
TP2: 11.310
TP3: 11.042

Why pay attention to this structure?
- The 4H direction is clear: SHORT, with 55.4 confidence—not an ambiguous signal.
- Key level 11.758 is the current bull-bear dividing line. The 1D trend remains range-bound, but the 15-minute RSI has reached 67.36, indicating short-term overbought conditions and mounting pullback pressure.
- Why now? The price is stuck near the upper end of the range. If it fails to break above
LINK2.81%
View Original
post-image
post-image
  • Reward
  • Comment
  • Repost
  • Share
Layout for Bitcoin, Ethereum, and Dogecoin
gate liveLIVE
1,610
  • Reward
  • Comment
  • Repost
  • Share
SOL 4H bearish signal, but the 15-minute RSI has already reached 77—which side is buying?

$SOL /USDT - SHORT

Trading plan:
Entry: 101.23 – 102.03
SL: 106.59
TP1: 97.91
TP2: 95.43
TP3: 91.71

Why pay attention to this structure?
- Currently around 101.63, the direction is SHORT, with 77.4 confidence—this is not a minor move.
- The 1D trend is range, meaning the 106.59 SL above and 97.91 TP1 below are firm boundaries.
- The 15-minute RSI is overbought, suggesting a short-term pullback, but the 4H structure has not broken down yet, so wait for confirmation before shorting.
- Why now? Because
SOL6.28%
View Original
post-image
post-image
  • Reward
  • Comment
  • Repost
  • Share
My hand trembled slightly when I set the stop-loss a few days ago, only to discover this morning that the filial piety was unnecessary. During the repeated intraday swings, $HYPE /HYPE kept faking breakdowns and scaring me, but it held firm again after each pullback, so I went long with my eyes closed.

I checked the charts this morning and saw that staying up late had paid off. The cost was 60.974, and it’s now at 79.238, +2123.05%. This move climbed up step by step from the bottom—steady and reassuring.

I’ve taken 80% off the table and moved the protection higher on the remaining 20%. Let
HYPE-1.26%
XRP1.95%
LAB-2.97%
View Original
post-image
  • Reward
  • Comment
  • Repost
  • Share
Song Xiqing’s Morning Gold Analysis:
Gold maintains a strong bullish structure on the H1 timeframe.
After completing a liquidity sweep of 4625‑4635, the price has reclaimed this range, with the bullish structure intact and momentum for further upside expansion. The primary resistance is 4685‑4705.
After the sharp rise, a short-term pullback is needed. Closely monitor the key support at 4630‑4640.
If support holds on the retest, consider opening a light long position, targeting 4700.
Trading recommendation:
Go long near 4625-4635, with the stop-loss uniformly set at 4600. Target 4680-4700, and
BTC3.28%
ETH2.12%
XAU-0.14%
View Original
post-image
  • Reward
  • Comment
  • Repost
  • Share
Can it continue rising after reaching a new high? BTC is only watching these two levels today
Last week, we judged that this move would still be overall high-level range-bound consolidation, with messy short-term movements, which is indeed not easy to trade. The 4-hour timeframe has not yet fully recovered to the zero line, so there is no need to guess the direction every day at this stage. Follow the structure, trade when there is an opportunity, and wait when there is not.
$ETH made another push to a new high last night, and a divergence has already appeared on the 30-minute chart. There wi
ETH2.12%
BTC3.28%
SNDK-5.53%
View Original
post-image
  • Reward
  • Comment
  • Repost
  • Share
You could even say
In my next life, I won't trade crypto anymore. I'll be a cat and let you hold me in your arms while you sleep
@xiaomaodou_
View Original
  • Reward
  • Comment
  • Repost
  • Share
I didn’t do a thing—I just went to the bathroom, and when I came back, the candlestick chart had already done the work for me. A few days ago, I took a quick look at $ETH before bed. It was sitting right at 2270.19; the key level held, the retest held firm, and capital was flowing in quietly rather than the price being visibly driven up by a single large bullish candle. While everyone else was running, I instead felt it had a chance. When I opened the chart today, it had already moved clearly above 2495.84, and +1726.19% had simply landed in my account. This was a satisfying piece of the move—
ETH2.12%
XRP1.95%
ADA1.45%
View Original
post-image
  • Reward
  • Comment
  • Repost
  • Share
Load More

Join 40 M users in our growing community

⚡️ Join 40 M users in the crypto craze discussion
💬 Engage with your favorite top creators
👍 See what interests you
  • Pinned