
Square
Following
Hot
News
Notifications
Profile
Share your thoughts
placeholder
Article
Young married women in Beijing, Shanghai, and Guangzhou: still talking about NVIDIA?
post-image
NVDA-13.84%
GT markets predictions
live-cover
LIVE2,308
GT-2.41%
GT-2.41%
Trenches
FIONA
F
bade
b
FIONA
B34n...pump
Market Cap
$.
Change
.
24h Vol
$.
Holders
.
PIEVERSE
P
bade
b
PIEVERSE
0x0e...25a9
Market Cap
$.
Change
.
24h Vol
$.
Holders
.
mihao
m
bade
b
mihao
4Cxj...pump
Market Cap
$.
Change
.
24h Vol
$.
Holders
.
PROS
P
bade
b
PROS
0x8b...9832
Market Cap
$.
Change
.
24h Vol
$.
Holders
.
CLAUDIA
C
bade
b
CLAUDIA
2j5S...W2ZM
Market Cap
$.
Change
.
24h Vol
$.
Holders
.
$PIEVERSE Massive token inflows into exchanges—the project team is distributing and transferring tokens on a large scale to dump! Prices are bound to take a hit in the short term, so you can start positioning for a short!
post-image
PIEVERSE+0.58%
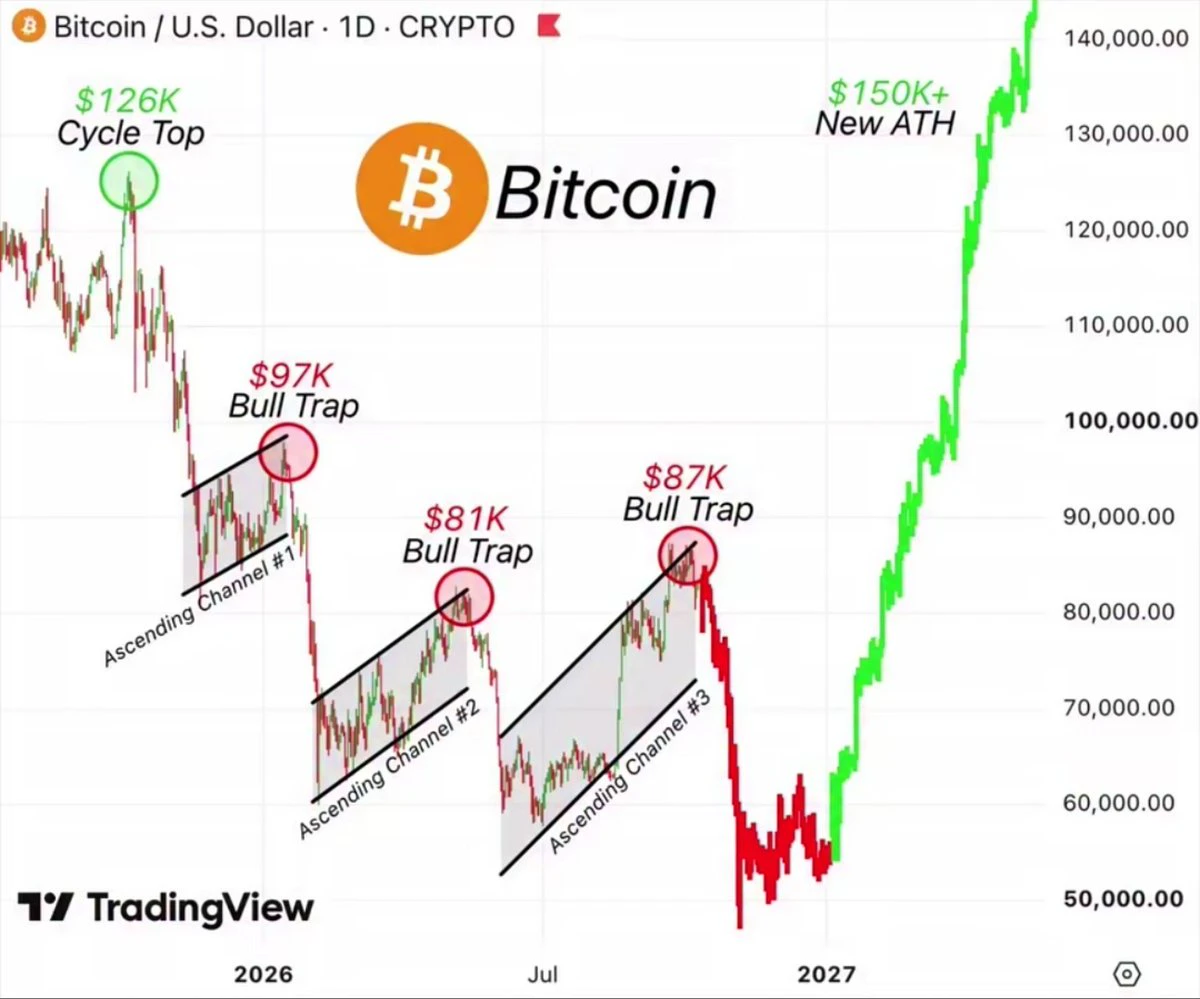
In October, a foreign analyst sketched out a Bitcoin scenario.
The earlier 126K, 97K, and 81K were all historical chart patterns. He predicted 87K—a bull trap, then a crash.
It seemed absurd at the time; now it feels chilling.
Because after $87K , it really played out exactly as predicted.
Next stop: 50K. Do you think it’ll get there?
Not long ago, almost nobody believed it would.
Now probably at least half of people have already started to assume it will.
post-image
BTC-0.67%
  • 1
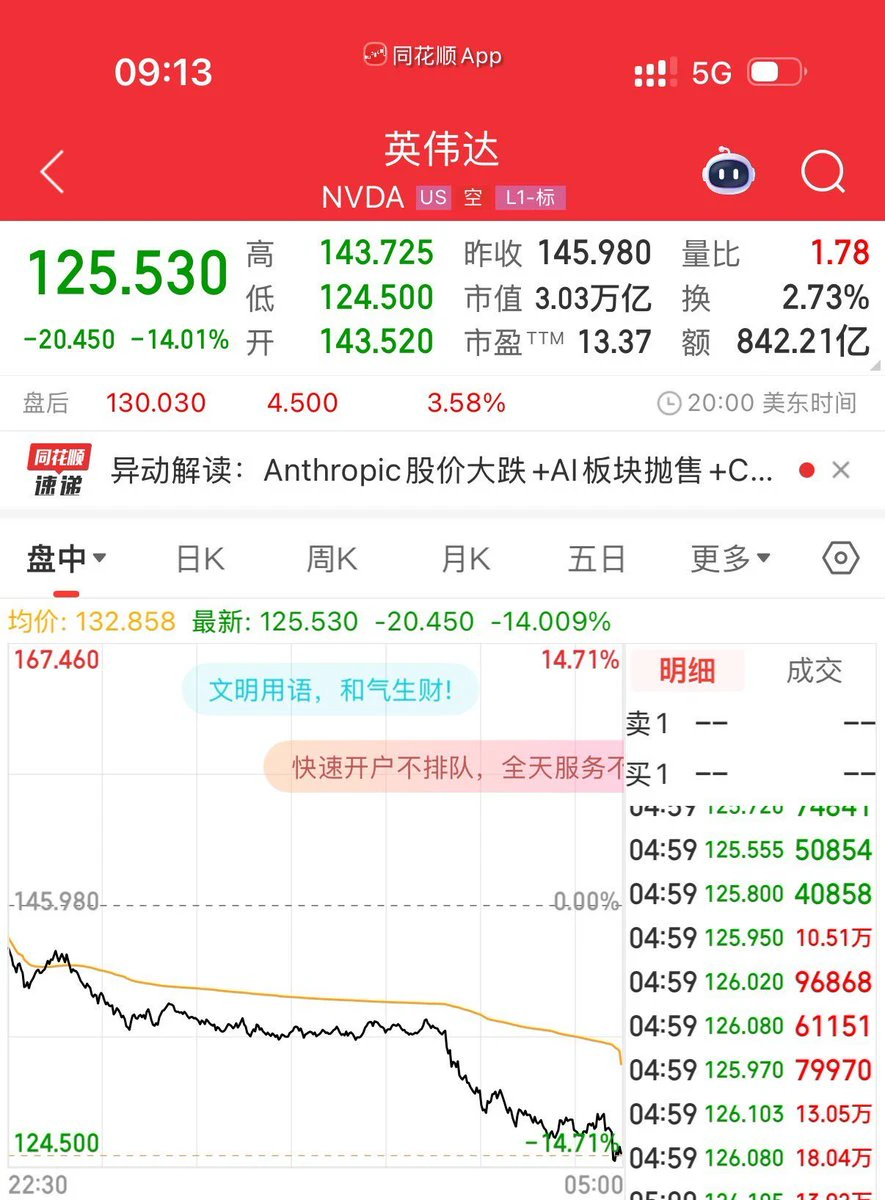
U.S. Stocks Last Night: AI Throne Crumbles, Leader Posts Seven-Day Losing Streak (November 20)
SEC Probe—Throne Changes Hands—Nasdaq Enters Bear Market
I. A Brutal Night
U.S. stocks faced concentrated selling on Friday: the Dow fell 1.93% to 48147, marking its fifth straight day of losses; the S&P 500 fell 3.70% to 6910, extending its losing streak to seven days, the longest since 2020; and the Nasdaq plunged 5.28% to 22617, wiping out all its gains for the year. The Nasdaq 100 tumbled 5.61%, falling 20% from its peak and officially entering a bear market. The fear index VIX surged 26.2% to 35
NAS100-0.07%
SPYX+0.01%
SPX+0.33%
NVDA-13.84%
AAPL-1.83%
  • 1
When I have money, I spend it by the thousands; when I’m broke, I pinch every penny. It’s pointless, pointless, really pointless 😂😂#NoMoneyForFood
  • 1
Over time, you’ll understand that if someone around you patiently teaches and reminds you, takes great care to share life wisdom and ways of dealing with things, and gives you positive energy without morally pressuring you, you should be grateful, no matter what your relationship with that person is. In a sense, such a person is what you’d call a benefactor.
post-image
  • 1
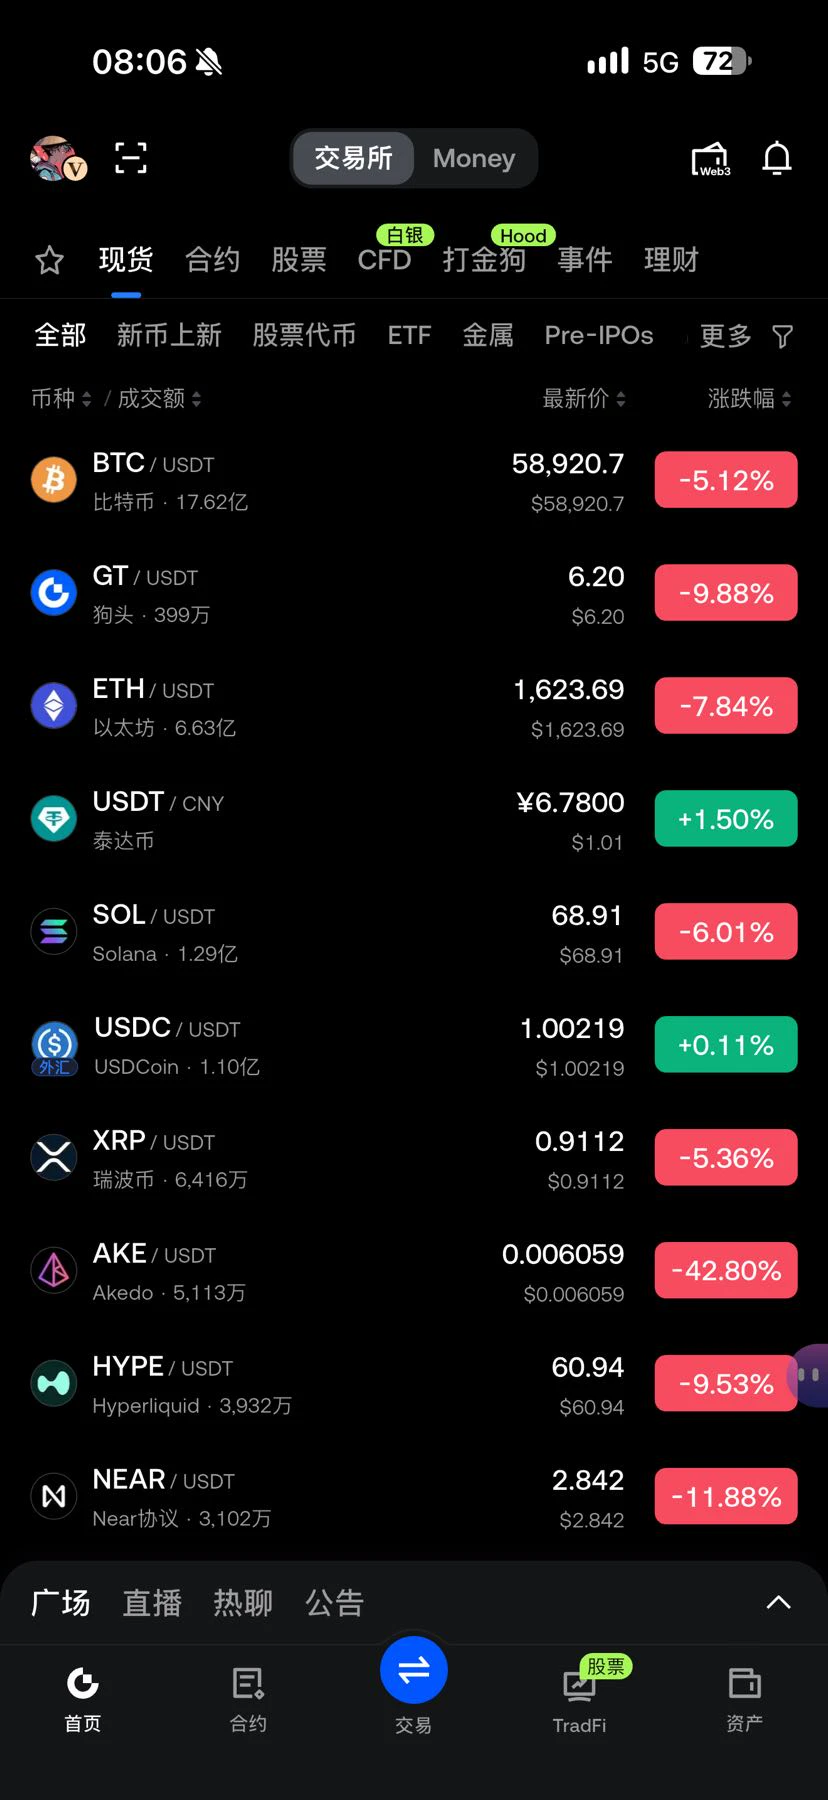
It’s been 10 days since Singles’ Day, so why are crypto prices still on sale?
post-image
  • 3
  • 2
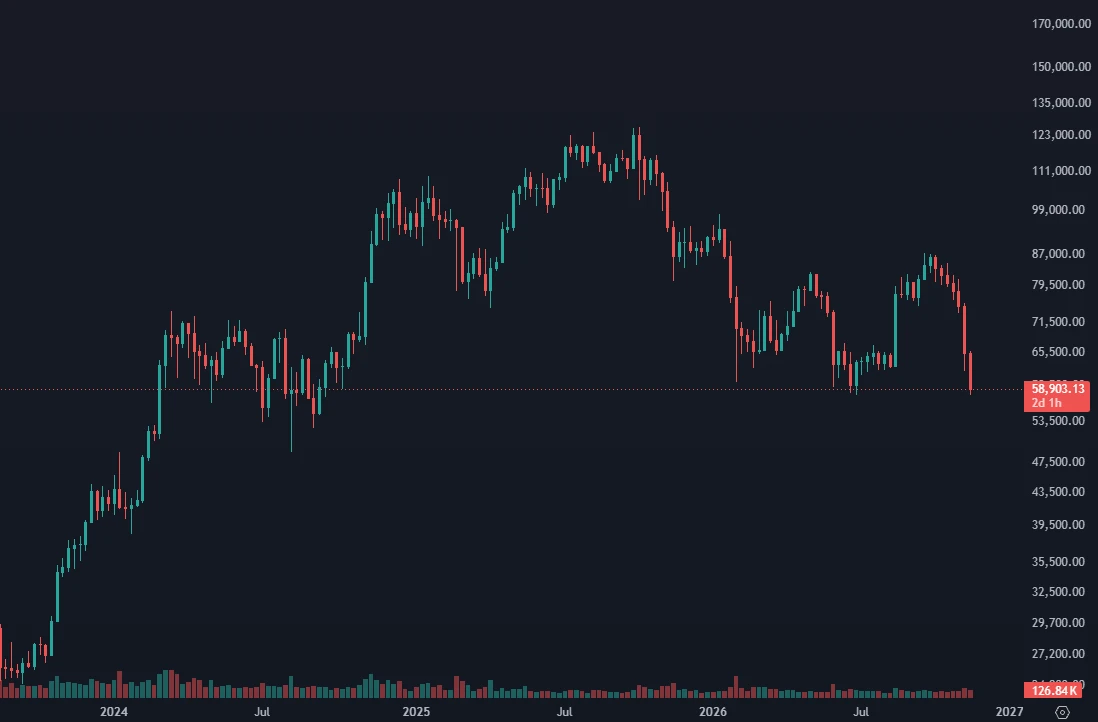
When someone considers a break below $57,800 to be a new Bitcoin bottom, they are confusing a break of the low with the formation of a new bottom.
So far, $60,000 represents the technical bottom on the chart.
For us to talk about a new bottom, there needs to be actual trading below the previous low. Then we watch price action and liquidity, and how well buyers can absorb selling pressure and trigger a genuine reversal.
Always remember...
Breaking the low is not the same as forming a bottom, and reaching a price level does not confirm a trend reversal.
Technical analysis is about reading price
post-image
BTC-0.67%
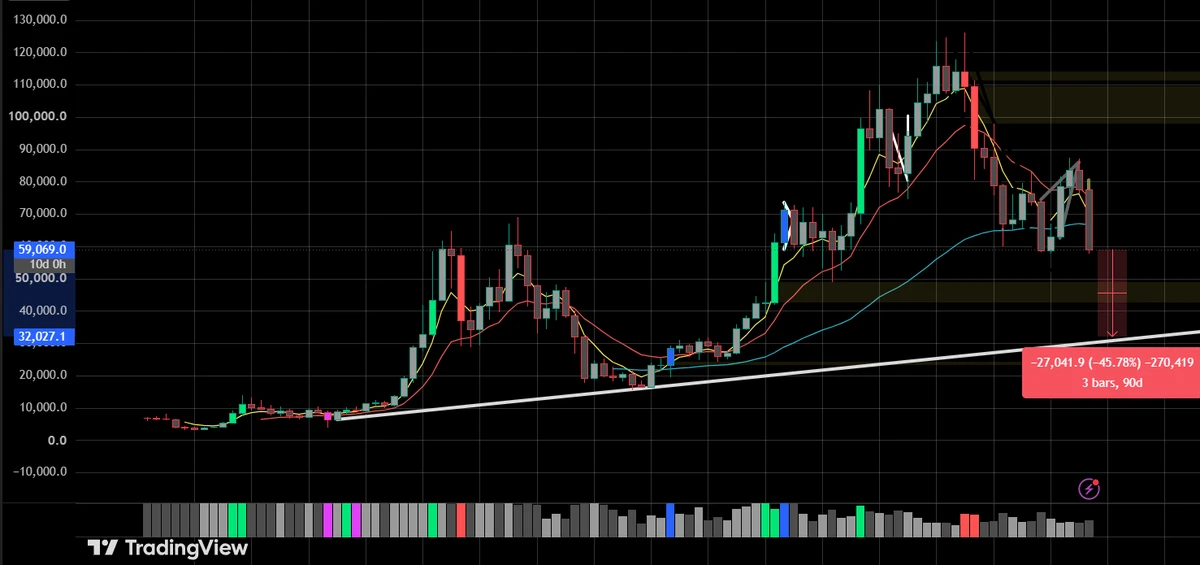
I hate to say it, friends, but we might have a little more downside.
Look at the macro chart. The next major support is the macro trendline at $32K.
That's not a prediction. That's just the chart.
Don't bet the house. #Bitcoin $BTC
post-image
BTC-0.67%
The only fair thing in the world is that everyone dies!!!
post-image
[New Streamer] Market Prediction
live-cover
LIVE58
BTC-0.67%
Hey INJ$INJ , don’t act like you have somewhere else to be. You hit that resistance level, and everyone suddenly gets excited about a breakout, but we all know how this usually ends. You’re just luring buyers in, waiting for the rug to be pulled out from under them. Don’t play dumb with me—I see right through this rally. Take profit: 6.050 Stop loss: 6.775 Also active coins:
$FOLKS : Current price 2.494 - 24-hour change: +11.99%
$BTC : Current price 58,857.4 - 24-hour change: -5.10%$
post-image
INJ-1.67%
FOLKS+0.88%
BTC-0.67%
#BTCFallsToLowestSinceSeptember #ShareWeekly
BTC Falls to Lowest Since September: What Is Driving the Latest Bitcoin Decline?
Opening:
Bitcoin is facing renewed selling pressure as its price falls to its lowest level since September, raising concerns across the cryptocurrency market. This decline highlights the uncertainty currently affecting digital assets and reflects a combination of market sentiment, investor caution, macroeconomic developments, and changing liquidity conditions. As Bitcoin remains the leading cryptocurrency, its price movements are also influencing the performance of man
BTC-0.67%
ETH-1.26%
#BTC #WCTCS9 #ShareWeekly
BTC Market Analysis: Why the Crash, Where Support Sits, and What Would Signal a Bull Trend

Bitcoin is trading near $59,100 after a sharp sell-off. The Gate spot snapshot shows a 24-hour low of $57,750, a 24-hour high of $62,636, and a 7-day change of about -13.7%. The daily candle that closed on November 20 finished at $58,949.90. Today's candle is still open and was trading near $59,120. Here is my view on what is driving it, the levels I am watching, and what I would need to see before calling a trend reversal.

What is driving the crash

The first driver is force
  • 4
  • 1
EVAA | Long 🟢 | Bullish | 15 minutes 24 hours: +18.13% | Volume: 455.2M USDT Long rationale: Price above EMA200; EMA20/50/200 in bullish alignment; RSI14 at 63.7; MACD histogram positive; ADX14 at 24.8; volume is 1.25 times the 20-candle average; trend pullback/continuation. Entry: 6.187 Stop loss: 5.7315 Take profit 1: 6.75637 | Take profit 2: 7.098 | Take profit 3: 7.5535 Entry price for reference only; do not chase. This strategy is invalidated if the stop-loss level is hit. Technical strategy only, not financial advice. $EVAA
post-image
EVAA-0.49%
Holy shit, holy shit, holy shit!!
Is Jensen Huang getting ready to start an entirely new semiconductor company?
post-image
Jerk’s Watch: Nasdaq Composite Index IXIC
2026.11.21
The Nasdaq plunged another 5.28% at Friday’s U.S. market close.
Looking at the candlestick chart, the Nasdaq has fallen to the gap created during its rebound after last year’s tariff turmoil. Whether it will fill this gap remains to be seen.
But if it does, where are the key levels where it could find support and stop falling? In my view, they’re 21,500 and 19,850.
If it reaches those levels, buying in batches should deliver decent returns.
When the market plunges, keeping a level head is what matters most. Investing isn’t gambling—it’s also
NAS100-0.07%
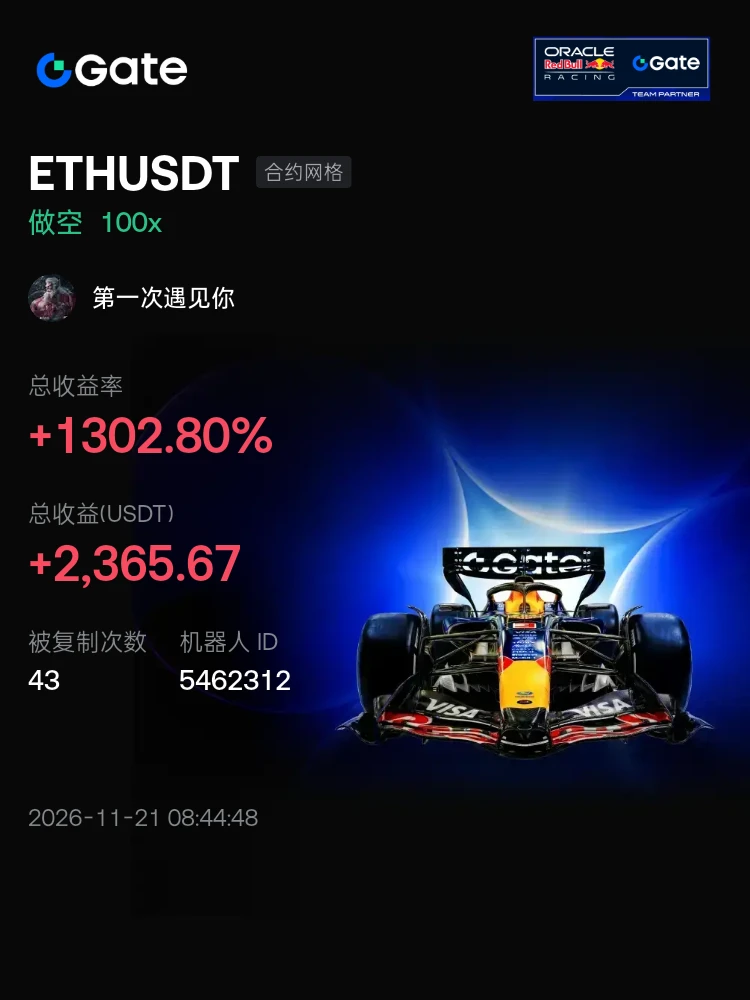
#交易机器人 I'm using the ETHUSDT futures grid bot on Gate—come copy trade with me
post-image
Load More

Join 40 M users in our growing community

⚡️ Join 40 M users in the crypto craze discussion

💬 Engage with your favorite top creators

👍 See what interests you

Trending Topics

GateDirectIPOPhase3ANTAllocates92100Shares

714.2K Views4.7K Discussing

The allocation results for Gate Direct IPO Phase 3 — Anthropic (ANT) — have been announced, with a total of 92,100 $ANT shares allocated. Successful participants can check their accounts and review their subscription results. Did you secure an allocation this time? Share your subscription experience and allocation result on Gate Square!

USNOVJoblessClaimsBeatExpectations

190.3K Views1.6K Discussing

FedMayNeedA50bpRateHike

432.1K Views3.5K Discussing

View More