Square
Following
Hot
News
Notifications
Profile
Share your thoughts
placeholder
Article
BTC | ETH | Gold | Crude Oil
live-cover
LIVE2,020
HOT TOPIC PREDICTION
live-cover
LIVE322
Trenches
ZIG
Z
bade
b
ZIG
0x8c...1145
Market Cap
$.
Change
.
24h Vol
$.
Holders
.
STONK
S
bade
b
STONK
6GmA...UNgx
Market Cap
$.
Change
.
24h Vol
$.
Holders
.
IDOL
I
bade
b
IDOL
0x3b...ab07
Market Cap
$.
Change
.
24h Vol
$.
Holders
.
BTC
B
bade
b
BTC
C5xp...pump
Market Cap
$.
Change
.
24h Vol
$.
Holders
.
FLOAT
F
bade
b
FLOAT
Bv1a...BMmr
Market Cap
$.
Change
.
24h Vol
$.
Holders
.
$XRP continues to face pressure as long positions were liquidated around $1.1584. Price is hovering near $1.16, putting the market close to an important support region. From a market-structure perspective, a liquidity sweep followed by a strong bullish displacement could create an opportunity for recovery, but buyers still need confirmation.
Support: $1.145 – $1.155
Resistance: $1.175 – $1.190
Next Target: $1.210 – $1.230
Bullish Confirmation: Reclaiming $1.190 with strong volume could shift momentum toward $1.21–$1.23. A breakdown below $1.145 would favor further downside.
Let's go $XRP 🚀
post-image
XRP-1.15%
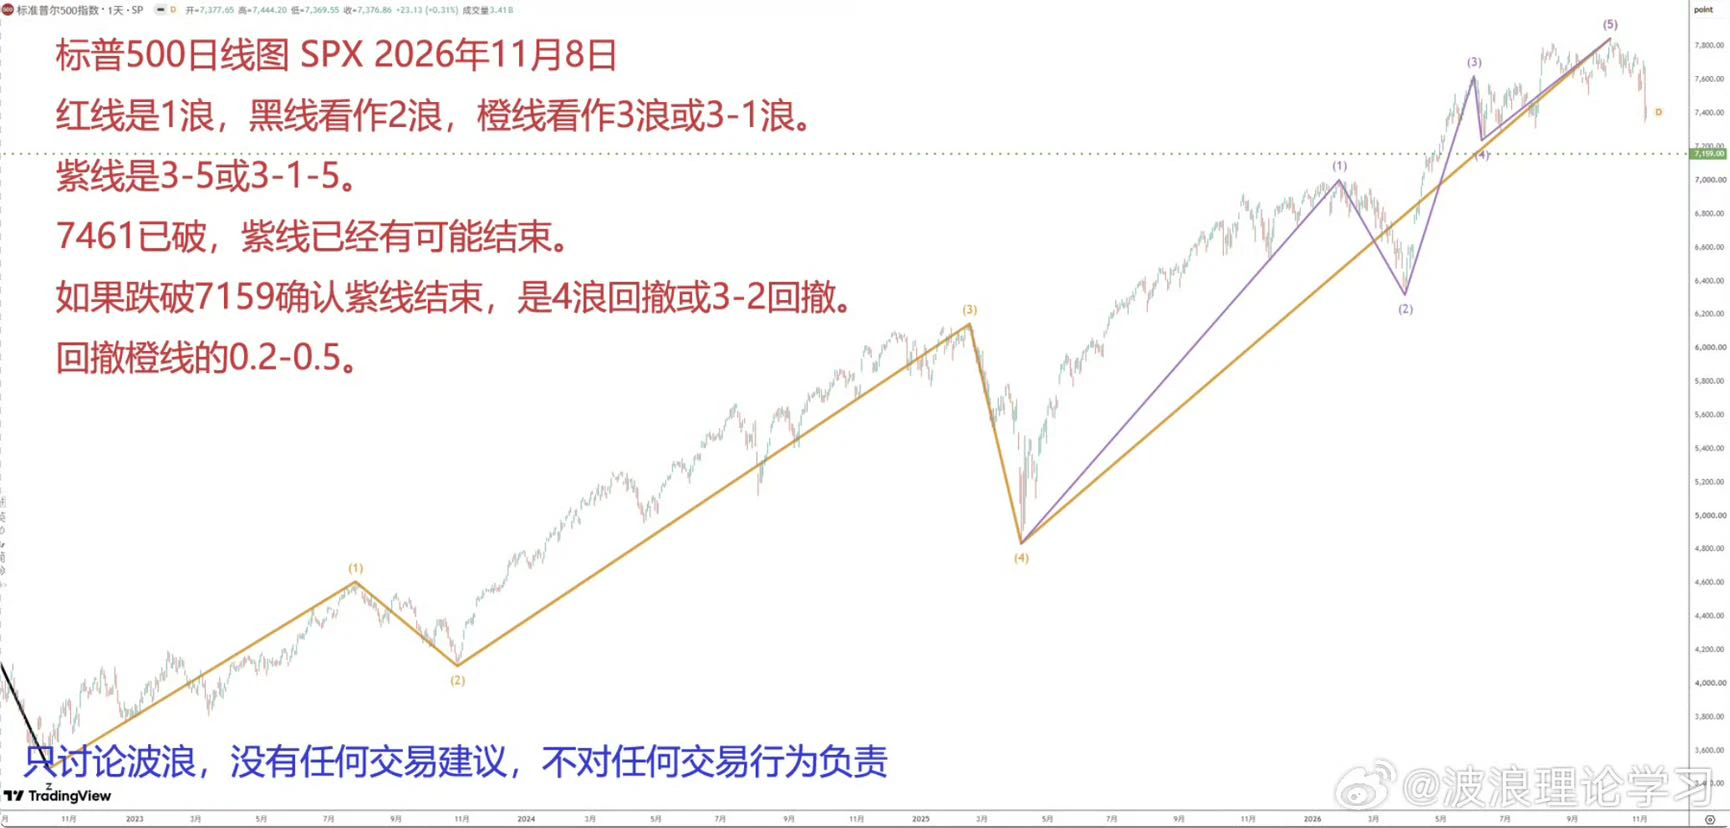
S&P 500: Warning began on September 15; on November 3, it “clearly formed a top at a minor degree.” Today, November 8, it broke below the monitoring point, expanding the top’s degree. ​​​$BTC ‌
post-image
BTC-0.65%
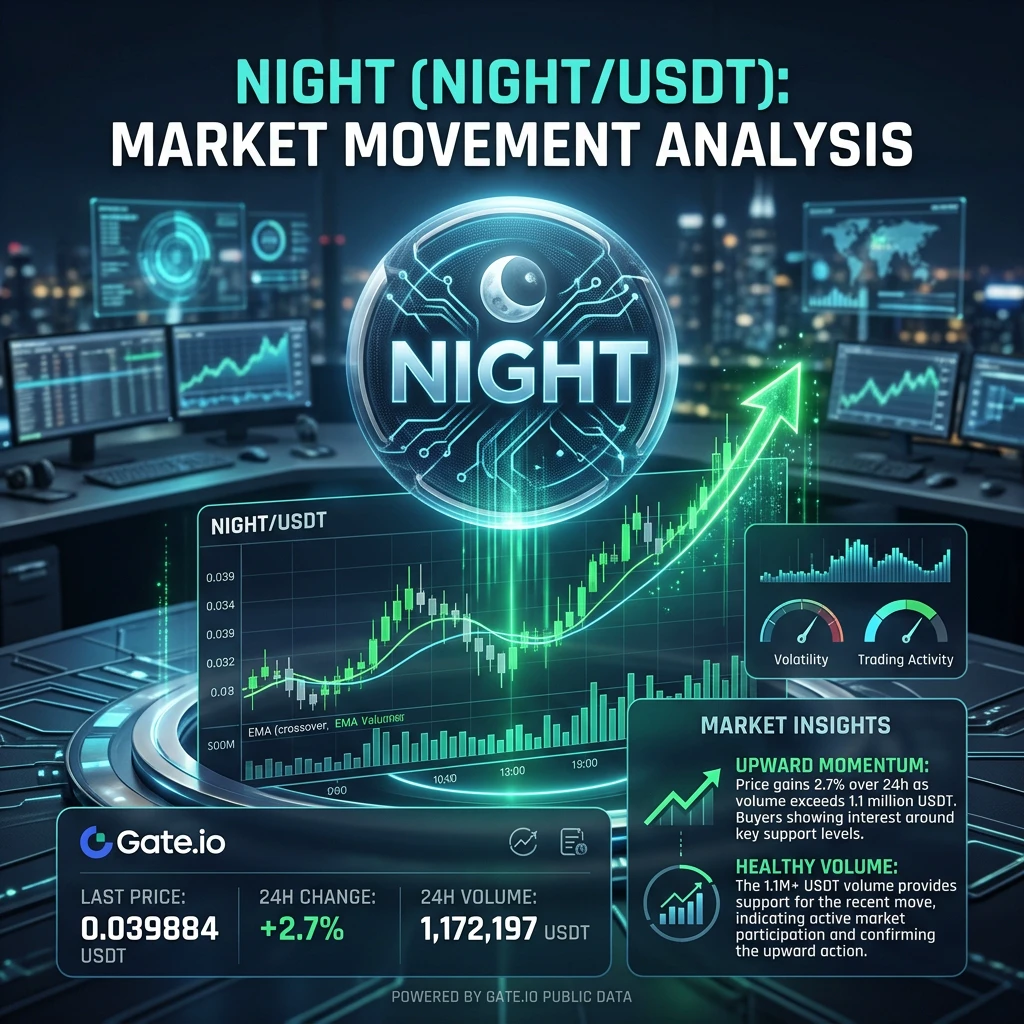
#NIGHT

NIGHT Edges Higher: A Beginner’s Guide to Its Price Movement and Midnight Network Developments

A Common Myth

A common mistake in crypto is thinking that whenever a coin rises, its project must be growing rapidly. Price movement alone cannot prove that. A market can move higher because of short-term buying interest, changing sentiment, new developments, or temporary trading activity. NIGHT’s latest movement is a useful example of why understanding the numbers matters more than simply watching the price.

The Latest Numbers

At 01:30 UTC on November 8, 2026, NIGHT/USDT was trading at
post-image
NIGHT-3.10%
  • 1
A brief analysis of BTC short-term trends from Dow Theory, Chan Theory, Elliott Wave Theory, volume-price relationships, order flow, and price action (strategy recommendations)
Comprehensive assessment
Dow Theory confirms that the break below 75,000 has accelerated the bearish trend + volume is contracting as the market consolidates
Chan Theory: Each stroke makes a new low; the 75,460 potential bottom fractal is unreliable due to low volume
Elliott Wave Theory: Subwave ③ of Wave C's fifth wave is nearly complete (74,791 is just 31 points above the 1.0× target); a subwave ④ rebound could begin
BTC-0.67%
$AKE Go short now—a crash is imminent!!! After two rallies marked by price-volume divergence, now is the time to enter. Go short and sit tight, waiting for it to hit new lows
post-image
AKE+6.07%
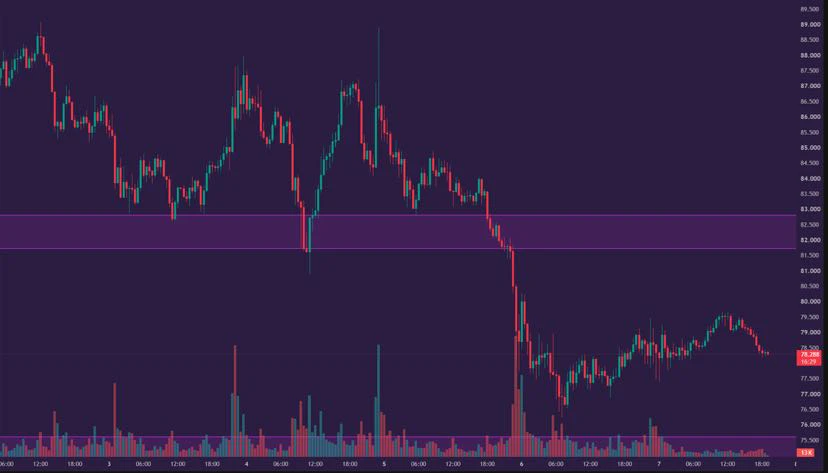
$HYPE This week's drop has been pretty brutal😥

Last week's news of ICE's partnership with Trade[XYZ] sent market sentiment soaring, with the price briefly nearing $96

But this week, it continued to slide, falling from nearly $88 to around $78, down about 11% for the week

So, has anything major deteriorated in the fundamentals?

At least for now, there hasn't been any project-specific bad news that would be enough on its own to explain this decline

The ICE partnership is still in place, progress in the related U.S. regulated market still requires regulatory approval, and Hyperliquid's busi
post-image
HYPE+0.33%
Two-Week Market Review: Through Rotating Gains and Losses, an Unassuming Approach Goes the Distance

  The two-week market period has come to a close. BTC completed two full cycles of gains and losses, while ETH followed in lockstep throughout. Volatility narrowed, and the pace remained highly synchronized, just as the old saying goes: “Tides rise and fall according to their own rhythms; clouds gather and disperse in their own time.”

  The first week began with wide swings around the 80k level, as daytime rebounds alternated with nighttime pullbacks and bulls and bears repeatedly whipsawed th
BTC-0.65%
ETH-1.23%
BTC got dumped from 86,000 to 75,000, and you still can't hold? It rallied to 81,300 on Monday, then dropped 6,000 points too. Are you still scared at 75,600? Go long BTC, with a target around 77,666. Even if you hold for a week, you still have to wait for 77,666. If you're really scared, take a tiny position and add more if it drops further
post-image
BTC-0.67%
  • 1
#Ahr999EntersBottomBuyingZone

AHR999 Drops Below 0.45: Bitcoin Enters a Historically Important Bottom-Buying Zone

The Market Has Reached an Important Point

Imagine watching Bitcoin trade around $80,000, then seeing its price move lower while a long-term valuation indicator enters a historically important zone. You might wonder whether the market is approaching a major turning point or simply experiencing another correction.

That is the situation surrounding the AHR999 indicator on November 8, 2026. Its latest reported reading is approximately 0.429, placing Bitcoin inside the historically
post-image
BTC-0.67%
$PI On the daily chart, every decline in Pi coin comes with high volume, while every rise comes with low volume. High volume means heavy trading, so a high-volume decline means selling pressure exceeds buying pressure, causing the price to fall. Low volume means trading is subdued, with few people buying and few selling. But on the daily chart, even when the price rises, each candlestick is a very small bullish candle, indicating that buying volume is low. For a sustained uptrend, volume must increase on rises and decrease on declines.
post-image
PI-0.60%
  • 4
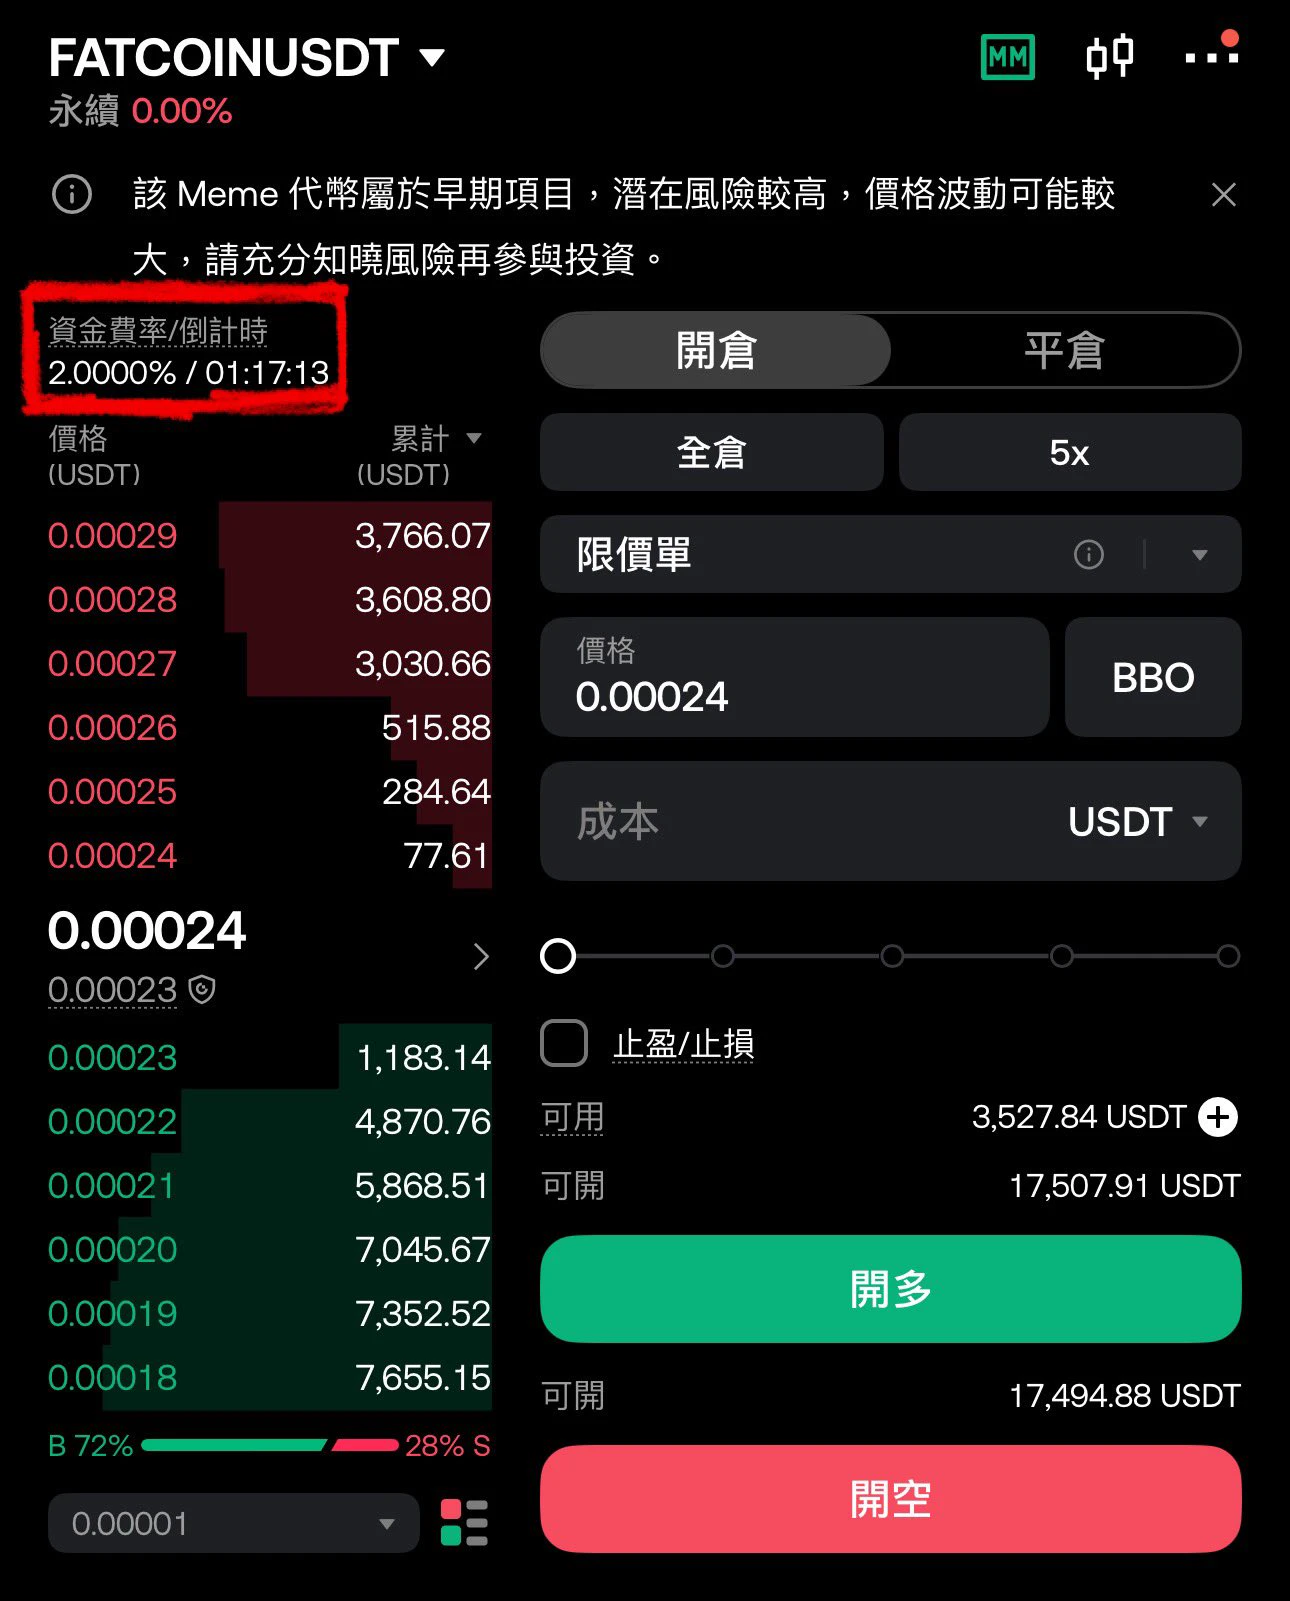
This $FATCOIN rate has already hit the 2% cap—should we still take a shot at a long? 💀💩
post-image
FATCOIN+2.70%
#Ahr999EntersBottomBuyingZone
𝗔𝗵𝗿𝟵𝟵𝟵 𝗙𝗮𝗹𝗹𝘀 𝗕𝗲𝗹𝗼𝘄 𝟬.𝟰𝟱 𝗮𝘁 $𝟳𝟱,𝟳𝟴𝟯: 𝗪𝗵𝗮𝘁 𝘁𝗵𝗲 𝗕𝗼𝘁𝘁𝗼𝗺-𝗕𝘂𝘆𝗶𝗻𝗴 𝗦𝗶𝗴𝗻𝗮𝗹 𝗠𝗲𝗮𝘀𝘂𝗿𝗲𝘀, 𝗪𝗵𝗲𝗿𝗲 𝗶𝘁 𝗦𝗶𝘁𝘀 𝗮𝗻𝗱 𝗪𝗵𝗮𝘁 𝗶𝘁 𝗖𝗮𝗻𝗻𝗼𝘁 𝗣𝗿𝗼𝗺𝗶𝘀𝗲
With Bitcoin at $75,783, the Ahr999 index is back in its bottom-buying zone. The index sat at 0.50 on October 25, touched 0.45 on October 31 and November 1, read 0.44 on November 3 and 0.45 on November 4, per CoinAnk. A price of $75,783 puts it at roughly 0.43 by my math. The signal is back after about 80 days outside the zone, since the previous stretch bel
post-image
BTC-0.67%
NVDA+2.80%
NDAQ+0.28%
  • 2
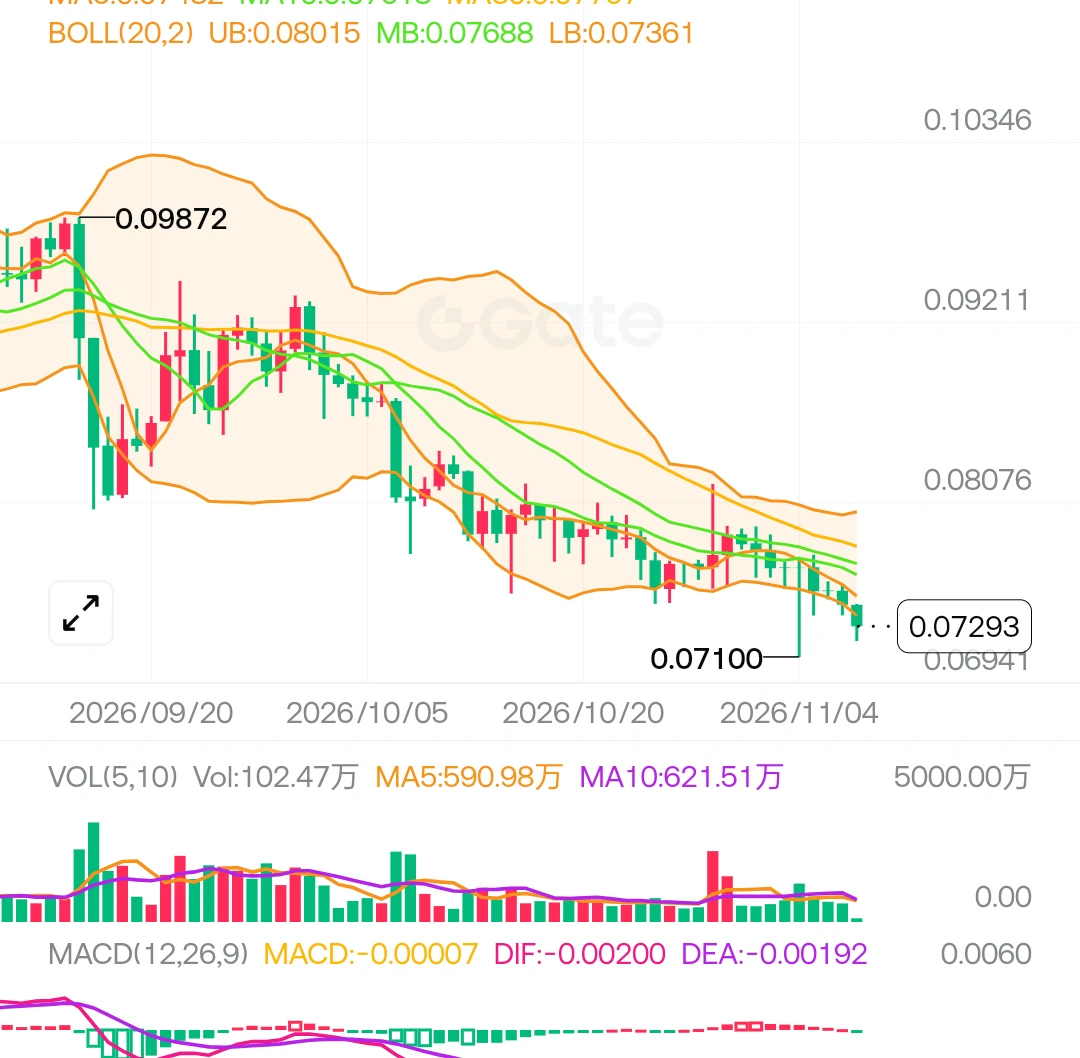
The wick down to 0.0759 definitely swept the stop-loss orders. $UAI now looks more bullish, as highly leveraged shorts have been cleared out. Take profit: 0.0950 Stop loss: 0.0728 Hot names: $AIOT : Current price 0.11723 - 24-hour change: +14.65%$ETH : Current price 2,232.52 - 24-hour change: -0.64%
post-image
UAI-7.58%
AIOT-2.28%
  • 1
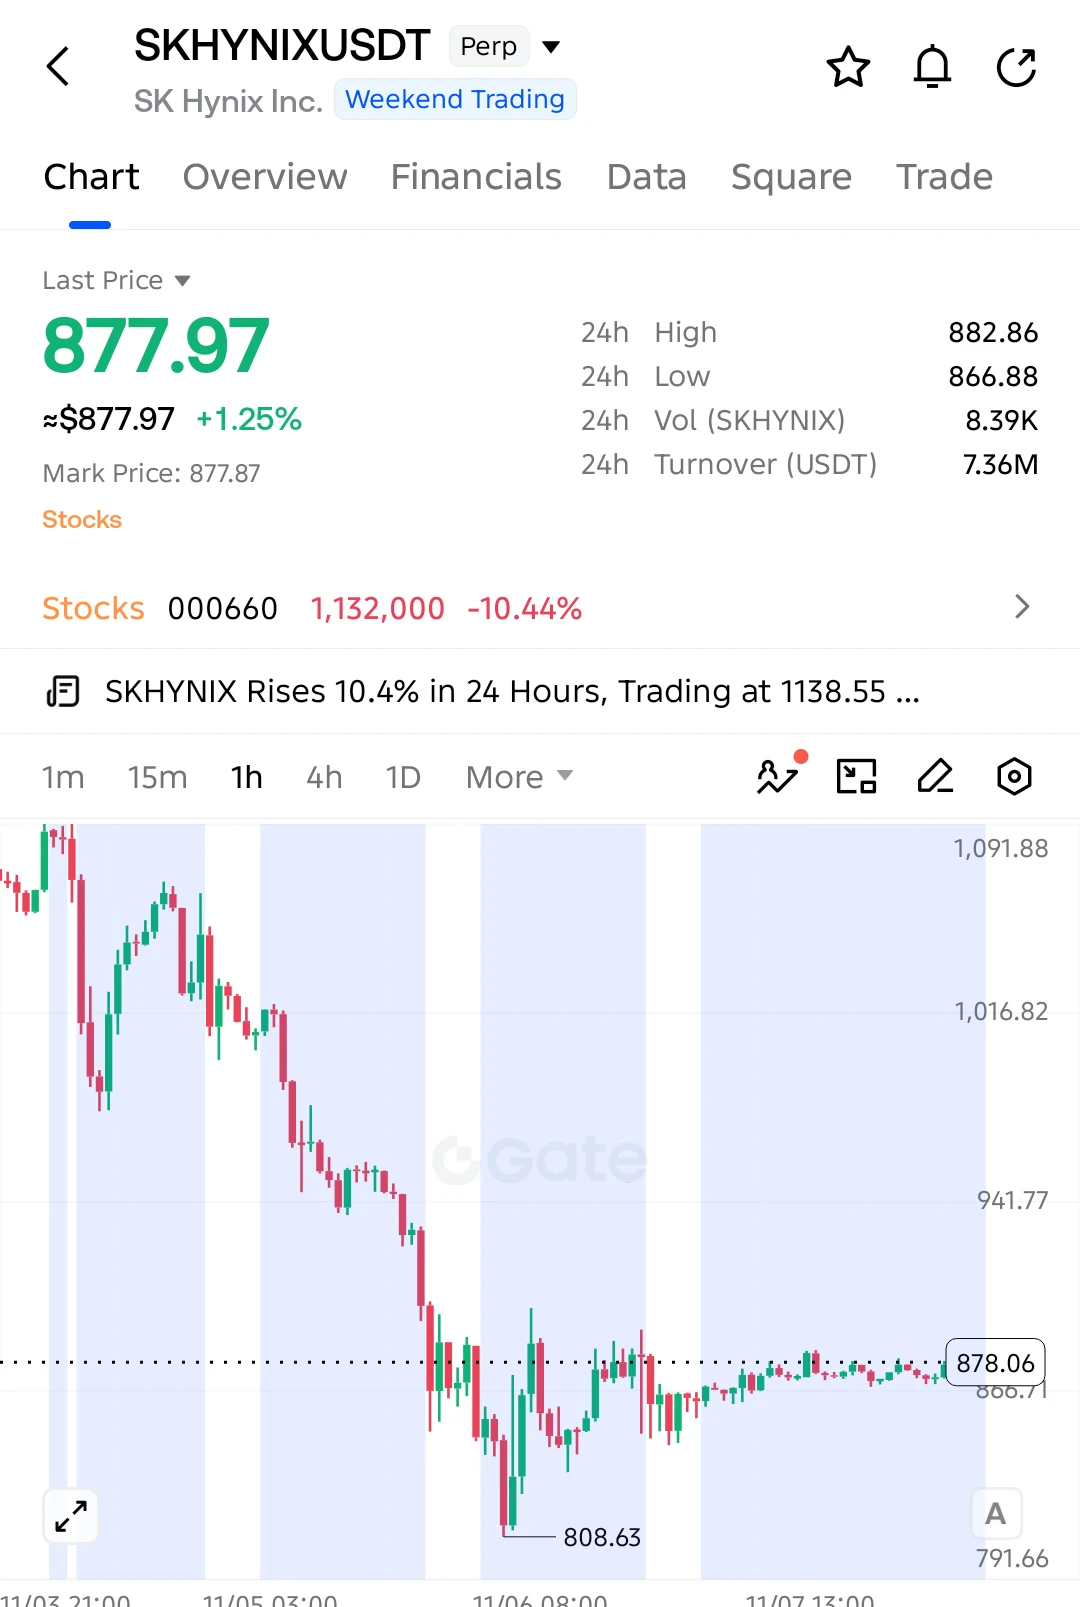
$SKHYNIX LONG SETUP — BIG RECOVERY AHEAD?

$SKHYNIX is showing signs of stabilization after a massive sell-off. Buyers are defending the 866 support area, with a potential recovery developing!

Entry: 877.97
SL: 865.00

TP1: 892.50
TP2: 905.00
TP3: 920.00
Final Target: 938.86

Selling pressure has eased as price consolidates near 878. Buyers are gradually rebuilding strength, and a breakout above 882.86 could open the door toward 905 and higher.

Invalidation: A sustained break below 865.00 weakens the bullish setup.

Keep your eyes on $SKHYNIX!
post-image
SKHYNIX+1.41%
$LINK 🔎

LINK, the native token of Chainlink, is trading at approximately $10.80. On the charts, the price remains below all short- and medium-term moving averages. While LINK shed nearly 19% of its value in October—falling significantly below its late-September peak—the same period saw major ecosystem projects announce their transition to Chainlink’s cross-chain infrastructure. Meanwhile, Bitcoin is struggling to hold the $75,000 level, and the market’s attention is firmly fixed on Tuesday’s U.S. CPI (Consumer Price Index) data.

Where does the contradiction surrounding LINK begin?

In the c
LINK-0.18%
  • 3
  • 2
$UAI is showing significant volatility, with the latest market snapshot indicating heavy selling pressure. The liquidation around $0.07784 highlights an important downside reference, while the current recovery area needs confirmation before considering a bullish reversal. A sustained reclaim of resistance could signal that buyers are regaining control.
Support: $0.1150 – $0.1200
Resistance: $0.1300 – $0.1360
Next Target: $0.1450 – $0.1550
Bullish Confirmation: Holding above $0.1200 and reclaiming $0.1360 could strengthen recovery momentum. A rejection may bring another liquidity sweep toward
post-image
UAI-7.58%
#USNonfarmPayrolls

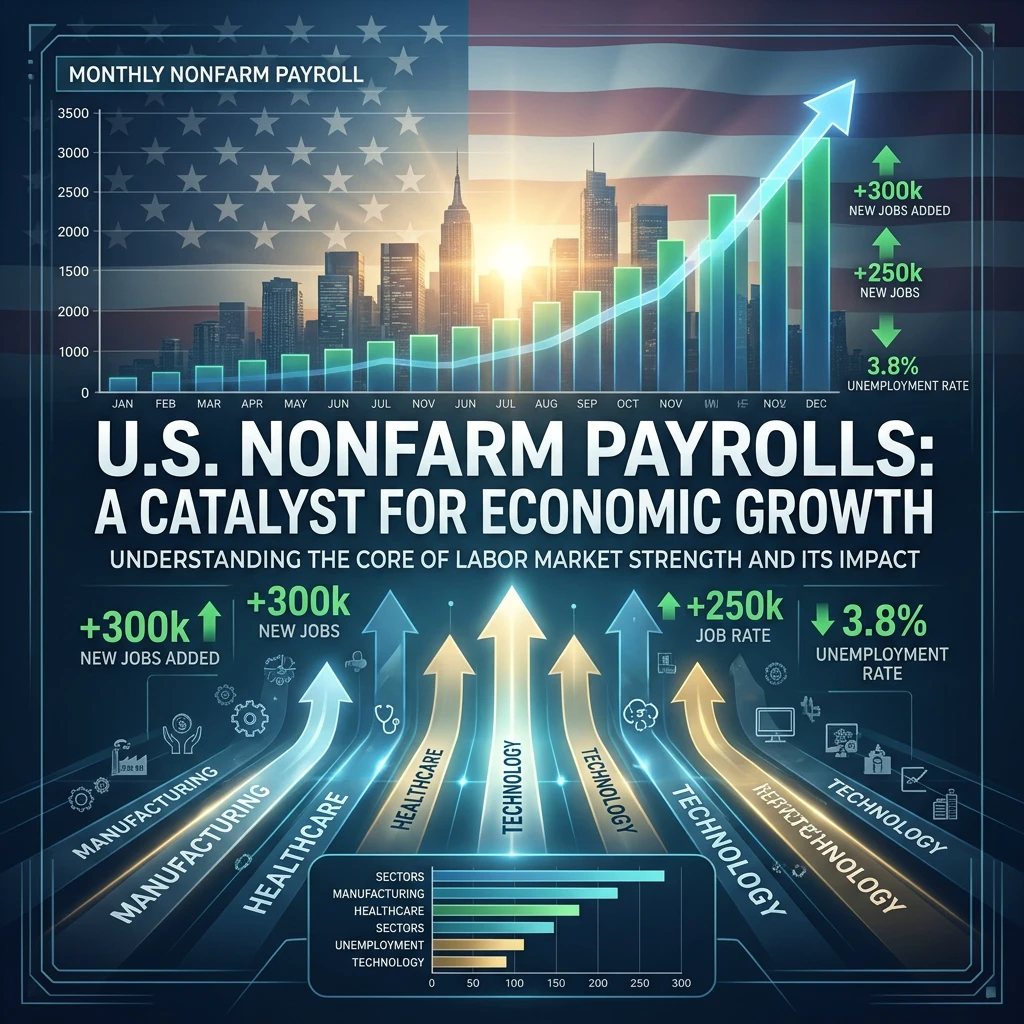
US Jobs Deliver a Surprise Recovery: What October Payrolls Reveal About the Economy

A Sharp Change in Direction

A month ago, the US labour market appeared to be losing momentum. September added just 29,000 jobs, raising concerns about weaker hiring and a possible slowdown in the economy. Now the picture looks different. October brought a much stronger increase of 165,000 jobs, showing that employers added workers at a faster pace than recent months suggested.

This change is important because the US jobs report is one of the most closely watched economic releases. It hel
post-image
BTC-0.67%
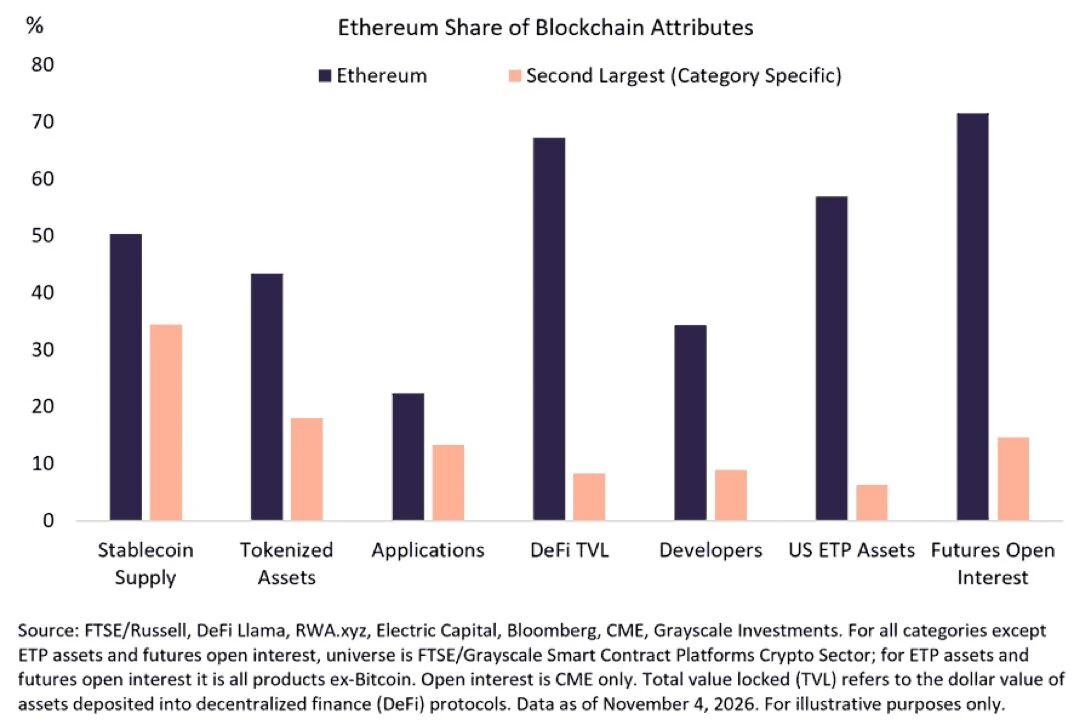
Ethereum continues to strengthen its position as the leading blockchain ecosystem, and Grayscale’s latest assessment adds another interesting layer to that story.

According to the report, ETH ranks No. 1 among smart contract platforms across five major categories:

• Stablecoin supply
• Tokenized assets
• Application ecosystem
• Developer activity
• Investment products

What stands out here is the combination of institutional interest, real-world asset adoption and developer participation.

Ethereum isn't just competing on price movements. Its ecosystem continues to attract capital, builders
post-image
ETH-1.26%
GT-2.41%
Load More

Join 40 M users in our growing community

⚡️ Join 40 M users in the crypto craze discussion

💬 Engage with your favorite top creators

👍 See what interests you

Trending Topics

USCPIDataIncoming

1.04k Views1.48k Discussing

The U.S. October CPI report will be released on November 10 at 8:30 a.m. ET. September CPI came in at 3.7% year over year, and markets will be watching closely for signs that inflation is cooling, especially in core CPI. A softer-than-expected reading could strengthen rate-cut expectations, while hotter inflation may pressure risk assets through higher Treasury yields and a stronger dollar. How do you think this CPI print will move $BTC, U.S. stocks and gold?

USAIStocksHitHard

23.56k Views3.69k Discussing

USNonfarmPayrolls

40.34k Views4.38k Discussing

View More