Square
Following
Hot
News
Profile
Share your thoughts
placeholder
Article
A technical analysis and a potential trade plan of $PI ‌
Chart Analysis
1. Higher Timeframe (1H Chart ):
· Trend: Bearish to Neutral. The price suffered a significant drop from ~0.088 to a low of 0.07749. It is currently attempting to recover.
· Moving Averages: The price (0.08150) is trading just above the MA5 (0.08122) and MA10 (0.08104), but slightly below the MA30 (0.08138). This indicates short-term consolidation and a potential fight for trend reversal.
· MACD: The MACD line (DIF) is below the signal line (DEA), and both are below the zero line. However, the histogram is showing signs o
PI-0.15%
Go long on this move around $JTO
. Entry: 0.5171 - 0.5247Target range: 0.5460 / 0.566Stop-loss: 0.5016JTO longs have rebounded strongly from the bottom and are gathering momentum to reclaim the range! Note: If the 15-minute chart cannot hold MA7, it may retest the 0.50 support level. Don’t go all-in, guys. Position size should be determined based on your own account situation. Looks like the time has come.👇👇👇Today’s focus: $RLC and $ETH .
post-image
JTO-7.35%
RLC+36.81%
ETH-2.76%
$BTC Both longs and shorts blown out: Big players used macro bearish news to wipe out 1 billion in long positions—is the bottom still not in? The plunge is not the end; big players are clearing the runway. The 1 billion liquidation chart shows longs accounting for 90%, while institutional smart money instead opened short positions around 81k. Their intent is quite clear: using macro bearish news as a shovel to specifically wash out leveraged retail traders chasing rallies. Personal view: Don’t rush to buy the dip now. On the 1-hour chart, the price is consolidating within a narrow range after
post-image
BTC-0.35%
In October, market sentiment toward Ethereum is bearish, with the vast majority of participants believing ETH has momentum to test below 2400.
Breaking below 2400 is the baseline expectation; a further decline to 2300 or 2200 would be an unexpected downside move with a significant odds advantage.
Overall, short-term downside expectations are strong, but the probability of an extreme plunge is limited, with the main strategy focused on trading range-bound bottom-finding.
post-image
ETH-2.76%
After retreating to the $81,000 level, Bitcoin recovered and settled around $82,000. The daily decline narrowed to 1.54%. However, the market remains focused on the $81,000 mark; this is precisely where buyers and sellers are squaring off.
The $81,000–$81,500 range is an area where buy orders have concentrated in recent days, with buyers increasing their positions there. Analysts identify the $81,119 level as support, while pointing to the $86,500–$86,750 range as resistance. In other words, $81,000 is not an arbitrary level; it is the floor that has held firm in recent weeks.
So, why did it d
post-image
User_any
#BTCPullsBackTo81000 Yo, so check it. Bitcoin slid under $82K for the first time in three weeks, and nah, it ain't one thing that did it. Three things hit at once, straight up.
First off, the Fed. Them September minutes dropped October 7, and all nineteen of 'em backed that quarter-point hike to 3.75–4.00%. Most said yeah, another one by year-end probably makes sense. But here's the thing — the market ain't buying it for October. Odds sitting at like 17% for October, but December? Around 70%. And that matters, 'cause when rates stay high, holding stuff that don't pay you nothing gets expensive. 10-year yield hanging near 5.3%, 30-year near 5.67%. That's decades-high type energy.
Second thing — Iran. Word is the White House told the Pentagon to get strike options ready, but nothing popping off before the midterms. Strait of Hormuz still a mess. Brent at $101.53, WTI at $89.39. Expensive oil means inflation ain't going nowhere, and that keeps the Fed chilling on the sidelines.
Third thing, and this the one that really hurt — leverage. Around $709 to $769 million in positions got liquidated in 24 hours. Longs took $647 to $685 million of that. Bitcoin longs alone, $172 million. Roughly 140,000 accounts got smoked. Open interest dropped 3.27% down to about $52.57 billion. That ain't people changing their minds — that's forced selling, plain and simple.
Institutional money? Mixed bag. US spot Bitcoin ETFs pulled in $118.86 million last session, total assets near $110.68 billion. But Ether ETFs? Lost $202 million same day. Them two ain't moving together no more.
Supply side — government wallets moved 12,267 BTC, 'bout $1.01 billion, to fresh addresses. No exchange deposit, so looks more like reshuffling than dumping.
Chart-wise, Bitcoin ran from $83,299 down to $80,397 before settling near $82,063. The $80,500 to $81,500 zone? That's where last month's highs sat, and that's what everybody watching. Hold there, we cool. Break it, and now we asking if the forced selling is done.
Next real test? October CPI and PPI. That's gonna tell us if inflation really cooling or if this pressure still building.
This ain't investment advice, just keeping it real.
$BTC ‌
BTC-0.37%
  • 4
  • 1
$BTC Someone wise once said, “Buy when there’s blood on the streets.”
And it’s safe to say, there is plenty of blood on the streets right now.
You see, before price broke out of the previous range, we saw a short deviation below the lows followed by an explosive move to the upside.
Now, after a decent pullback and with price retesting the highs of the previous range, all of a sudden everybody wants to long lower and seems to be waiting for the exact same level around $75k.
I hate to break it to you, but the last time everybody was waiting for a better entry, they all got massively frontrun and
post-image
BTC-0.37%
$JCT ‌JCTUSDT
😂 Why did JCT pump? Because it finally got its act together — now it's overacting.
---
📉 Short
Entry: 0.00250 – 0.00258
TP1: 0.00230
TP2: 0.00210
TP3: 0.00190
SL: 0.00270
📈 Long
Entry: 0.00210 – 0.00220
TP1: 0.00240
TP2: 0.00260
TP3: 0.00280
SL: 0.00195
🔑 Key Levels
Resistance: 0.002577 / 0.002715
Support: 0.00230 / 0.00200 / 0.00170 / 0.001313
⚠️ Up 46% — overbought, tight SL advised.
⚠️ Not financial advice. DYOR & manage risk.#BTCPullsBackTo81000
post-image
JCT+44.88%
The whole $ZEC saga is so absurd it makes me laugh.
Someone posted online that they held from 1700 all the way down to 1100. Even eight years of war resistance didn’t involve tactics like that. They gave themselves the title of “the most resilient bagholder.” Fair enough—bro, you can really hold the line. I salute you.
An old coin that once valued privacy has fallen this far and ended up as a meme across the entire internet, which shows just how badly everyone has been fleeced—so broke they can only survive on jokes.
Laugh all you want, but I genuinely wouldn’t dare catch it at this level. Let
post-image
ZEC-1.95%
$LIT Recovery structure ... next target 4.30
LIT is showing a solid recovery trend after rebounding from the 3.49 low, with buyers now pushing the price back above 3.70. Next price: 3.75 Next target: 4.00 Extended target: 4.30 Key support: 3.30 As long as 3.30 holds, I believe the broader recovery structure will remain valid, with targets still pointing toward 4.00–4.30. A clean break above 3.75–3.80 would be the first strong confirmation that buyers are back in control. Trading at $LIT
post-image
LIT+5.44%
$ZEC
The ZEC short opportunity is here again
Yesterday’s ZEC plunge was incredibly satisfying
Big Hammer previously posted that ZEC had to reach 1100
Yesterday proved that perfectly
It currently feels like ZEC’s decline is not over yet
No obvious divergence has appeared
Although it has already recovered today from yesterday’s drop
The bullish candlestick momentum is average
There is also a relatively high degree of overlap
If it breaks above 1221.13 with increased volume next
And manages to hold above it
Then shorting should be approached cautiously
Currently, ZEC
Could move in either directi
ZEC-1.90%
$SI ‌SIUSDT
😂 Why did Super Inu pump? Because it finally learned a new trick — now it's chasing its tail.
---
📉 Short
Entry: 0.0290 – 0.0298
TP1: 0.0270
TP2: 0.0250
TP3: 0.0230
SL: 0.0305
📈 Long
Entry: 0.0230 – 0.0240
TP1: 0.0260
TP2: 0.0280
TP3: 0.0300
SL: 0.0215
🔑 Key Levels
Resistance: 0.02979 / 0.03131
Support: 0.0250 / 0.0220 / 0.01881
⚠️ New listing, high volatility — tight SL advised.
⚠️ Not financial advice. DYOR & manage risk.
post-image
SI+29.28%
$OGN The most dangerous misconception right now is equating “strong momentum” directly with “it is safe to keep chasing.”
This time, let’s ignore the gainers and losers rankings and only look at the price position. The current price is 0.04249, approximately 47.21% above the 1-hour support at 0.02243 and 25.79% below the resistance at 0.05345.
My criteria are simple: only a breakout above 0.05345 followed by continuation counts as an upside continuation; a break below 0.02243 invalidates the previous assessment. The 1-hour and 4-hour trends are relatively strong, with RSI at 49 and 77, respect
post-image
OGN+104.88%
$DOGE has no trading volume anymore.
post-image
DOGE-2.63%
Short around $ETH 2490, take profit at 2460–2410, stop loss at 2505. Follow me for precise strategies shared daily.
post-image
ETH-2.76%
$AVAX Key short-term levels are 10.18 and 9.68: the current price is 10.277, MA5=10.1826 has crossed below MA20=10.3064, and the short-term moving averages are weakening. However, the price remains above MA5, indicating weak consolidation after a sharp decline. It is down 6.67% over 24h, with a trading volume of 61.3M USDT. The volume does not indicate panic selling, suggesting that selling pressure is mainly from long-position reductions rather than a broad-based exit.
From a fund-flow perspective, the Fear & Greed Index remains at 59, still in the greed range, meaning that bottom-fishing fu
post-image
AVAX-5.45%
ORCA-11.05%
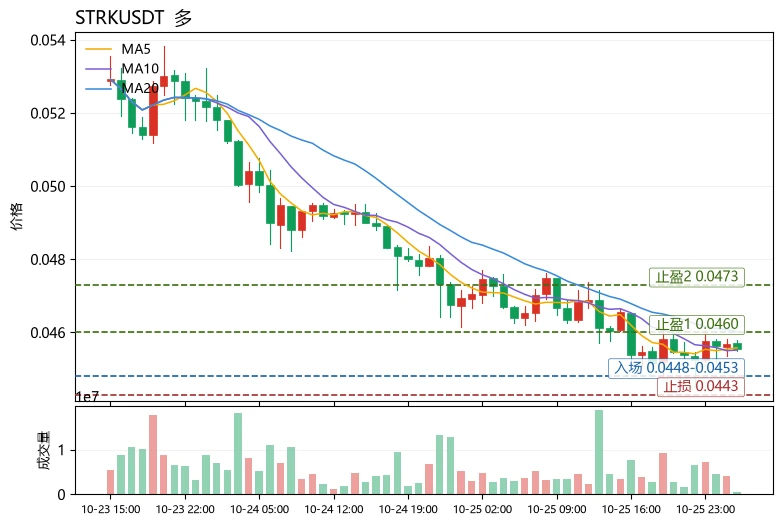
STRK+37.83%
BTC and Ethereum market surges predictions
live-cover
LIVE2,883
#GateMoneyOfficiallyLaunches
Switching between apps just to make one move has become a normal pain. You hold funds in one place, you need to pay from another, you check fee, you check FX rate, you wait for arrival, you track balance across three screens. Even a small cross border move can take more effort than it should.
Last month I had a clear case. I had to pay a partner overseas. My assets were in one app, my spend account in another. I had to shift assets to main balance, swap to local money, then open a third app for cross border send. Each step had its own fee, its own FX, its own wait
post-image
BTC-0.37%
ETH-2.76%
SAND-3.95%
NVDA-2.86%
AAPL+1.12%
Market sentiment has entered the “greed” zone again, with the Fear and Greed Index hitting 70 today. You may not usually pay much attention to this figure, but simply put, it combines data such as volatility, trading volume, social media buzz, and Bitcoin dominance into a score from 0 to 100. Below 25 is extreme fear, while above 75 is extreme greed. It is currently right at 70, which falls in the “greed” zone.
What’s interesting is that this index is more useful as a reference when it reaches extreme levels. Extreme fear often appears when the market is deeply oversold and sentiment is at its
post-image
BTC-2.02%
ETH-4.16%
[ NEW STREAMER ] TODAY MARKET TALK
live-cover
LIVE1,968
Load More

Join 40 M users in our growing community

⚡️ Join 40 M users in the crypto craze discussion

💬 Engage with your favorite top creators

👍 See what interests you

Trending Topics

GateAtTOKEN2049

35.16k Views20.76k Discussing

Gate brought a series of major events to TOKEN2049 Singapore! From the official launch of Gate Money to the F1 Red Bull driver meet-and-greet and the Gate Gala, we witnessed a new chapter of "One Gate, Borderless Finance." Which moment from TOKEN2049 stood out most to you?

BTC Pulls Back to 81000

25.4k Views35.67k Discussing

AIStocksFallALABDropsOver9%

24.57k Views547 Discussing

View More