Share your thoughts
placeholder
Article
BTC & ETH Volume Expands Near Resistance! Is the Market Preparing for a Bigger Move?
live-cover
LIVE668
Everyone’s staring at DOGE’s bounce—but the 4H chart is quietly building a trapdoor.

$DOGE /USDT - SHORT

Trade Plan:
Entry: 0.08907 – 0.08961
SL: 0.09191
TP1: 0.08742
TP2: 0.08613
TP3: 0.08421

Why this setup?
- RSI (15m) at 53.85 shows zero momentum behind that push—dead cat doing gymnastics.
- ATR (1h) at 0.001069 means volatility is compressing right before the drop.
- 1D trend is range, but our SHORT bias (55.4) targets TP1 at 0.08742, then TP2 at 0.08613—that’s a 3.6% slide from entry.
- Why now? Price is hugging 0.08934 while invalid sits at 0.08701—we’re one wick away from a
post-image
DOGE-2.73%
This profit has me feeling nervous, worried that the market will catch on tomorrow and blacklist me.
As the market repeatedly swung back and forth intraday, everyone was betting on a second bottom. I first took a look at $DGAI ’s structure: sideways movement at the bottom, key levels gradually rising, and funds quietly entering. Against this backdrop, I cautiously opened a long position around 0.6959, set my stop-loss a little lower, and left the rest to the trend.
The trend really came through. Starting from 0.6959, the current price has already climbed to 0.7899, with floating gains of +266.1
post-image
DGAI-0.10%
SOL+2.00%
ZEC+20.01%
$BTC Please help fill this out so I can see where I really stand.
post-image
BTC-0.05%
$FLOCK Signal】Long on 1H pullback support + signs of a short squeeze from negative funding
$FLOCK Buy/sell depth 3.86, with the price at 0.07193 above the 1H Bollinger middle band. The 4H MACD histogram narrowed to 0.0019, while the 1H histogram weakened to -0.0009. The price has not broken the previous low, showing a clear price-volume divergence. Funding rate is -0.0598%, with shorts paying to hold positions; OI remains stable with no signs of exits.
🎯Direction: Long
⚡Entry/limit order: 0.0717142 - 0.0719300
🛑Stop-loss: 0.0712107
🚀Target 1: 0.0730090
🚀Target 2: 0.0735484
🛡️Trade manage
post-image
FLOCK+14.85%
BTC-0.05%
ETH+0.69%
SOL+2.01%
BAT pump pump bigpump ath go
post-image
BAT+2.33%
BIGPUMP-3.85%
$BTR began coming under pressure and pulling back from around 0.05129. After entering, I watched BTR continue to grind lower without providing a decent rebound. I held the short for several hours. That kind of slow decline in the middle is the most trying, but I didn’t rush to act because key support below never appeared.

After falling to around BTR, consecutive lower wicks began appearing on the chart. As planned, I first closed 80% of the position and moved the protection level lower on the remainder. There’s no room for greed with this kind of move: lock in the profits first, and see whet
post-image
BTR-2.20%
ZEC+20.01%
BTC-0.04%
🚨 $XAN (ANOMA) BREAKS OUT +25% DeFi Uptrend Accelerating
📊 $XAN /USDT
📈 Direction: LONG
⚡ Leverage: 5x
🎯 Entry Zone: 0.01700 – 0.01800
🎯 Take Profit Targets:
TP1: 0.01835 +11%
TP2: 0.02000 +29%
TP3: 0.02200 +57%
🛑 Stop Loss: 0.01550
$XAN ‌#Gate60MillionUsers
post-image
XAN+21.69%
  • 11
  • 2
$BTC This is what I think price action could look like over the next weeks/months.
Right now, price is moving within a defined range with liquidity building up on both ends.
If you compare the current structure to the bear market fractal from 2022, it looks very similar.
Back then, we saw a short deviation above the range where price swept the previous high, followed by a larger pullback to retest a recent breakout level.
This was then followed by the next major move to the upside.
I believe this time around could play out in a very similar way.
A final push above the current highs to take out
post-image
BTC-0.04%
  • 2
  • 1
Everyone's watching UAI's 15m RSI at 73.8—but that's the exact moment smart money loads the truck.

$UAI /USDT - LONG

Trade Plan:
Entry: 0.59538 – 0.61528
SL: 0.50986
TP1: 0.67694
TP2: 0.72467
TP3: 0.79628

Why this setup?
- 95% confidence on a 4h LONG isn't a guess; it's a signal.
- 1D trend is bullish, and the 1h ATR (0.0397) shows volatility is compressing—breakouts feed on this.
- Entry zone 0.595–0.615 is a gift before TP1 at 0.677 (up ~12%).
- The 15m RSI overbought? That's a pause, not a reversal—momentum is shifting higher.

Debate:
Are you fading this 4h long because of a 1
UAI+17.59%
finished playing GTA 5 for the first time in 7 years
post-image
🚨 $FARTCOIN /USDT BULLISH REVERSAL & CONTINUATION
📊 TRADE SETUP OVERVIEW
Pair: $FARTCOIN /USDT
Direction: LONG / BUY
Leverage (Futures): 3x – 5x (Isolated)
🎯 KEY LEVELS & SIGNAL PARAMS
Entry Zone: $0.17500 – $0.18000
Take-Profit Targets:
🎯 TP1: $0.18750
🎯 TP2: $0.20700
🎯 TP3: $0.22400
Stop-Loss (SL): $0.16600
$FARTCOIN ‌#Gate60MillionUsers
post-image
FARTCOIN+5.80%
  • 8
  • 1
I had just switched the software to the background, and it shot right back up—is it playing hide-and-seek with me? I thought $OPENAI was going to drag its feet again today, but it gave me no time to react at all and went straight up.

A few days ago, the last thing I saw before bed was that buying pressure was quietly getting stronger, with the key levels on each pullback moving higher. The judgment was simple: the fact that the supply was being absorbed meant someone was ready to make a move. The long direction was decided, so entering was only natural. The moment the pullback held, I got in
post-image
OPENAI-0.32%
BNB-3.55%
ZEC+20.01%
🚨 $UNI /USDT BULLISH BREAKOUT RETEST & CONTINUATION
📊 TRADE SETUP OVERVIEW
Pair: $UNI /USDT
Direction: LONG / BUY
Leverage (Futures): 3x – 5x
🎯 KEY LEVELS & SIGNAL PARAMS
Entry Zone: $6.850 – $7.000
Take-Profit Targets:
🎯 TP1: $7.480
🎯 TP2: $7.850
🎯 TP3: $8.350
Stop-Loss (SL): $6.500
$UNI ‌#Gate60MillionUsers
post-image
UNI+2.15%
  • 8
  • 2
I was just about to go rant on the forum, but then I saw my balance and thought, forget it—the market is always right. 😏 A few days ago before bed, $SPACE was still stubbornly holding on, with each rebound weaker than the last. Every time it reached around 0.007043, it was pushed back down. What about the volume? It didn’t keep up at all. I told the people on board right then: this isn’t an upward move; it’s feeding the shorts.

When I opened the charts this morning, the price slid straight from 0.007043 to 0.005107, and the account showed +539.84%. Feeling good, brothers. I’ve taken most of
post-image
SPACE-0.10%
BNB-3.55%
LAB-4.00%
This was purely the market being in a good mood and casually scattering some gold coins—one just happened to hit me on the head. A few days ago in the afternoon, while watching $CLO ’s order book, I noticed something was off: the price kept hovering around 0.06977, but every dip was quickly bought back up. Signs of strengthening bottom-side buying like that can’t be faked. I added to my long position amid the repeated intraday swings and didn’t say much to anyone, posting only one line: “If the retest holds, I’ll test the waters.” Not long after, the move started paying me back.

I just check
post-image
CLO-5.72%
XRP-0.44%
DOGE-2.73%
Brent Crude Remains Elevated as Markets Assess Possible Supply Disruptions
live-cover
LIVE380
Markets will still be here tomorrow.
Gonna unplug a little for the next 24 hours and enjoy some much needed family time. ❤️
Hope everyone has a great Sunday.
post-image
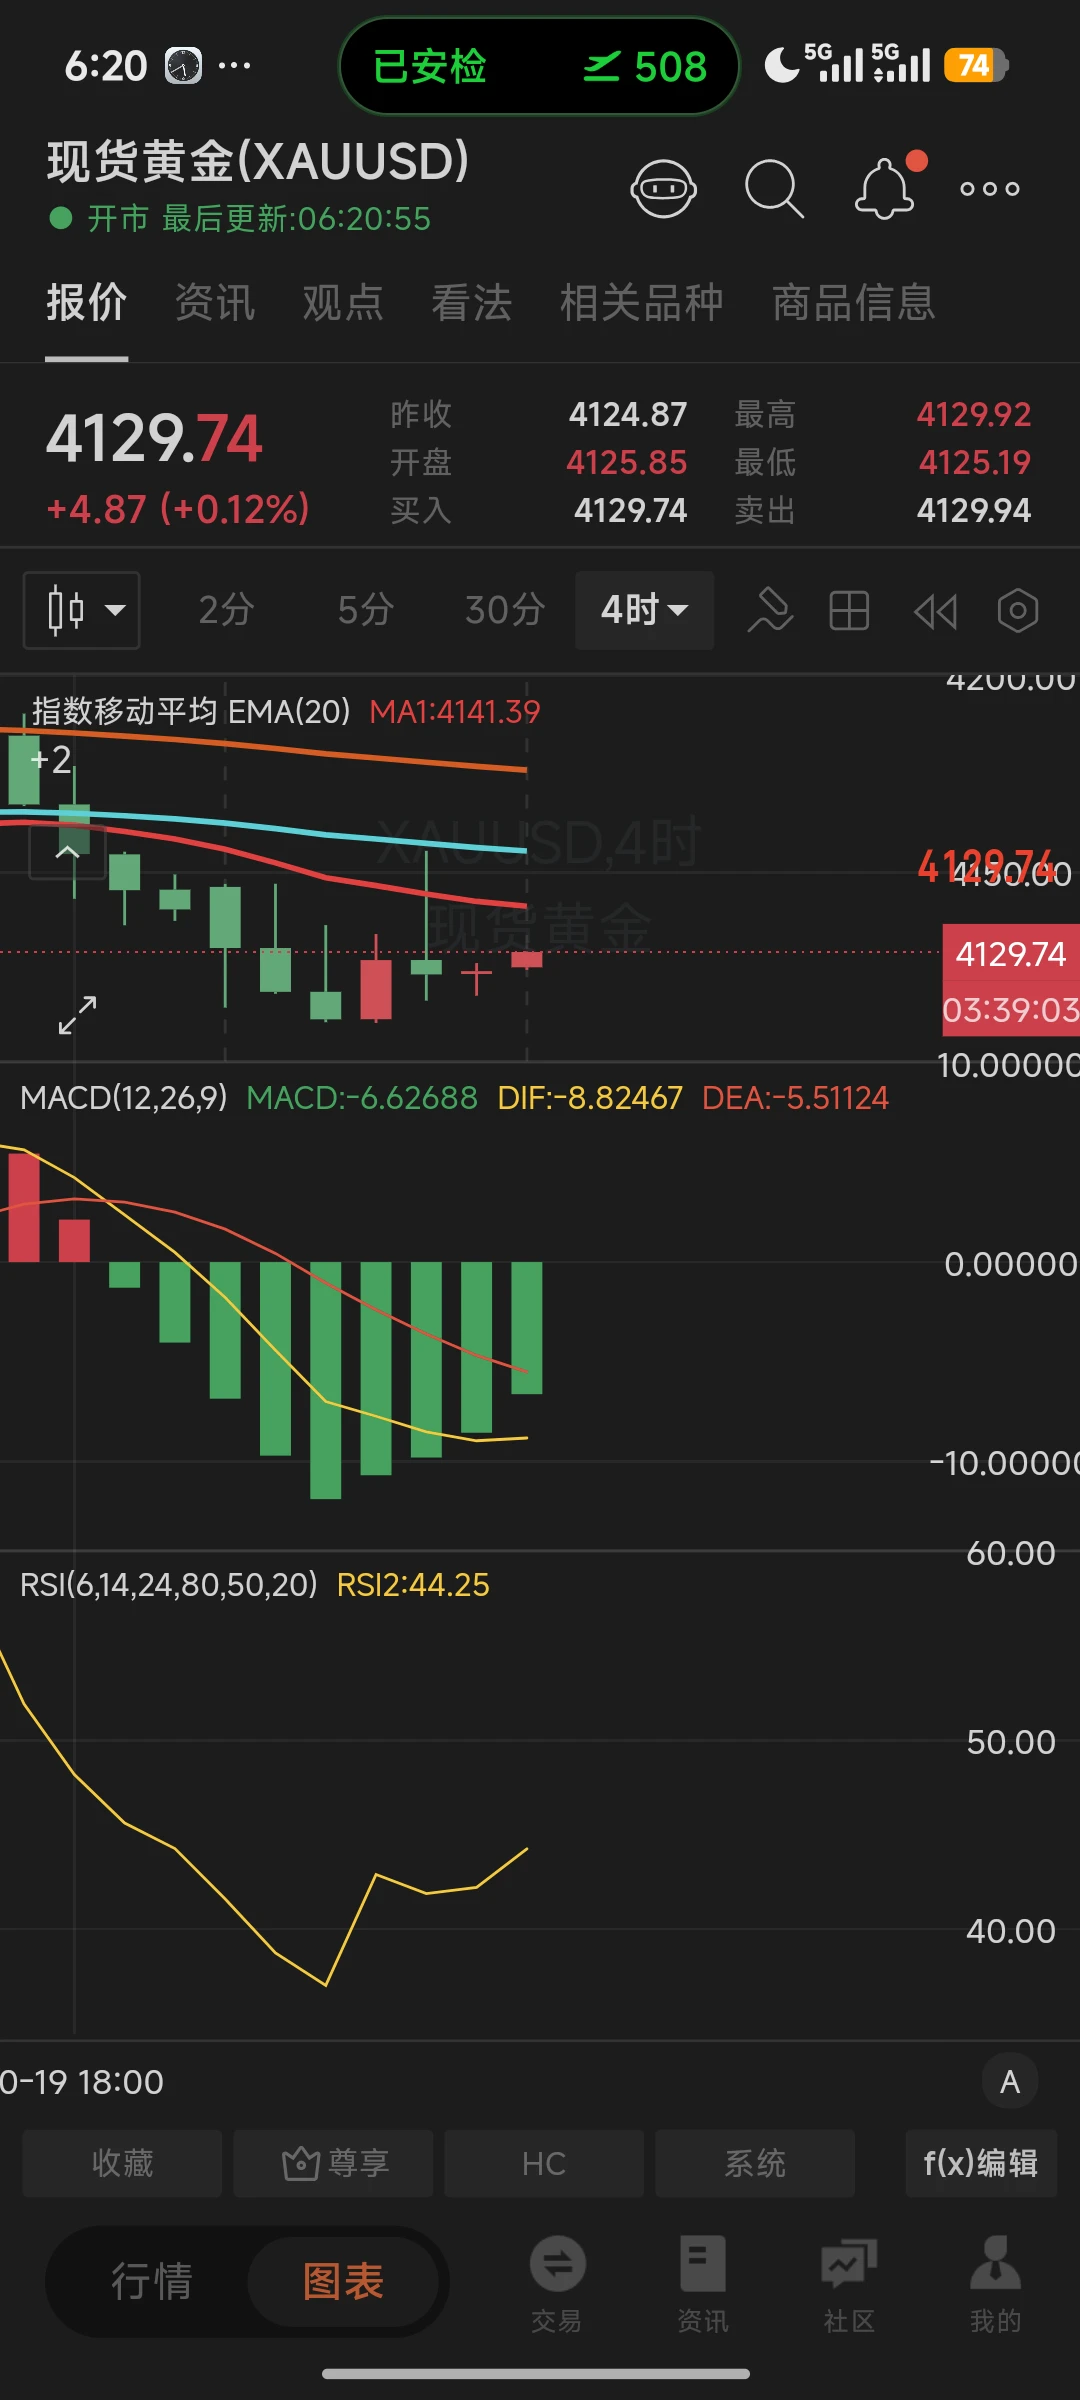
Gold just faked a breakout—$XAU /USDT shorts are armed while everyone stares at the wrong chart.

$XAU /USDT - SHORT

Trade Plan:
Entry: 4433.34 – 4435.44
SL: 4444.42
TP1: 4426.87
TP2: 4421.85
TP3: 4414.32

Why this setup?
- 4H bias flips SHORT with 55% confidence, but the 1D trend is *range*, not trend—so this is a scalp, not a saga.
- RSI on 15m is crushed at 23.56—oversold bounce risk is real, yet price is stalling at 4434.39 resistance.
- Why now? Entry zone 4433.34–4435.44 is a tight trapdoor: TP1 at 4426.87 is only 7 points away, but SL at 4444.42 is just 10—so the risk/reward is
XAU-0.21%
#GateTops7DayNetInflowsGlobally
Weekly Net Inflow Crown Goes To Top Trading Venue
A fresh weekly read on capital flow shows a clear leader at the top. One major trading venue has posted the largest net inflow across the global market for the past weekly window, pulling ahead of all rivals. The data points to strong user trust and a wave of fresh deposits aimed at spot and derivatives books. In a time when traders move funds with care, this kind of lead is seen as a strong vote of confidence.
① Why Net Inflow Matters For Market Health
Net inflow tracks the gap between funds added and funds tak
MU+5.89%
NVDA+0.87%
SNDK+11.88%
TSLA-5.96%
AAPL-2.51%
Load More

Join 40 M users in our growing community

⚡️ Join 40 M users in the crypto craze discussion

💬 Engage with your favorite top creators

👍 See what interests you

View More