Square
Following
Hot
News
Notifications
Profile
Share your thoughts
placeholder
Article
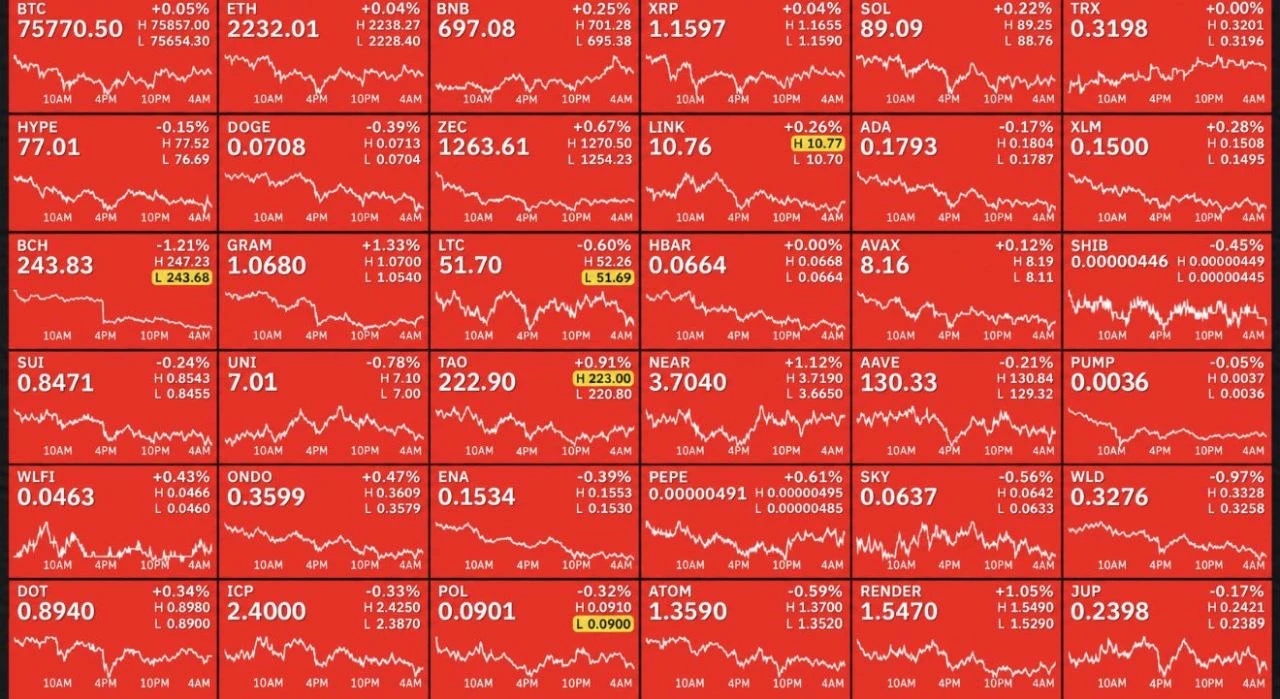
$400B wiped from Crypto during "UPtober" and "Moonvember."
post-image
  • 1
$SOL ‌
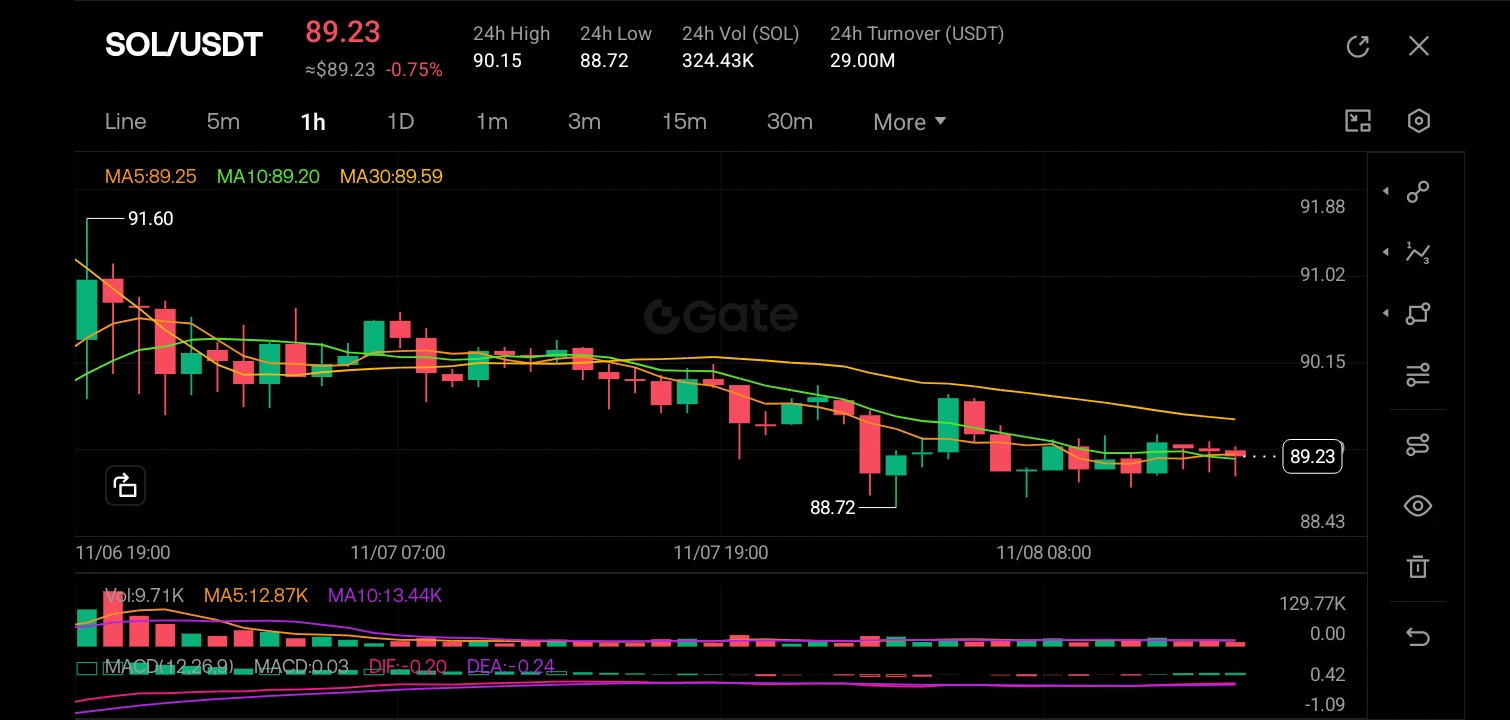
The SOL/USDT 1H chart reveals a prevailing downtrend that has recently hit a floor, currently trading at 89.23 with a -0.75% loss for the session; the price is trading below the long-term MA30 (89.59) which acts as dynamic resistance, while the shorter MAs (MA5 at 89.25 and MA10 at 89.20) have flattened out and are crossing, suggesting the aggressive selling pressure has exhausted itself. The MACD is displaying a potential bullish convergence, with the DIF (-0.020) crossing above the DEA (-0.024) and the histogram turning positive (green), indicating that despite the price being low, d
post-image
SOL-0.77%
  • 2
Trenches
ZIG
Z
bade
b
ZIG
0x8c...1145
Market Cap
$.
Change
.
24h Vol
$.
Holders
.
STONK
S
bade
b
STONK
6GmA...UNgx
Market Cap
$.
Change
.
24h Vol
$.
Holders
.
CLAUDIA
C
bade
b
CLAUDIA
2j5S...W2ZM
Market Cap
$.
Change
.
24h Vol
$.
Holders
.
IDOL
I
bade
b
IDOL
0x3b...ab07
Market Cap
$.
Change
.
24h Vol
$.
Holders
.
FLOAT
F
bade
b
FLOAT
Bv1a...BMmr
Market Cap
$.
Change
.
24h Vol
$.
Holders
.
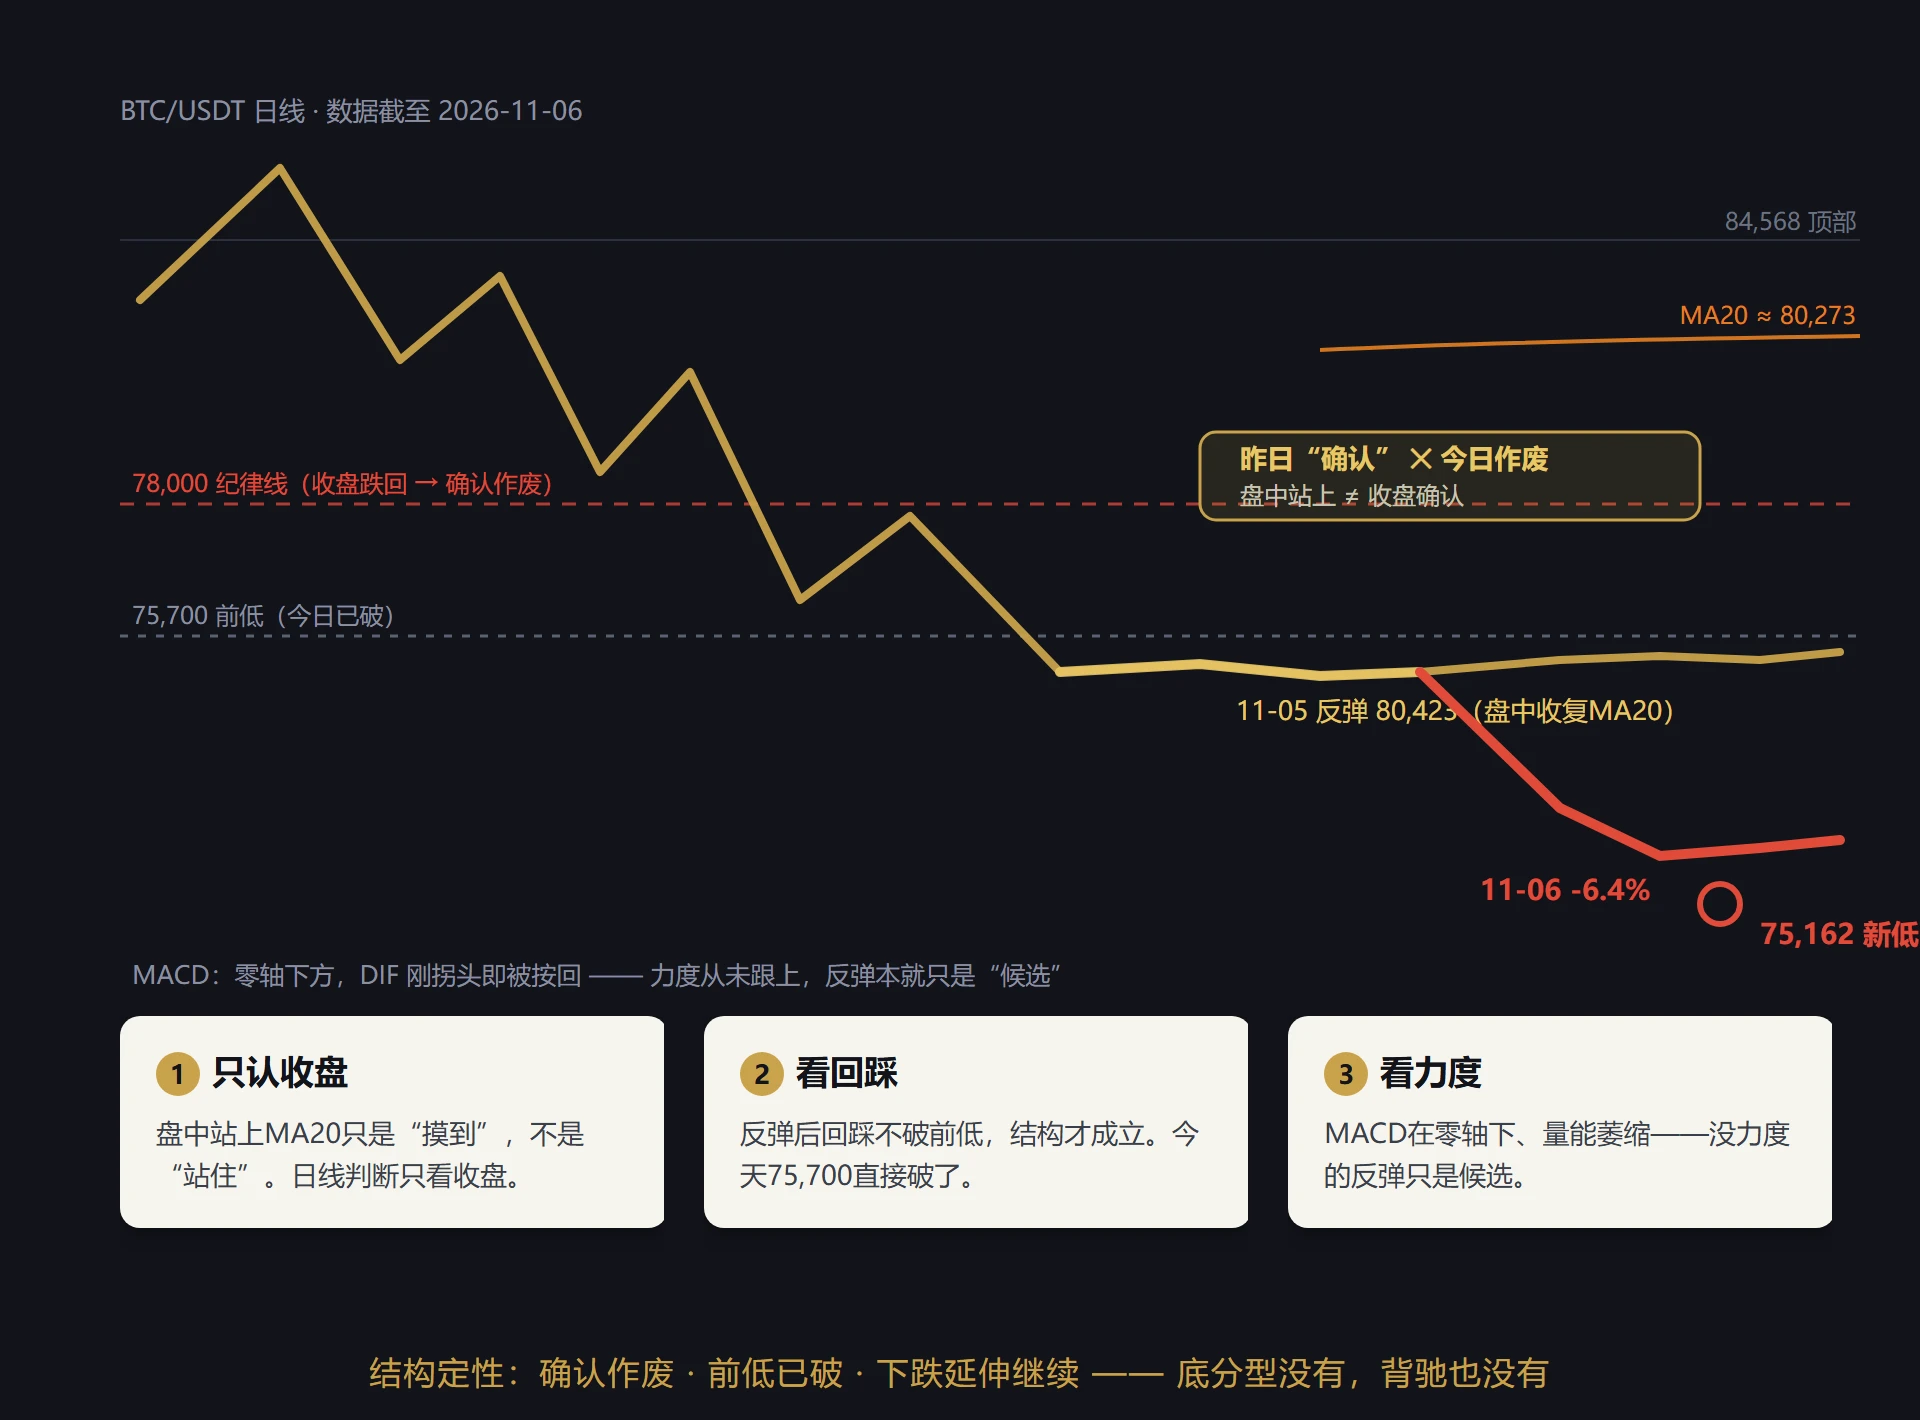
Before the weekly close: Where has this large bearish candle taken the structure?

Draw the chart first, then talk.

This week, a nearly full-bodied bearish candle swallowed the entire August–October high-level consolidation range, with a range exceeding 7%. The weekly candle has not closed yet, but its pattern can already be read: the pattern can be read, but the outcome cannot.

On the daily chart, previous lows have been broken one after another—first, second, and third levels. The current rebound is only a minor repair, and price is still below the discipline line drawn last week. There is
post-image
BTC-0.65%
Tornado Cash-Funded Wallet Builds $26M Bitcoin-Ether Trade
A wallet converted 3,100 ETH into roughly 6.92 million USDC before pairing a Bitcoin long with an Ether short on Hyperliquid.
⚠️ Personal market analysis only. NFA — manage risk and DYOR.
Educational content, not investment advice or a recommendation to buy, sell, deposit, or withdraw any asset. No paid promotion or referral/affiliate links.
post-image
BTC-0.65%
ETH-1.26%
USDC+0.01%
Gm from The Tokenization Tower’s underground gym
See you guys in London for DAS this week 🏴󠁧󠁢󠁥󠁮󠁧󠁿
post-image
$ARB #Arb Consolidating Under Trendline, Breakout Can Lead Good Rally, But Risk Is High Due To Uncertain Iran -Usa Tensions
ARB+1.17%
#GateLaunchesPoSECProofOfSecurity #ShareWeekly
Gate Launches PoSEC (Proof of Security): A Detailed Look at the New Transparency Framework and Reported Cold Storage Metrics
On November 5, 2026, Gate officially introduced Proof of Security, or PoSEC, positioning it as a new framework focused on asset storage structure and extreme-risk coverage. The initiative aims to expand transparency beyond traditional reserve checks by publicly disclosing how platform assets are distributed between cold storage and hot wallets, and by quantifying whether cold storage alone could cover user assets in a defin
  • 3
BTC, ETH PREDICTION MARKET UPDATE
live-cover
LIVE2,077
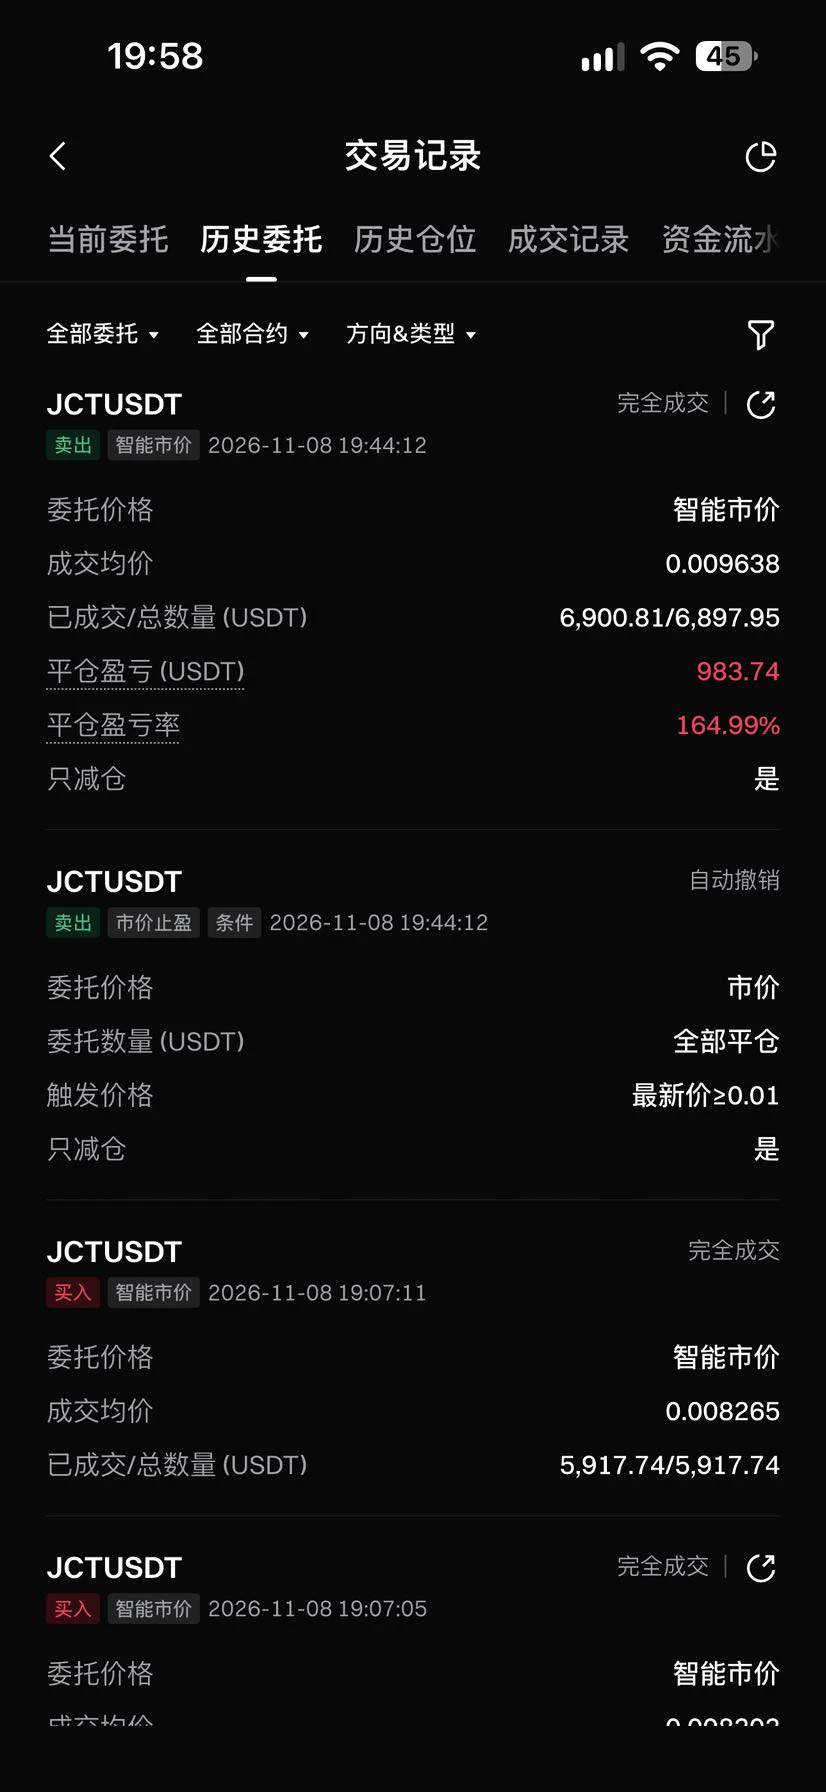
How many more short sellers got wiped out? Give us a number! $JCT
post-image
JCT-3.26%
  • 10
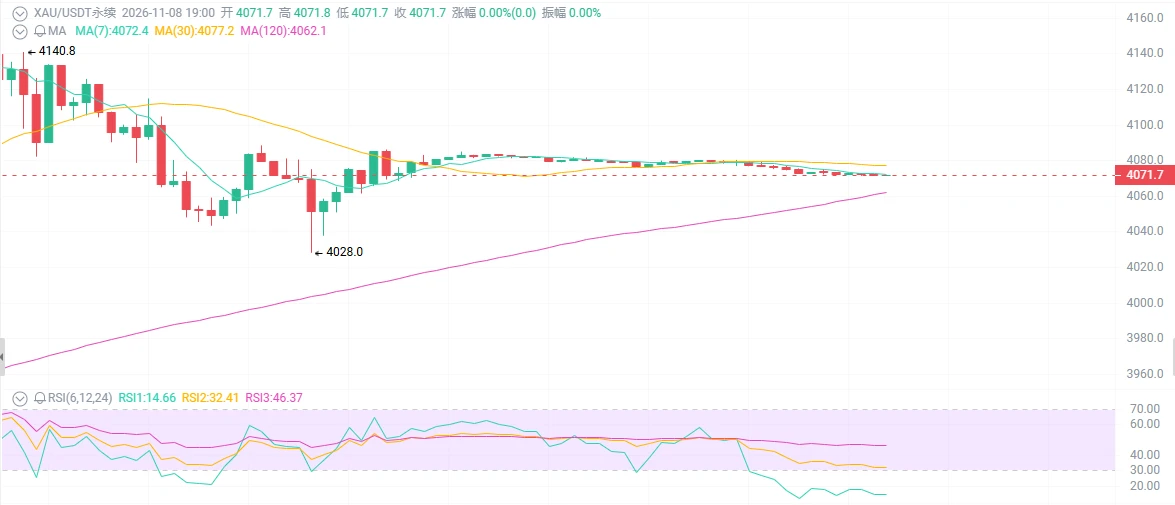
$4,070 gold, and you're still waiting for it to break below $4,000?
Nonfarm payrolls blow past expectations at 165,000, rate hike odds surge to 80%, the dollar climbs above 102—everyone says, “Gold is finished; it’s going to break below $4,000.” Just now, gold surged from 3,870 to 4,140, then plunged back to 4,070, with bulls and bears battling fiercely around the 20-day moving average. Is this rally over, or is this a buying-the-dip window?

First, the surface picture: bad news is piling on, but gold just won’t break below $4,000.

On November 6, nonfarm payrolls rose by 165,000, far above th
post-image
BTC-0.67%
ETH-1.26%
XAU+0.38%
5 Signals That, If Absent, Keep Me From Chasing a Soaring Stock

What’s the most awkward thing in the stock market? It’s not a stock failing to rise—it’s buying in, only for it to start going into free fall.
So when I’m bullish on a stock, I’d rather watch it for a few more days.
First, check whether earnings are improving consistently, rather than relying on one-off gains to make them look good.
Second, check whether trading volume is healthy. A sudden surge in volume without a sustained rise may be a reason to be cautious.
Third, check whether the valuation is reasonable. Don’t assume a stoc
NVDA+2.80%
  • 15
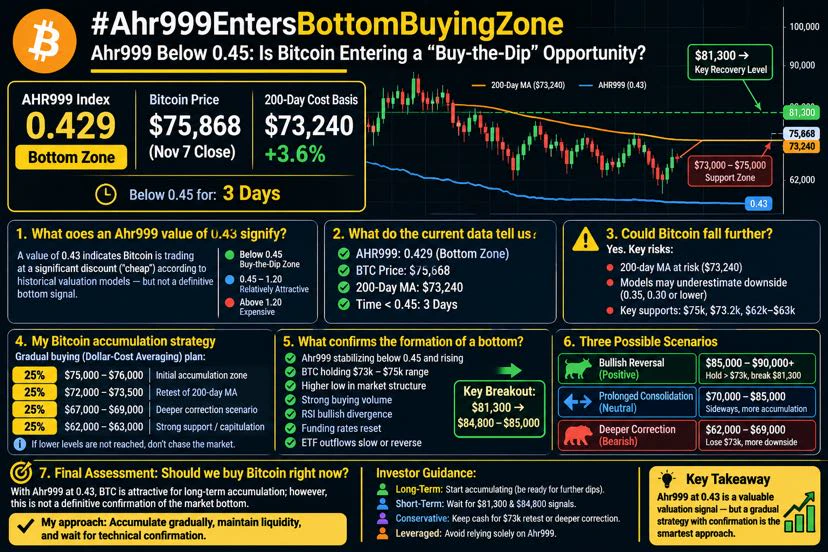
#Ahr999EntersBottomBuyingZone
Ahr999 Below 0.45: Is Bitcoin Entering a "Buy-the-Dip" Opportunity?

My assessment: An Ahr999 value of 0.43 serves as a meaningful valuation signal for long-term bullish expectations; however, it is not definitive proof that Bitcoin has reached its ultimate market bottom.

At the ~$76,000 price level, Bitcoin may be entering an attractive accumulation (buying) zone for long-term investors. Nevertheless, it is important to distinguish between the following three concepts:

* Bitcoin falling below its fair value (becoming "cheap").

* Bitcoin reaching a local marke
post-image
BTC-0.67%
  • 6
  • 1
$BTC ‌
Whales have placed a lot of buy orders for $BTC in the $70k-$75k

$BTC we're trading within the support zone

We've already tested it more than once, but now we're watching the reaction to it. Since it's the weekend, there's not much volatility.

‌PROFITS TO EVERYONE 💲💪💲🤝
BTC-0.67%
aster-2:native is holding well in the red market.
Breakout will send it to $10.
post-image
ASTER-0.07%
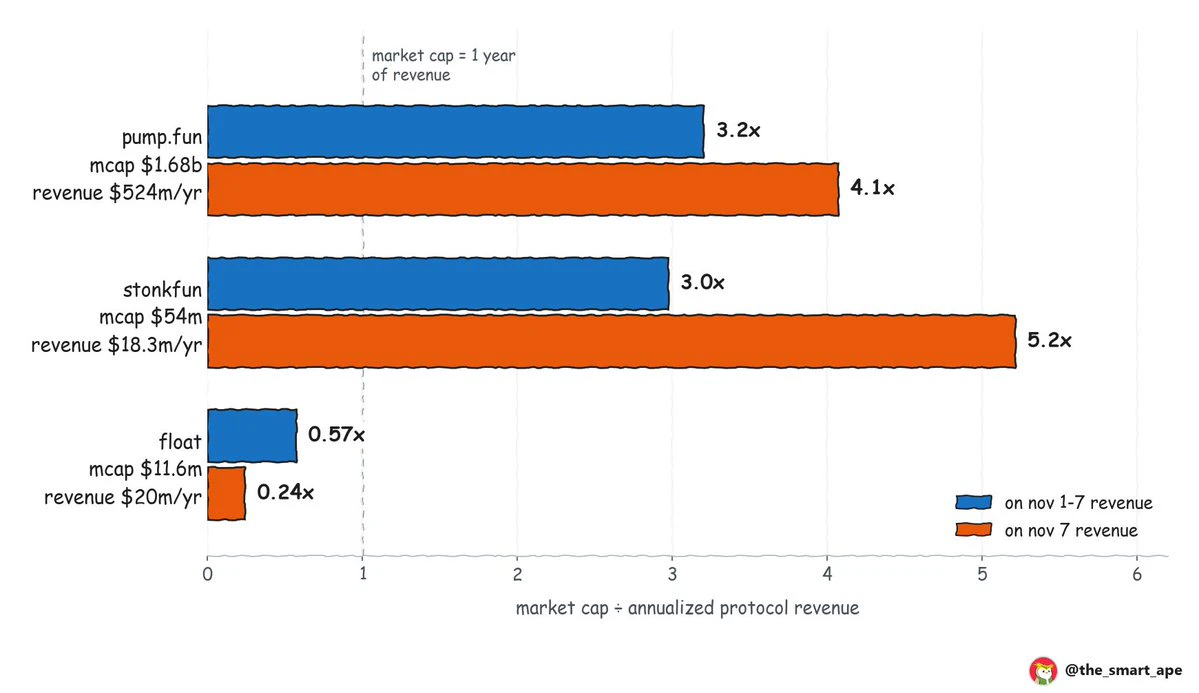
i've never seen growth this fast. @floatdotxyz launched 7 days ago and is already generating more revenue than STONK.
i took the protocol revenue of 3 launchpads for nov 1-7, annualized it, and divided each market cap by it:
> @Pumpfun: $524m/yr revenue, $1.68b mcap → 3.2x
> @LaunchOnSF: $18.3m/yr, $54m mcap → 3.0x
> @floatdotxyz: $20.2m/yr, $11.6m mcap → 0.57x
the case for float being cheap:
> it's 11 days old and already out-earned stonkfun this week ($388k vs $350k)
> 35% of its fees go to buying and burning $float. about 10% of the supply is already burned
> at this pace, the buybacks alon
post-image
STONK+11.55%
$SOL /USDT CHOPPY SCALP SHORT Low Conviction Range Trade

$SOL /USDT
Direction: SHORT

Entry: 89.2600

Stop Loss: 90.3127

Targets
TP1: 88.4705
TP2: 87.9442
TP3: 87.1547

SOL dropped sharply from the 96 high and has since flattened into a tight base around MA7 (89.16) and MA25 (89.50), with price essentially glued to both averages for over two days. MA99 (91.59) remains above, keeping the broader bias technically bearish.

$SOL ‌
SOL-0.74%
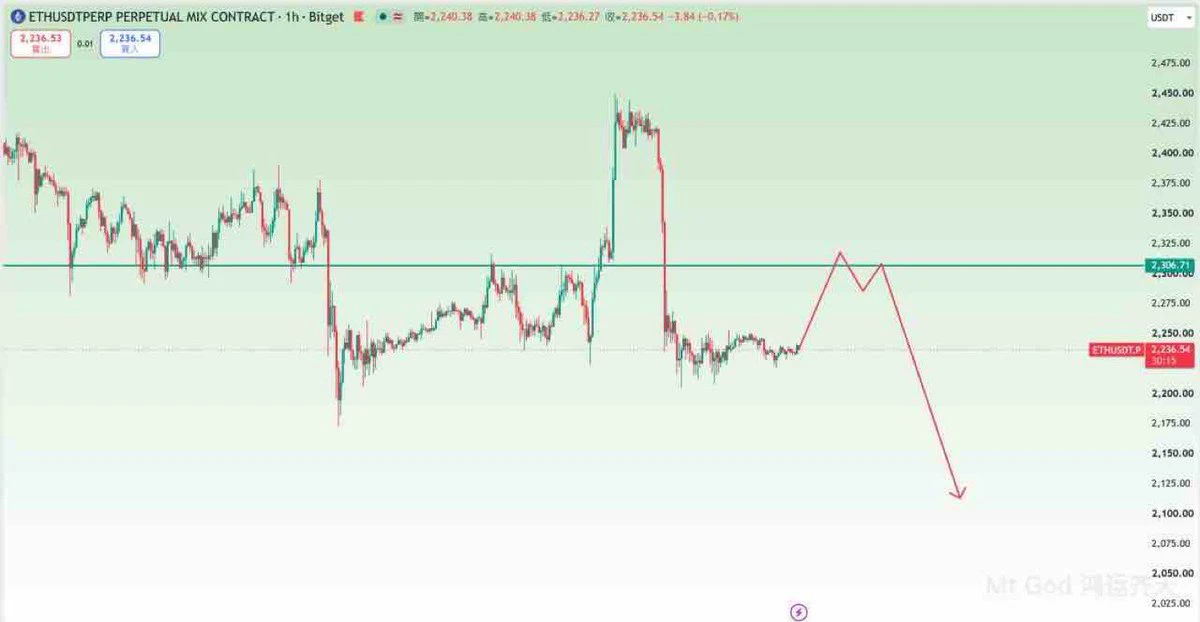
#ETH Watch for short opportunities if the price rebounds to this level.
post-image
ETH-1.23%
#Gate股票畅聊季 #美股财报季 Can AI trading emerge from the gloom next week?

U.S. tech stocks faced a sharp sell-off this week, as the AI investment boom came under a dual test from a changing policy environment and wavering confidence in capital markets.
Although chip stocks rebounded on Friday, the Nasdaq remains in correction territory, and doubts about returns on AI infrastructure investment, financing capacity, and future growth prospects have yet to dissipate.

Looking ahead to next week, the U.S. October Consumer Price Index (CPI), Producer Price Index (PPI), and earnings from companies including
CRWV+6.18%
AMAT+4.19%
CSCO-2.05%
ING-2.51%
  • 2
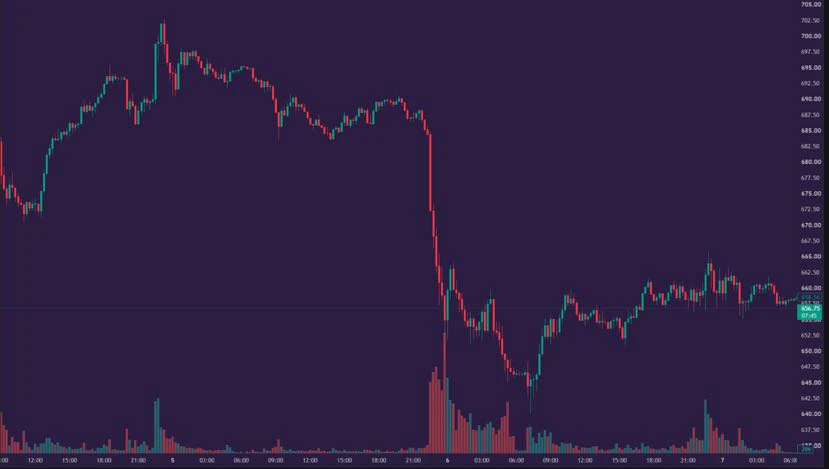
The most striking thing in U.S. stocks this week was probably Thursday’s plunge😇

$QQQ slid from near 700 at the start of the week to a low around 640, then closed near 658, down about 5.7% for the week

The Nasdaq 100 plunged about 6.4% in a single day on Thursday, and nearly the entire AI supply chain came under selling pressure!

The market had been discussing AI’s growth potential, but now investors are starting to ask another question:

When will massive capital spending translate into enough profits?

Uncertainty over data center regulation stemming from the midterm elections has furth
post-image
QQQ+0.01%
Load More

Join 40 M users in our growing community

⚡️ Join 40 M users in the crypto craze discussion

💬 Engage with your favorite top creators

👍 See what interests you

Trending Topics

USCPIDataIncoming

6.81k Views1.56k Discussing

The U.S. October CPI report will be released on November 10 at 8:30 a.m. ET. September CPI came in at 3.7% year over year, and markets will be watching closely for signs that inflation is cooling, especially in core CPI. A softer-than-expected reading could strengthen rate-cut expectations, while hotter inflation may pressure risk assets through higher Treasury yields and a stronger dollar. How do you think this CPI print will move $BTC, U.S. stocks and gold?

USAIStocksHitHard

26.34k Views3.72k Discussing

USNonfarmPayrolls

48.5k Views4.46k Discussing
View More