#USIranPeaceDealReachedStraitOfHormuzToOpen
Point One: Peace Agreement Terms and Diplomatic Background
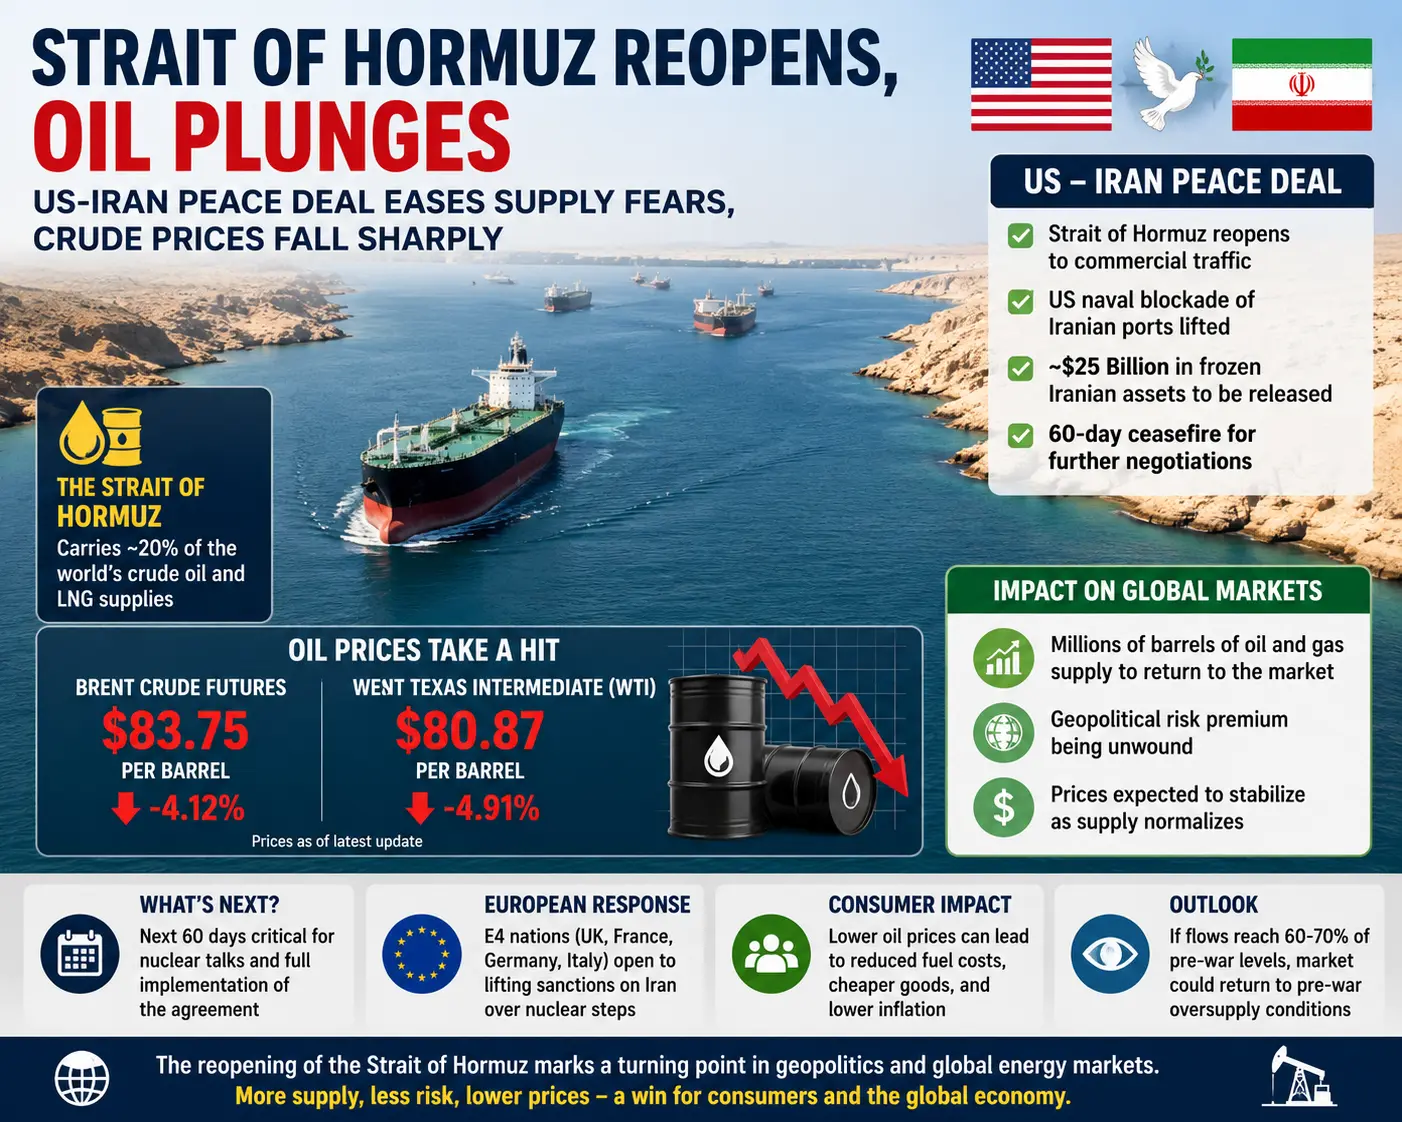
The announced peace agreement between the United States and Iran marks one of the most consequential geopolitical shifts of 2026. After months of escalating tensions, both sides have reportedly agreed on a framework aimed at ending conflict and restoring regional stability. The deal includes commitments from Iran not to pursue nuclear weapons in exchange for the release of approximately $25–35 billion in frozen assets by the United States. A 60-day ceasefire period is expected to allow technical negotiations on sanctions relief and verification mechanisms. Pakistan has been reported as playing a supporting mediating role during diplomatic communication channels.
Point Two: Strategic Importance of the Strait of Hormuz and Reopening Process
The Strait of Hormuz is one of the most critical maritime chokepoints in the global economy, handling around 20% of global oil trade and nearly 14 million barrels per day under normal conditions. During the conflict, flows reportedly dropped to nearly 7 million barrels per day, causing supply uncertainty and increasing global energy costs. Reopening the strait is expected to restore shipping confidence, reduce insurance premiums, stabilize freight costs, and gradually normalize global energy logistics. Full recovery may take weeks due to operational and security clearance requirements.
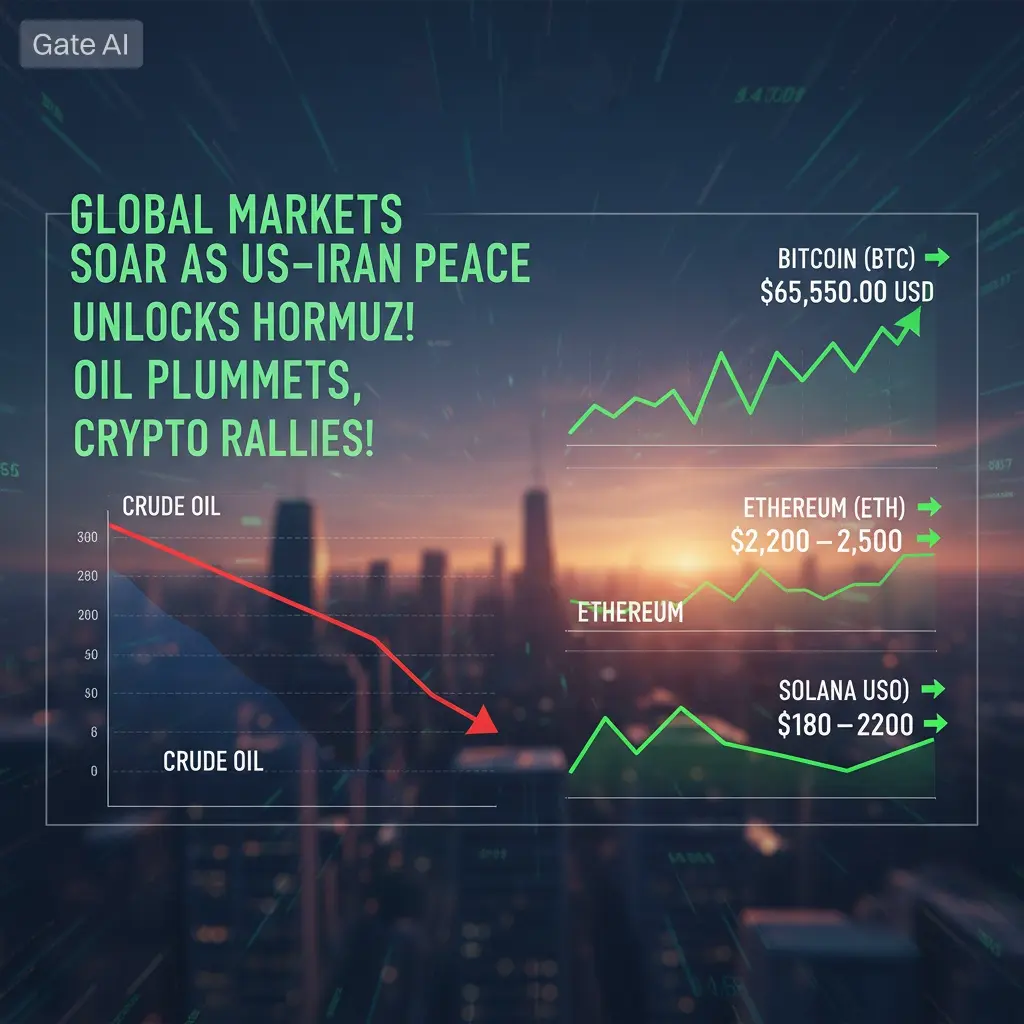
Point Three: Crude Oil Price Reaction and Supply Recovery Outlook
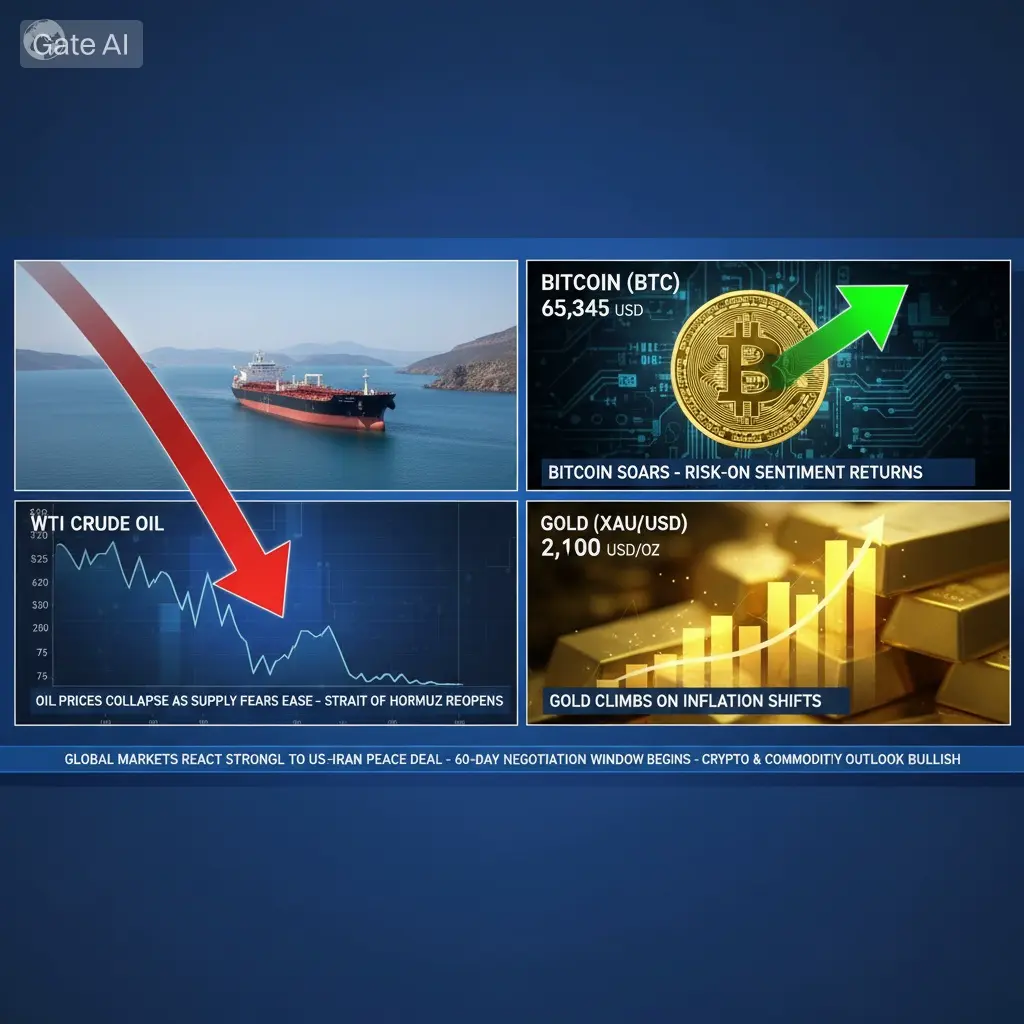
Oil markets reacted sharply to the peace announcement. Brent crude fell to around $83.82 per barrel while WTI dropped to approximately $80.95 per barrel, reflecting rapid removal of geopolitical risk premiums. Earlier during peak tensions, Brent briefly surged above $100 per barrel, highlighting how sensitive energy markets are to supply shocks. Analysts expect oil to stabilize in the $75–$85 range, while WTI may trade between $72–$82, depending on global demand trends and speed of supply normalization. A residual geopolitical premium of around $5–$10 per barrel may still persist due to long-term structural risk in the region.
Point Four: Gold Price Response and Safe-Haven Demand Dynamics
Gold has experienced significant volatility in 2026, previously reaching highs near $5,595 per ounce, before correcting toward approximately $4,300 per ounce. The easing of geopolitical tensions has reduced immediate safe-haven demand, leading to downward pressure on prices. However, gold remains structurally supported by central bank accumulation, long-term inflation hedging, and global reserve diversification trends. In the short term, reduced uncertainty may continue to cap upside momentum, but any renewed geopolitical instability or shift toward monetary easing could quickly reintroduce strong demand.
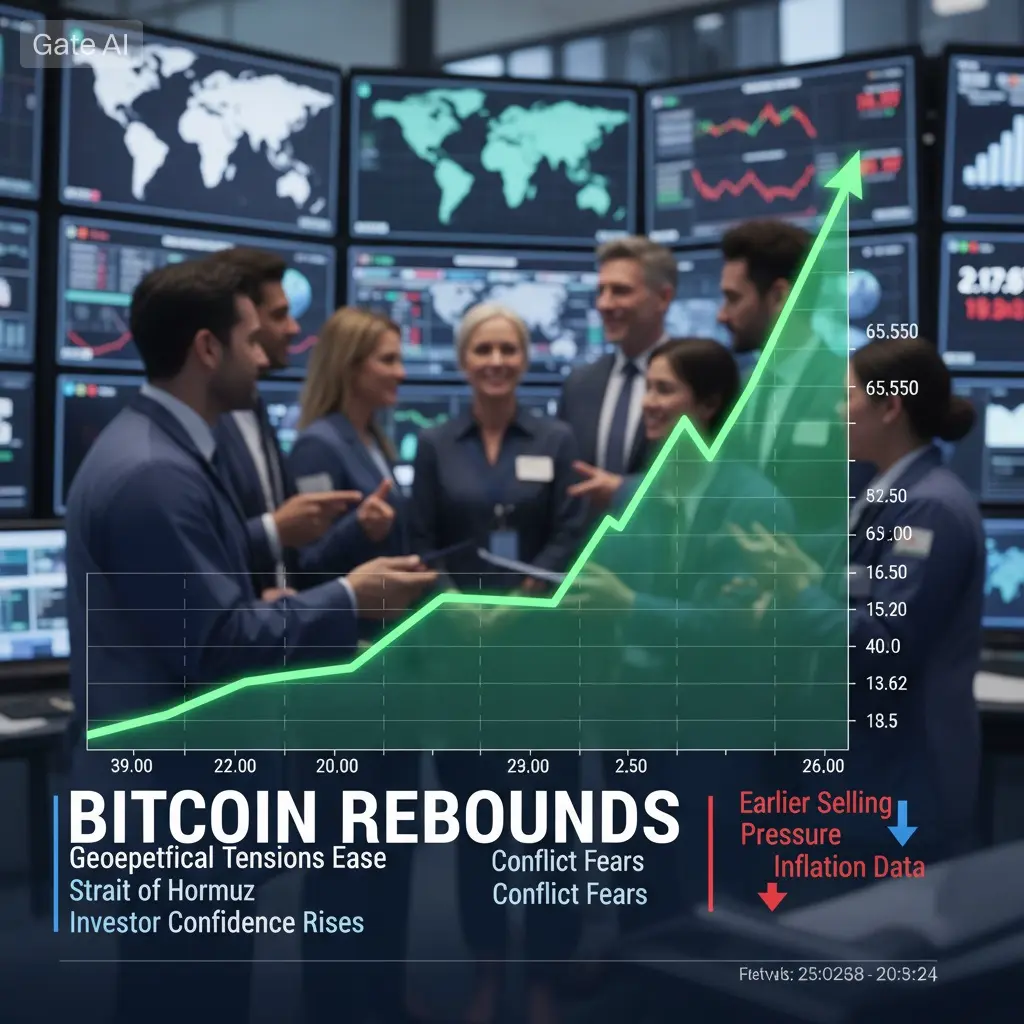
Point Five: Bitcoin and Crypto Market Reaction to De-escalation
Cryptocurrency markets have responded positively to improving macro sentiment. Bitcoin is trading around $65,650, while Ethereum is near $1,740, Solana around $75, XRP at $1.17, and Dogecoin at $0.088. The broader crypto market is benefiting from expectations of lower inflation, improved liquidity conditions, and reduced geopolitical risk. If macro stability continues, Bitcoin could gradually retest higher resistance zones, while altcoins may experience stronger percentage-based recoveries due to higher volatility and speculative inflows.
Point Six: Global Stock Markets and Risk Appetite Ripple Effects
Global equity markets have strengthened as investors rotate back into risk assets. Lower oil prices reduce input and transportation costs for corporations, improving margins across multiple sectors including aviation, logistics, manufacturing, and technology. Growth-oriented sectors are particularly sensitive to interest rate expectations, and easing inflation pressure may support higher valuations. Emerging markets may also benefit from reduced energy import costs and improved foreign capital inflows, strengthening overall global risk appetite.
Point Seven: Interconnected Macro Transmission Between Oil, Gold, and Crypto
Oil acts as the primary driver of global macro conditions, influencing inflation, monetary policy, and liquidity cycles. Rising oil prices tighten financial conditions and increase inflation expectations, often leading to higher interest rates that negatively impact both gold and cryptocurrencies. Conversely, falling oil prices ease inflation pressure and improve liquidity conditions, supporting risk assets. Gold functions as both an inflation hedge and geopolitical safe haven, while cryptocurrencies perform best in environments of abundant liquidity and strong investor confidence. This interconnected structure means that changes in oil prices directly influence nearly all major asset classes simultaneously.
Point Eight (Final): Comprehensive Market Assessment and Forward Outlook
The US-Iran peace agreement and reopening of the Strait of Hormuz represent a major turning point for global financial markets. Current price levels — Brent $83.82, WTI $80.95, gold $4,300, Bitcoin $65,650, Ethereum $1,740, Solana $75, XRP $1.17, and Dogecoin $0.088 — reflect a rapid repricing of geopolitical risk across all asset classes. If implementation proceeds smoothly, oil could gradually stabilize toward $75–$80, Bitcoin may retest $70,000+ levels, Ethereum could move toward $2,000–$2,500, Solana may recover above $100, XRP could aim toward $1.40–$1.60, and Dogecoin may attempt a return toward $0.10+. Global equities may continue to strengthen if inflation eases and monetary policy expectations turn more supportive.
My personal thoughts and detailed reflection: In my view, this development represents a rare macro reset where geopolitics directly shifts the entire structure of global financial pricing. What stands out most is how quickly markets have transitioned from fear-based pricing to expectation-based optimism, especially in oil and risk assets. I personally believe this is not just a short-term reaction but a deeper sentiment shift where liquidity, growth expectations, and investor psychology are all being rebalanced. However, I also feel that this optimism is still fragile. The agreement has not yet been fully tested in real-world implementation, and even small delays in shipping normalization or political disagreements could reintroduce volatility. From a broader perspective, I see this as a phase where markets are trying to “price peace,” but the final confirmation will only come once ground-level stability in the Strait of Hormuz is fully restored.@Gate_Square
Point One: Peace Agreement Terms and Diplomatic Background
The announced peace agreement between the United States and Iran marks one of the most consequential geopolitical shifts of 2026. After months of escalating tensions, both sides have reportedly agreed on a framework aimed at ending conflict and restoring regional stability. The deal includes commitments from Iran not to pursue nuclear weapons in exchange for the release of approximately $25–35 billion in frozen assets by the United States. A 60-day ceasefire period is expected to allow technical negotiations on sanctions relief and verification mechanisms. Pakistan has been reported as playing a supporting mediating role during diplomatic communication channels.
Point Two: Strategic Importance of the Strait of Hormuz and Reopening Process
The Strait of Hormuz is one of the most critical maritime chokepoints in the global economy, handling around 20% of global oil trade and nearly 14 million barrels per day under normal conditions. During the conflict, flows reportedly dropped to nearly 7 million barrels per day, causing supply uncertainty and increasing global energy costs. Reopening the strait is expected to restore shipping confidence, reduce insurance premiums, stabilize freight costs, and gradually normalize global energy logistics. Full recovery may take weeks due to operational and security clearance requirements.
Point Three: Crude Oil Price Reaction and Supply Recovery Outlook
Oil markets reacted sharply to the peace announcement. Brent crude fell to around $83.82 per barrel while WTI dropped to approximately $80.95 per barrel, reflecting rapid removal of geopolitical risk premiums. Earlier during peak tensions, Brent briefly surged above $100 per barrel, highlighting how sensitive energy markets are to supply shocks. Analysts expect oil to stabilize in the $75–$85 range, while WTI may trade between $72–$82, depending on global demand trends and speed of supply normalization. A residual geopolitical premium of around $5–$10 per barrel may still persist due to long-term structural risk in the region.
Point Four: Gold Price Response and Safe-Haven Demand Dynamics
Gold has experienced significant volatility in 2026, previously reaching highs near $5,595 per ounce, before correcting toward approximately $4,300 per ounce. The easing of geopolitical tensions has reduced immediate safe-haven demand, leading to downward pressure on prices. However, gold remains structurally supported by central bank accumulation, long-term inflation hedging, and global reserve diversification trends. In the short term, reduced uncertainty may continue to cap upside momentum, but any renewed geopolitical instability or shift toward monetary easing could quickly reintroduce strong demand.
Point Five: Bitcoin and Crypto Market Reaction to De-escalation
Cryptocurrency markets have responded positively to improving macro sentiment. Bitcoin is trading around $65,650, while Ethereum is near $1,740, Solana around $75, XRP at $1.17, and Dogecoin at $0.088. The broader crypto market is benefiting from expectations of lower inflation, improved liquidity conditions, and reduced geopolitical risk. If macro stability continues, Bitcoin could gradually retest higher resistance zones, while altcoins may experience stronger percentage-based recoveries due to higher volatility and speculative inflows.
Point Six: Global Stock Markets and Risk Appetite Ripple Effects
Global equity markets have strengthened as investors rotate back into risk assets. Lower oil prices reduce input and transportation costs for corporations, improving margins across multiple sectors including aviation, logistics, manufacturing, and technology. Growth-oriented sectors are particularly sensitive to interest rate expectations, and easing inflation pressure may support higher valuations. Emerging markets may also benefit from reduced energy import costs and improved foreign capital inflows, strengthening overall global risk appetite.
Point Seven: Interconnected Macro Transmission Between Oil, Gold, and Crypto
Oil acts as the primary driver of global macro conditions, influencing inflation, monetary policy, and liquidity cycles. Rising oil prices tighten financial conditions and increase inflation expectations, often leading to higher interest rates that negatively impact both gold and cryptocurrencies. Conversely, falling oil prices ease inflation pressure and improve liquidity conditions, supporting risk assets. Gold functions as both an inflation hedge and geopolitical safe haven, while cryptocurrencies perform best in environments of abundant liquidity and strong investor confidence. This interconnected structure means that changes in oil prices directly influence nearly all major asset classes simultaneously.
Point Eight (Final): Comprehensive Market Assessment and Forward Outlook
The US-Iran peace agreement and reopening of the Strait of Hormuz represent a major turning point for global financial markets. Current price levels — Brent $83.82, WTI $80.95, gold $4,300, Bitcoin $65,650, Ethereum $1,740, Solana $75, XRP $1.17, and Dogecoin $0.088 — reflect a rapid repricing of geopolitical risk across all asset classes. If implementation proceeds smoothly, oil could gradually stabilize toward $75–$80, Bitcoin may retest $70,000+ levels, Ethereum could move toward $2,000–$2,500, Solana may recover above $100, XRP could aim toward $1.40–$1.60, and Dogecoin may attempt a return toward $0.10+. Global equities may continue to strengthen if inflation eases and monetary policy expectations turn more supportive.
My personal thoughts and detailed reflection: In my view, this development represents a rare macro reset where geopolitics directly shifts the entire structure of global financial pricing. What stands out most is how quickly markets have transitioned from fear-based pricing to expectation-based optimism, especially in oil and risk assets. I personally believe this is not just a short-term reaction but a deeper sentiment shift where liquidity, growth expectations, and investor psychology are all being rebalanced. However, I also feel that this optimism is still fragile. The agreement has not yet been fully tested in real-world implementation, and even small delays in shipping normalization or political disagreements could reintroduce volatility. From a broader perspective, I see this as a phase where markets are trying to “price peace,” but the final confirmation will only come once ground-level stability in the Strait of Hormuz is fully restored.@Gate_Square