Square
Following
Hot
News
Profile
Share your thoughts
placeholder
Article
🔐 Blacklist, whitelist, transfer pause, and transaction limits: what's the difference?
They may affect token transfers, but they don't work the same way:
* Blacklist: Restricts specific addresses from participating in certain operations.
* Whitelist: Allows addresses that meet the rules to participate in specific operations.
* Pause mechanism: Temporarily halts some operations under specific conditions.
* Transaction limits: Restrict transaction amounts, frequency, or other conditions.
* Upgradeable contracts: Allow authorized parties to modify contract logic under specified conditions.
Findi
post-image
🔥 Gate Social Events Overview | Go live, create, interact—unlock multiple rewards!
🔔【Exclusive Rewards for Streamers】
New streamers can go live to earn GT; invite a streamer to join and get $20
https://www.gate.com/announcements/article/102538
Weekly Rising Star Streamer Contest: win exclusive merchandise
https://www.gate.com/announcements/article/102230
Live mining, newly upgraded: earn up to 40% in fee rebates
https://www.gate.com/announcements/article/102537
Returning streamers can go live to unlock $100 in rewards and traffic support
https://www.gate.com/announcements/article/102539
🔥【E
post-image
GT-2.41%
  • 6
  • 3
Trenches
ZIG
Z
bade
b
ZIG
0x8c...1145
Market Cap
$.
Change
.
24h Vol
$.
Holders
.
BTC
B
bade
b
BTC
C5xp...pump
Market Cap
$.
Change
.
24h Vol
$.
Holders
.
HIGH
H
bade
b
HIGH
7ymF...high
Market Cap
$.
Change
.
24h Vol
$.
Holders
.
STONK
S
bade
b
STONK
6GmA...UNgx
Market Cap
$.
Change
.
24h Vol
$.
Holders
.
LEEROY
L
bade
b
LEEROY
98HE...pump
Market Cap
$.
Change
.
24h Vol
$.
Holders
.
#SKHynixFallsNearly7% #SKHynix SK Hynix Falls Nearly 7%: Technical Breakdown of the Memory Leader
SK Hynix closed at 1,418,000 won on 30 October 2026, down 7.08% on the day, after losing the 1,500,000 won handle. The drop was sharp, but it was not random. It came after an extended rally, a wave of disappointing US tech earnings, and renewed doubts about whether heavy AI spending will earn a return. The chart tells the story of a stock that ran too far, too fast, and then reversed through a psychological level.
What happened on the day
The Bloomberg Asia Chip Stocks Index fell more than 4.5% at
  • 2
  • 1
Democrats Sweep Congress—Why Is Wall Street Turning Bullish?
Political Earthquake Sparks Market Rally
The results of the U.S. midterm elections stunned Washington but failed to shake Wall Street’s bullish sentiment. Democrats retook majorities in both the House and Senate and won the Texas governor’s race, marking the biggest political reversal in nearly a generation. Yet financial markets responded with aggressive buying.
On election night, Nasdaq 100 futures fell as much as 2.4%, but then quickly turned positive during the early New York session, rising 0.9% and rebounding about 929 points f
post-image
GS+3.61%
SPYX+0.01%
IREN-11.35%
HUT-23.00%
MSFT+6.76%
December Rate Hike Expectations Heat Up! If Nonfarm Payrolls Deliver a Strong Report, Does the Fed Still Have Reason to Wait?
The Fed’s biggest headache right now may not be an economy that’s too weak, but one that’s holding up too well! If the labor market continues to show resilience and consumer spending and wages remain strong, inflation could prove harder to bring down. That would naturally fuel discussion of a December rate hike. But rate hikes aren’t decided by a show of hands based on employment figures alone; the inflation outlook, financial conditions, and the economy’s ability to wi
GT-2.24%
  • 18
MORNING MARKET UPDATE
live-cover
LIVE1,335
11.5
BTC retested 75600 yesterday to induce shorts
Staged a “Big V Tianlong” reversal, shooting straight up to 81000
Took out both longs and shorts, catching shorts at 76000 and longs at 80000
What’s the outlook for BTC today?
On the 4-hour chart, it tested the previous high of 82000 but failed to break through. Still, it’s holding firmly above 80000, and the pullback hasn’t been very strong. Bulls have the upper hand, so the strategy remains to buy dips
Go long at 78300–78800
Targets: 82000/83000
I’ve been telling everyone to enter longs at 76500, and now the results are clear. The bullish ca
FyPaymentMadeEasy
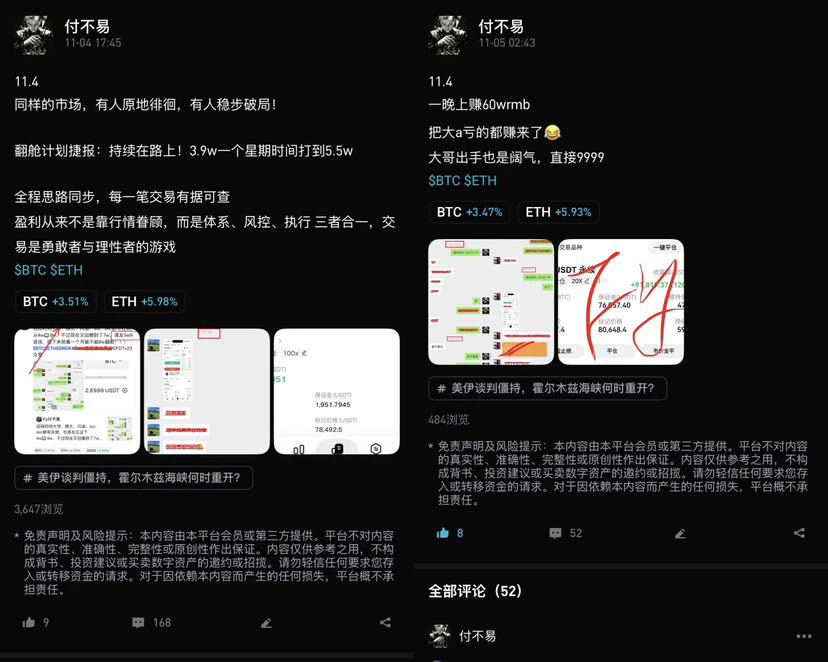
11.4
A brief summary of today
Everyone seems to have had pretty good luck
Shorted near 78,000 yesterday and rode it down to 76,000
Went long at 76,000 today and rode it up to 80,000
The market is gradually becoming clearer, and opportunities are increasing
Seize the opportunities, forget the past, and welcome tomorrow
$BTC $ETH #民主党赢得美国两院
repost-content-media
BTC-0.65%
ETH-1.23%
☀️ GM! Markets are switching channels. What are you watching? 📺
Nasdaq +1.4%, chip stocks lagging, and BTC back near $80K. 👀
📌 Today's topic: Which market has your attention?
₿ BTC: Can the rebound last?
💻 Tech: Why are chip stocks lagging?
📊 US Jobs: Position early or wait for Friday's data?
Different markets, different moves. What's your take?
🎁 Share your outlook on Gate Square. Post for a red packet, with bigger rewards dropping at random. Quality posts may also get featured.
👇 Share your take:
https://www.gate.com/post
Gate_Square
☀️ GM! Markets are switching channels. What are you watching? 📺
Nasdaq +1.4%, chip stocks lagging, and BTC back near $80K. 👀
📌 Today's topic: Which market has your attention?
₿ BTC: Can the rebound last?
💻 Tech: Why are chip stocks lagging?
📊 US Jobs: Position early or wait for Friday's data?
Different markets, different moves. What's your take?
🎁 Share your outlook on Gate Square. Post for a red packet, with bigger rewards dropping at random. Quality posts may also get featured.
👇 Share your take:
https://www.gate.com/post
repost-content-media
NDAQ+2.54%
BTC-0.67%
#BTC重返8万 #每周来晒 #广场交易达人 #WCTCS9 BTC Market Analysis
BTC is currently around $80,650, up 4.9% in 24 hours, and has indeed reclaimed the $80,000 level. But this rebound has mainly been driven by short liquidations, while spot inflows have yet to catch up, so near-term price action is more likely to be choppy.
Here are the main things to watch
ETF flows: There have been cumulative net outflows of about $1.157 billion over the past three trading days, so this source of buying has yet to return.
U.S. stocks and macro factors: Falling Treasury yields and a rebound in U.S. stocks have supported this r
ThisIsTranslateContent:
#BTC重返8万 #广场交易达人 #WCTCS9 BTC Price Analysis
BTC is currently around $80,650, up 4.9% in 24 hours, and has indeed climbed back above $80,000[1]. But this rebound is mainly driven by forced short covering, while spot market inflows have yet to catch up, so near-term trading is more likely to be choppy.
Key factors to watch
ETF flows: Net outflows totaled around $1.157 billion over the past three trading days, so this source of buying has yet to kick in.
U.S. stocks and macro: Falling Treasury yields and a rebound in U.S. stocks have supported this recovery; U.S. employment data on November 6 will affect rate expectations.
· Leveraged positions: When the price quickly rebounded from $75,700, concentrated short liquidations amplified the gains. This type of buying often lasts only until the positions are closed.
Several key price levels
$81,000–$82,000: Near-term resistance; a move up to this level could easily be followed by a pullback.
$80,000: The key support level now. A daily close below it could lead to another test of around $77,600.
$85,000–$87,500: The area with the heaviest concentration of underwater holders and sell orders, making a near-term breakout difficult.
Two possible scenarios
If BTC holds above $80,000, ETFs see consecutive inflows, and trading volume expands: upside opens up, with $90,000 as the next target.
If BTC falls back below $80,000: Previous downward pressure will return, and the price could retest $77,600.
For now, trading within a range looks more suitable. Wait for ETF inflows to return and for the daily close to hold above $80,000 before deciding whether a new uptrend has begun.
Whether this rebound can last mainly depends on whether new money enters the market. A price rise accompanied by inflows into ETFs and stablecoins would indicate a more sustainable move.
On-chain data: See who holds the coins
Exchange balances: A decline means coins are being withdrawn and held, easing selling pressure; a rise suggests people are preparing to sell.
SOPR: Above 1 means most sellers are making a profit; below 1 means people are selling at a loss.
Long-term holder activity: Little movement in older coins suggests large holders are not selling.
Realized market cap: If it rises along with the price, that suggests new money is entering; if only the price rises, existing funds are probably just changing hands.
Market indicators: See whether money is flowing in
ETF net flows: Consecutive days of net inflows would show institutional buying has returned.
Total stablecoin market cap: A rise means money on the sidelines is still waiting to enter.
Trading volume: A rally on rising volume is much more solid than one on declining volume.
Funding rates: A return to neutral means leveraged chasing has cooled, making the market healthier.
Watch for these signals
Bullish: Consecutive ETF inflows, growth in the total stablecoin supply, and closes holding above $80,000.
Bearish: A fall below $80,000, a return to net ETF outflows, and a marked increase in exchange balances.
ETF outflows have yet to show a consistent slowdown, and the total stablecoin supply has not reached a new high, so this looks more like a short-term rebound; a trend reversal still needs confirmation from fund flows.$BTC
repost-content-media
BTC-0.67%
  • 4
Thrusday Trades with Crypto Sat
live-cover
LIVE1,126
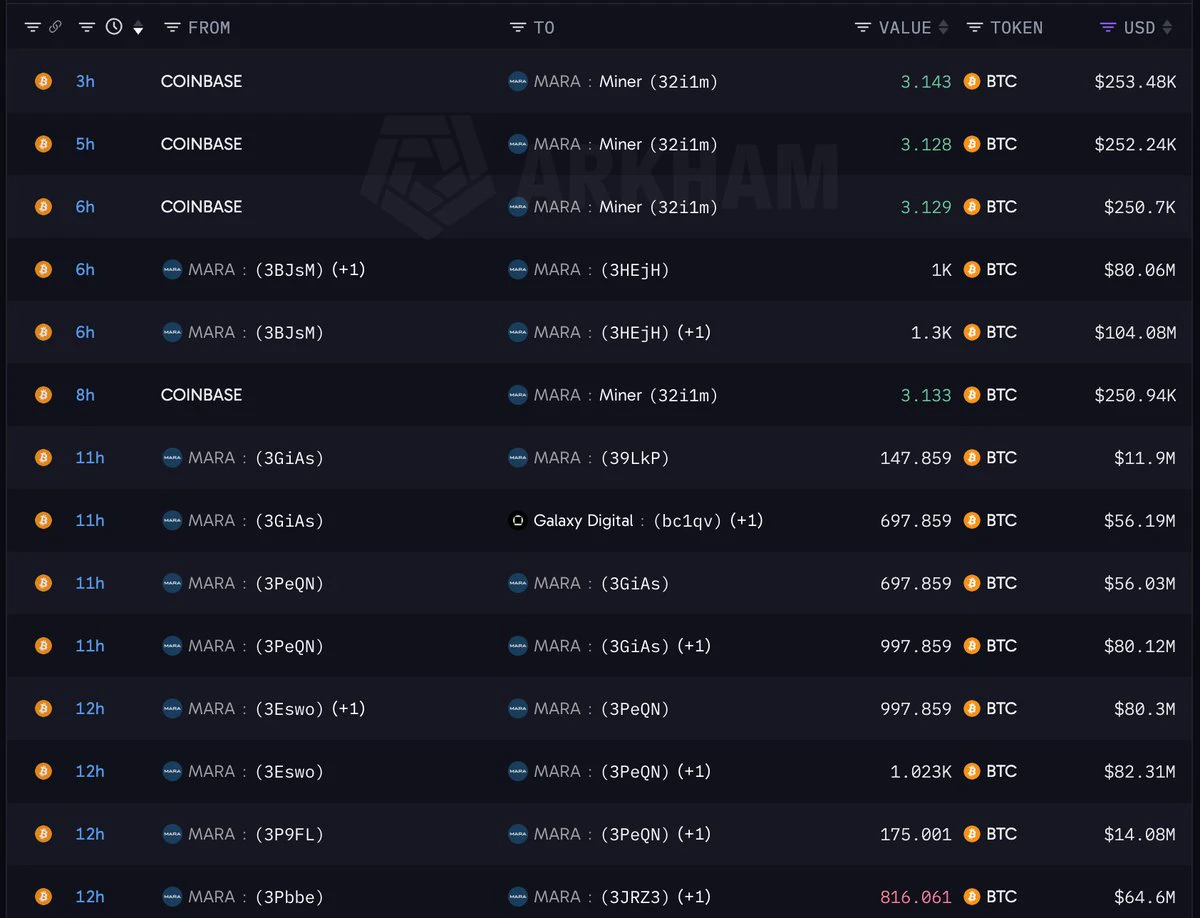
Bitcoin miner MARA Holdings (@MARA) appears to be dumping $BTC again.
Over the past 12 hours, #MARA transferred 1,650 $BTC ($132.8M) to Galaxy Digital, Copper, and other platforms.
post-image
BTC-0.67%
MARA-4.24%
GLXY-16.94%
$XAUUSD Yesterday, I opened large-account long positions on MT5, and the market is currently moving entirely as expected. Chasing longs now carries risks, so wait for a pullback to key levels before considering adding to the position
XAUUSD+1.90%
🔐 Before using digital assets, complete this security checklist.
✅ Verify the project and contract address
✅ Check the contract rules and restriction mechanisms
✅ Confirm who controls the key permissions
✅ Verify transaction results through on-chain records
✅ Understand the asset’s actual use and liquidity risks
✅ Handle wallet approvals and signing requests with caution
Remember: A successful transaction does not mean there is no risk, and a public contract is not necessarily absolutely safe.
A truly reliable habit is to verify before taking action, understand before granting approval, and a
post-image
not bad first future short!
post-image
NOT-1.11%
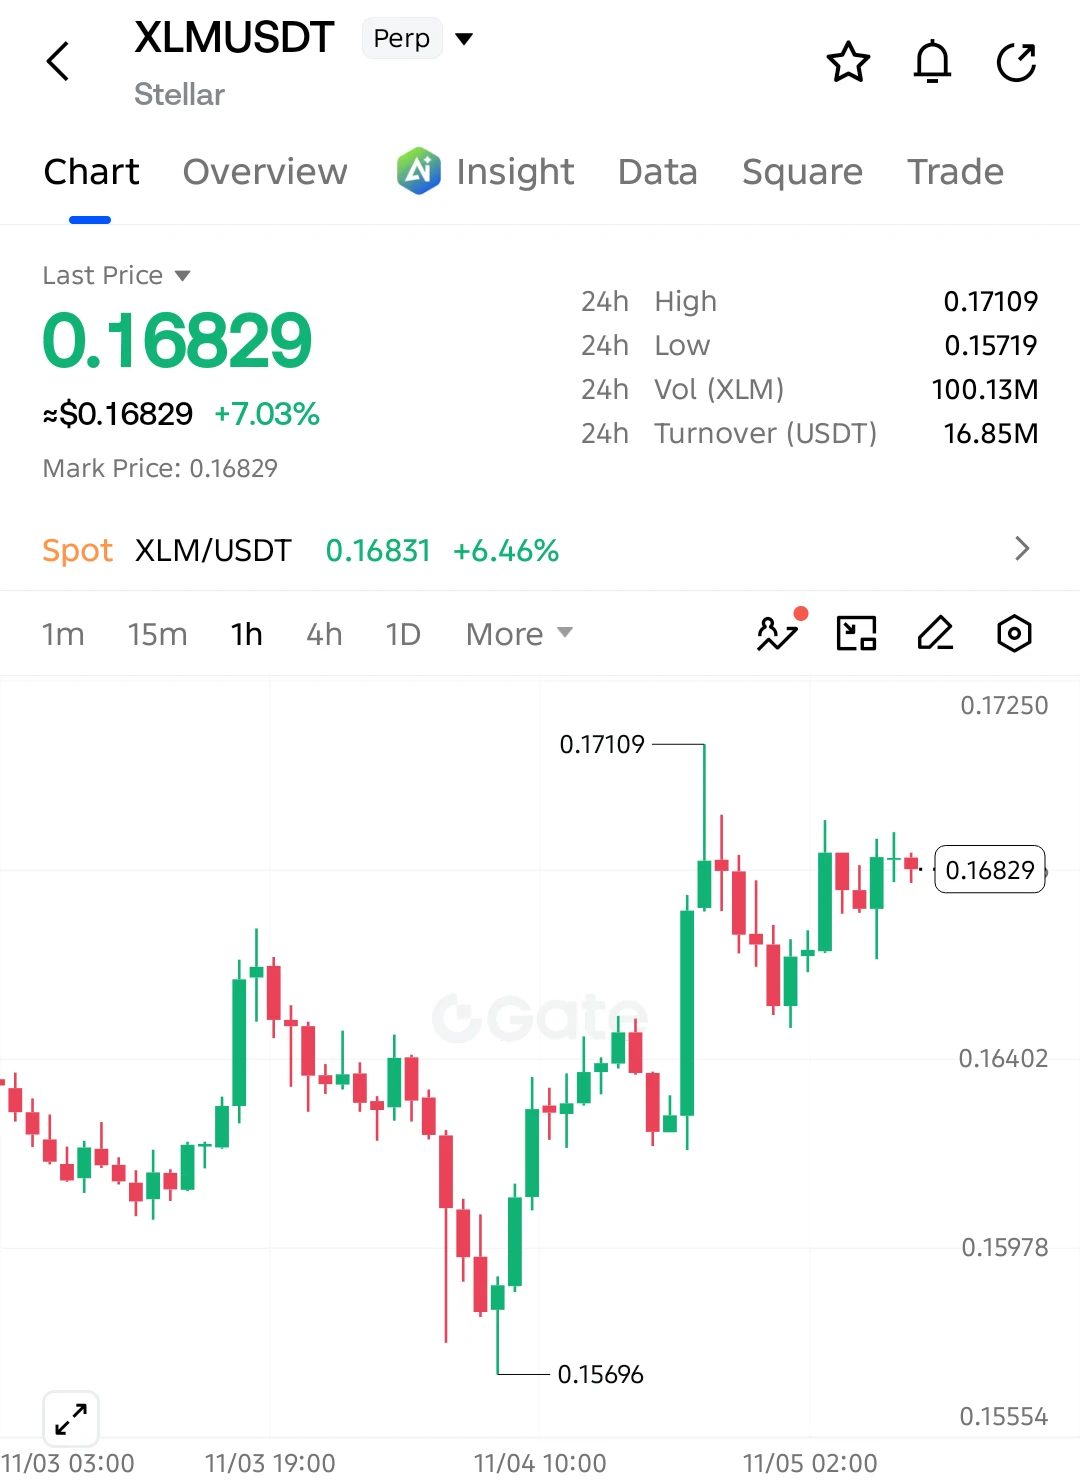
$XLM BULLS ARE TAKING CONTROL! 🚀
$XLM is up 7.03%, and buyers are holding strong near 0.168 after a powerful recovery. Another breakout could be approaching!
LONG SETUP
Entry: 0.16829
SL: 0.16520
TP1: 0.17000
TP2: 0.17109
TP3: 0.17450
Final Target: 0.17800
XLM has recovered strongly from 0.15696 and is now consolidating just below resistance. Holding above 0.1660 keeps the bullish structure intact, while a breakout above 0.17109 could open the door for another rally.
Invalidation: A sustained break below 0.16520 weakens the bullish setup.
post-image
XLM-0.64%
  • 8
  • 1
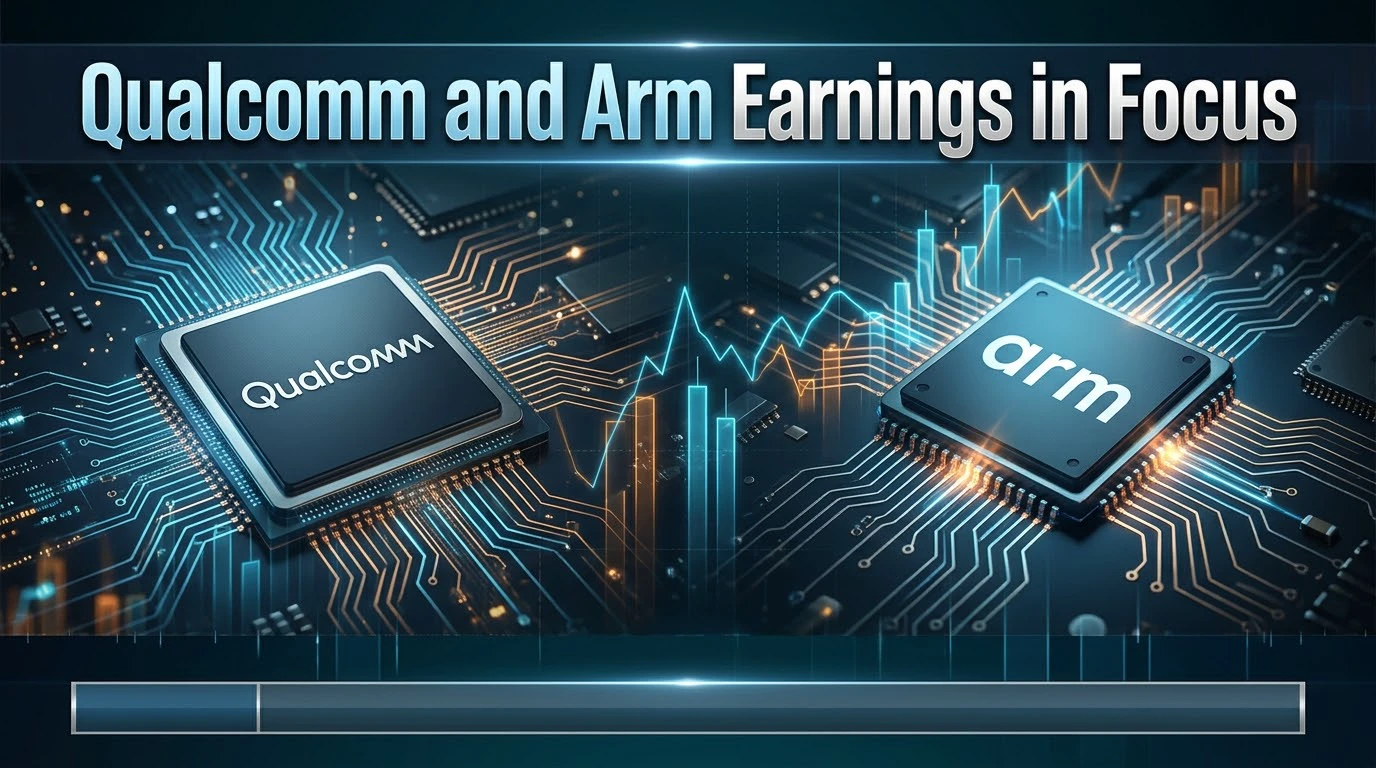
#QualcommAndArmEarningsInFocus #ShareWeekly
Qualcomm and Arm Earnings in Focus: Is the AI Chip Revolution Entering a New Phase?
The semiconductor industry continues to attract global investor attention as Qualcomm and Arm Holdings become important companies to watch during the latest earnings season. Both businesses occupy strategic positions in the technology ecosystem, particularly in mobile processors, artificial intelligence, connected devices, and next-generation computing.
As AI adoption accelerates worldwide, investors are increasingly looking beyond traditional smartphone demand. The
post-image
QCOM+5.60%
ARM-5.13%
You wouldn’t buy the dip in gold, let alone BTC. You didn’t buy at 57,000 or 60,000, and even just a few days ago, when BTC was at 76,000, you still didn’t dare buy the dip. Now you’ve missed the boat again, huh!
post-image
GLDX-0.40%
PAXG+0.37%
BTC-0.67%
☀️ GM! Markets are switching channels. What are you watching? 📺
Nasdaq +1.4%, chip stocks lagging, and BTC back near $80K. 👀
📌 Today's topic: Which market has your attention?
₿ BTC: Can the rebound last?
💻 Tech: Why are chip stocks lagging?
📊 US Jobs: Position early or wait for Friday's data?
Different markets, different moves. What's your take?
🎁 Share your outlook on Gate Square. Post for a red packet, with bigger rewards dropping at random. Quality posts may also get featured.
👇 Share your take:
https://www.gate.com/post
post-image
NDAQ+2.54%
BTC-0.67%
  • 6
  • 3
Load More

Join 40 M users in our growing community

⚡️ Join 40 M users in the crypto craze discussion

💬 Engage with your favorite top creators

👍 See what interests you

Trending Topics

BTCBackAbove80K

16.93k Views41.11k Discussing

After a sharp dip, Bitcoin climbed back above $80,000 on May 9 and is currently trading around $80,200. Over 50,000 traders were liquidated in the past 24 hours amid fierce long-short battles. The recurring Iran-U.S. tensions remain the primary short-term variable. Following U.S. airstrikes, Iran\'s Revolutionary Guard claimed to have breached the Strait of Hormuz defense line, leaving the ceasefire outlook uncertain. On the technical side, the daily SMA20 ,$77,970 serves as key support, with the RSI recovering from oversold levels to 43. The $80,000 level is both a psychological barrier and a bull-bear dividing line.Holding above it could lead to a challenge at $85,000, while a break may trigger a retest of the $77,000 area.

DemocratsWinBothChambers

15.81k Views417 Discussing

GateLaunchesTaiwanStockTrading

13.86k Views277 Discussing

View More