#CTR
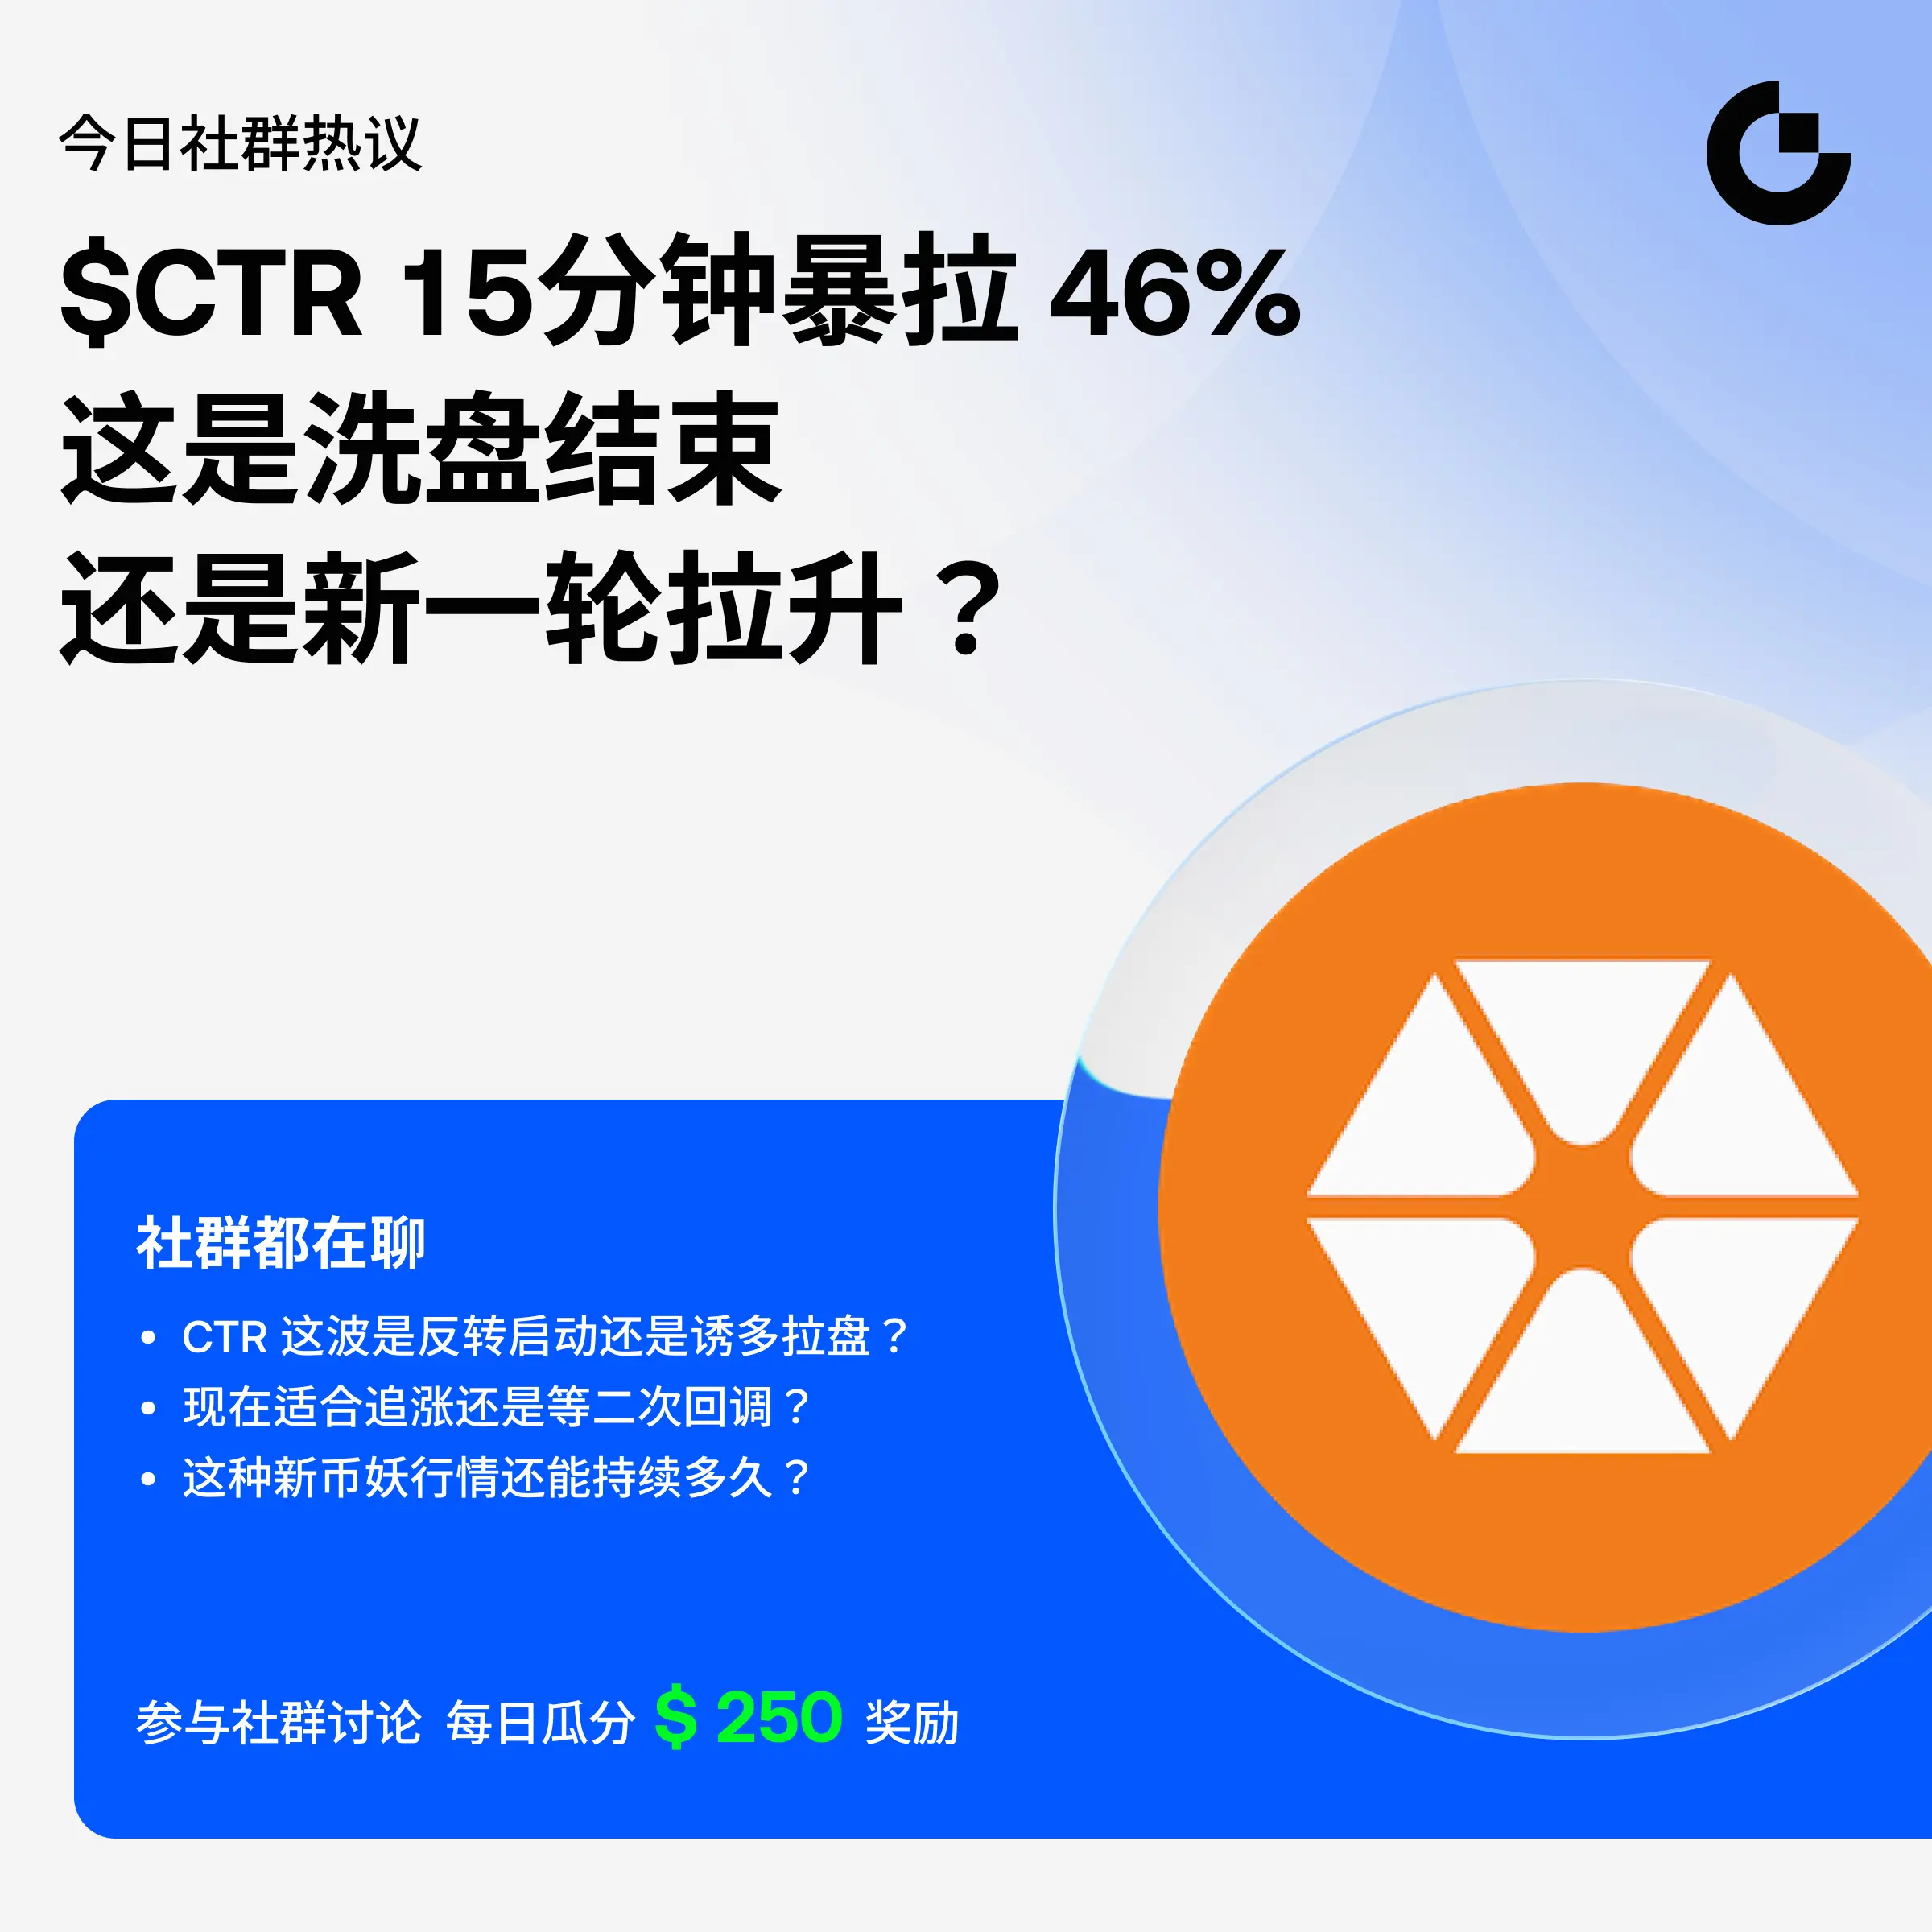
CTR is currently trading near the $0.017 zone after one of the most volatile launch phases seen in recent weeks. The token experienced massive early speculation, rapid exchange exposure, extreme intraday swings, and heavy momentum-driven trading immediately after launch.
The market is now trying to determine whether CTR is entering a stabilization phase or simply experiencing temporary relief rallies inside a broader correction structure.
Complete Price Structure
Launch & Early Trading
Initial launch trading started near $0.040
Early aggressive buying pushed valuation rapidly higher
Major early trading peak formed around $0.027 – $0.028
Initial rejection triggered immediate heavy sell pressure
Major Selloff Phase
Price collapsed from above $0.028
Sharp downside continuation pushed CTR toward $0.020
Weak support failed multiple times during volatility expansion
Panic selling accelerated toward the $0.015 region
Capitulation wick reached approximately $0.013
Recovery Bounce
Buyers defended the lower $0.013 area aggressively
Price rebounded rapidly toward $0.016
Momentum continuation pushed CTR above $0.018
Short squeeze conditions accelerated volatility
Recovery spike briefly reclaimed the $0.020 – $0.022 zone
Current Trading Area
Current market region: around $0.017
Nearby resistance: $0.0185 – $0.020
Major resistance zone: $0.022 – $0.025
Important psychological level: $0.030
Lower support region: $0.015
Stronger downside support: $0.013
Breakdown danger zone: below $0.012
Volatility Analysis
CTR is currently behaving like a hyper-volatile newly launched speculative asset
.
Intraday swings already reached:
15% downside movements
20% recovery waves
30% liquidation candles
46% short-term recovery spikes
This level of volatility shows that the market is still in raw price-discovery mode rather than healthy trend formation.
The move from approximately $0.013 toward above $0.020 happened extremely fast, which usually indicates:
leveraged participation,
aggressive short covering,
momentum algorithms,
and speculative liquidity rotation.
These rallies can continue briefly, but they also reverse extremely fast when buying pressure weakens.
Important Price Scenarios
Bullish Scenario
If buyers successfully maintain the $0.016 – $0.017 region, CTR could attempt another recovery wave toward:
$0.0185
$0.020
$0.022
$0.025
If momentum becomes extremely strong again, temporary spikes toward $0.028 or even $0.030 are possible during volatility expansion phases.
However, these moves would still require sustained buying pressure and improved market confidence.
Neutral Scenario
The most realistic short-term structure may be sideways volatility between:
$0.015 support
and $0.020 resistance
This type of range usually develops after extreme launch volatility when both buyers and sellers temporarily slow down.
During this phase:
volatility compresses,
liquidity stabilizes,
and traders wait for the next catalyst.
Bearish Scenario
If selling pressure resumes and support weakens:
$0.015 could fail,
price may revisit $0.013,
and liquidity sweeps below previous lows become possible.
If broader market sentiment weakens simultaneously, deeper downside volatility cannot be ignored.
Potential downside zones in a bearish continuation structure include:
$0.013
$0.012
$0.010
sub-$0.01 psychological area
Holder Concentration Risk
The biggest risk surrounding CTR remains supply concentration.
A very large percentage of total supply is controlled by a relatively small number of wallets. This creates unstable market dynamics because concentrated holders can influence short-term direction significantly.
Why this matters:
rallies can become distribution opportunities,
volatility increases sharply,
liquidity conditions change rapidly,
and retail traders become vulnerable during emotional moves.
Even strong narratives struggle when token ownership remains heavily concentrated during early launch stages.
This is currently the single most important risk factor in the entire CTR structure.
Market Psychology
CTR is now entering the emotional phase that usually follows major launch volatility.
Different groups currently exist in the market:
Aggressive Bulls
These traders believe:
current levels are discounted,
volatility creates opportunity,
and future ecosystem growth may justify higher valuation later.
Momentum Traders
These participants only focus on:
short-term price movement,
leverage opportunities,
and rapid intraday volatility.
Cautious Investors
This group remains concerned about:
concentrated ownership,
unstable price structure,
and lack of long-term market stabilization.
This psychological conflict is why CTR continues producing large and unpredictable price swings.
Technical Structure
From a broader technical perspective, CTR still remains below important launch valuation regions.
Important structure observations:
Lower highs formed after launch
Volatility remains elevated
Price still trades below early distribution zones
Recovery rallies remain unstable
Market structure is not fully confirmed bullish yet
For a healthier long-term structure to develop, the market would usually need:
Stabilized trading ranges
Reduced panic volatility
Improved holder distribution
Organic ecosystem growth
Consistent support defense
At the moment, these conditions are still developing.
Trading Environment
CTR currently favors experienced volatility traders rather than conservative long-term investors.
Important conditions traders should understand:
sudden 20–30% swings remain possible,
liquidation spikes can appear quickly,
emotional entries become dangerous,
and momentum reversals happen extremely fast.
Large position sizes inside unstable launch structures carry substantial risk because price discovery is still incomplete.
Smaller exposure and strict risk management remain the safer approach during these early market conditions.
Longer-Term Perspective
The broader ecosystem concept behind CTR remains fundamentally interesting.
Bitcoin-focused scalability infrastructure continues attracting industry attention because the market increasingly wants:
faster execution,
scalable smart contracts,
lower transaction friction,
and expanded Bitcoin ecosystem utility.
If the ecosystem eventually develops:
real network activity,
developer growth,
sustained liquidity,
and healthier distribution,
then long-term confidence could improve substantially.
However, long-term ecosystem potential does not automatically guarantee short-term token stability.
That distinction is extremely important for market participants right now.
Final Market Assessment
CTR is currently operating inside a highly speculative launch environment dominated by volatility, momentum trading, and emotional participation.
The recovery from approximately $0.013 back toward the $0.020 region created strong excitement, but the broader structure still remains unstable. The project narrative itself has value, yet the token market is still primarily driven by short-term speculation rather than fully established organic demand.
Most important price levels now:
Immediate support: $0.015
Strong support: $0.013
Current trading zone: $0.017
Key resistance: $0.020
Higher resistance: $0.022 – $0.025
Psychological breakout level: $0.030
As long as volatility remains elevated and supply concentration stays heavy, every rally carries the possibility of rapid reversal. The market still needs time for healthier distribution, stronger liquidity stability, and more mature price discovery before long-term confidence can fully develop.@Gate_Square @Gate广场_Official