Square
Following
Hot
News
Notifications
Profile
Share your thoughts
placeholder
Article
I will always support all of General Secretary Xi’s decisions! I will always love our great motherland!
#USCPIDataIncoming
Mark your calendars. The next major U.S. inflation print drops in less 48 hours
This is the last CPI before the December FOMC meeting, and markets are already positioning. After two consecutive hotter-than-comfortable prints, the consensus is looking for a cooldown. But “cooling” is relative when the year-over-year rate is still sitting well above the Fed’s 2% target.

Quick Recap of the September Print (Released Oct 14)
- Headline CPI: **+0.6% month-over-month**, **+3.7% year-over-year**
- Core CPI (ex-food & energy): **+0.3% m/m**, **+2.6% y/y**
- Gasoline alone jumped *
XAU+0.38%
BTC-0.67%
Trenches
ZIG
Z
bade
b
ZIG
0x8c...1145
Market Cap
$.
Change
.
24h Vol
$.
Holders
.
STONK
S
bade
b
STONK
6GmA...UNgx
Market Cap
$.
Change
.
24h Vol
$.
Holders
.
IDOL
I
bade
b
IDOL
0x3b...ab07
Market Cap
$.
Change
.
24h Vol
$.
Holders
.
CLAUDIA
C
bade
b
CLAUDIA
2j5S...W2ZM
Market Cap
$.
Change
.
24h Vol
$.
Holders
.
BTC
B
bade
b
BTC
C5xp...pump
Market Cap
$.
Change
.
24h Vol
$.
Holders
.
Support and resistance levels are among the most fundamental and practical concepts in technical analysis. Many traders study candlesticks and indicators every day, yet overlook an important question: at which price levels are buying and selling pressure likely to shift?
First, a support level is an area where buying pressure may increase as the price falls. When the price approaches this level, some buyers may start entering the market, slowing the decline. But a support level does not mean the price definitely won’t break below it.
Next, a resistance level is an area where selling pressure m
BTC-0.67%
$PI On the daily chart, every decline in Pi coin comes with high volume, while every rise comes with low volume. High volume means heavy trading, so a high-volume decline means selling pressure exceeds buying pressure, causing the price to fall. Low volume means trading is subdued, with few people buying and few selling. But on the daily chart, even when the price rises, each candlestick is a very small bullish candle, indicating that buying volume is low. For a sustained uptrend, volume must increase on rises and decrease on declines.
post-image
PI-0.60%
  • 1
A Bitcoin warning sign has emerged! The U.S. premium index has been negative for 44 consecutive days—who is still secretly buying?

A signal worth watching has emerged in the Bitcoin market: the premium index has remained in negative territory for 44 consecutive days.
What exactly does this indicator mean?
Simply put, it compares Bitcoin prices with those on other trading platforms. If the price is relatively lower, it may indicate comparatively weak buying demand in the U.S. market.
Why is the market paying so much attention to it?
Because it has significant influence among U.S. institutions
MU+4.71%
  • 7
🌈 #GateLiveStreamingInspiration -November 8

Go live with the following topics now to receive extra official support and promotional exposure!Today's Topic Recommendations:
🔹 Vitalik Buterin says the donation of SHIB worth hundreds of millions of dollars exceeded expectations
🔹 Bitcoin needs no banks, yet Strategy aims to become a Bitcoin bank
🔹 Former FBI agent pleads guilty to stealing $2.47 million in cryptocurrency, facing up to 20 years in prison
🔹 Cyber has repurchased approximately $13 million worth of CYBER tokens over the past year
🔹 Bitcoin ETFs saw a net outflow of $412 millio
GateLive
🌈 #GateLiveStreamingInspiration -November 8

Go live with the following topics now to receive extra official support and promotional exposure!Today's Topic Recommendations:
🔹 Vitalik Buterin says the donation of SHIB worth hundreds of millions of dollars exceeded expectations
🔹 Bitcoin needs no banks, yet Strategy aims to become a Bitcoin bank
🔹 Former FBI agent pleads guilty to stealing $2.47 million in cryptocurrency, facing up to 20 years in prison
🔹 Cyber has repurchased approximately $13 million worth of CYBER tokens over the past year
🔹 Bitcoin ETFs saw a net outflow of $412 million, with BlackRock’s IBIT posting a net outflow of $403 million
🔹 Prediction markets assign a 52% probability that Bitcoin will rise to $70,000 by the end of 2026
🔹 Gnosis Pay reports unauthorized access to its card system, resulting in customer data leakage
🔹 The SEC’s proposed rules for crypto broker-dealers have been submitted to the White House for review, covering four securities rules
Choose any topic to start a live stream, and you'll have a chance to be featured on the official website's homepage!
🔥 Start streaming now: https://www.gate.com/live/apply

repost-content-media
SHIB-1.28%
BTC-0.67%
CYBER-5.40%
IBIT-0.30%
GNO-1.28%
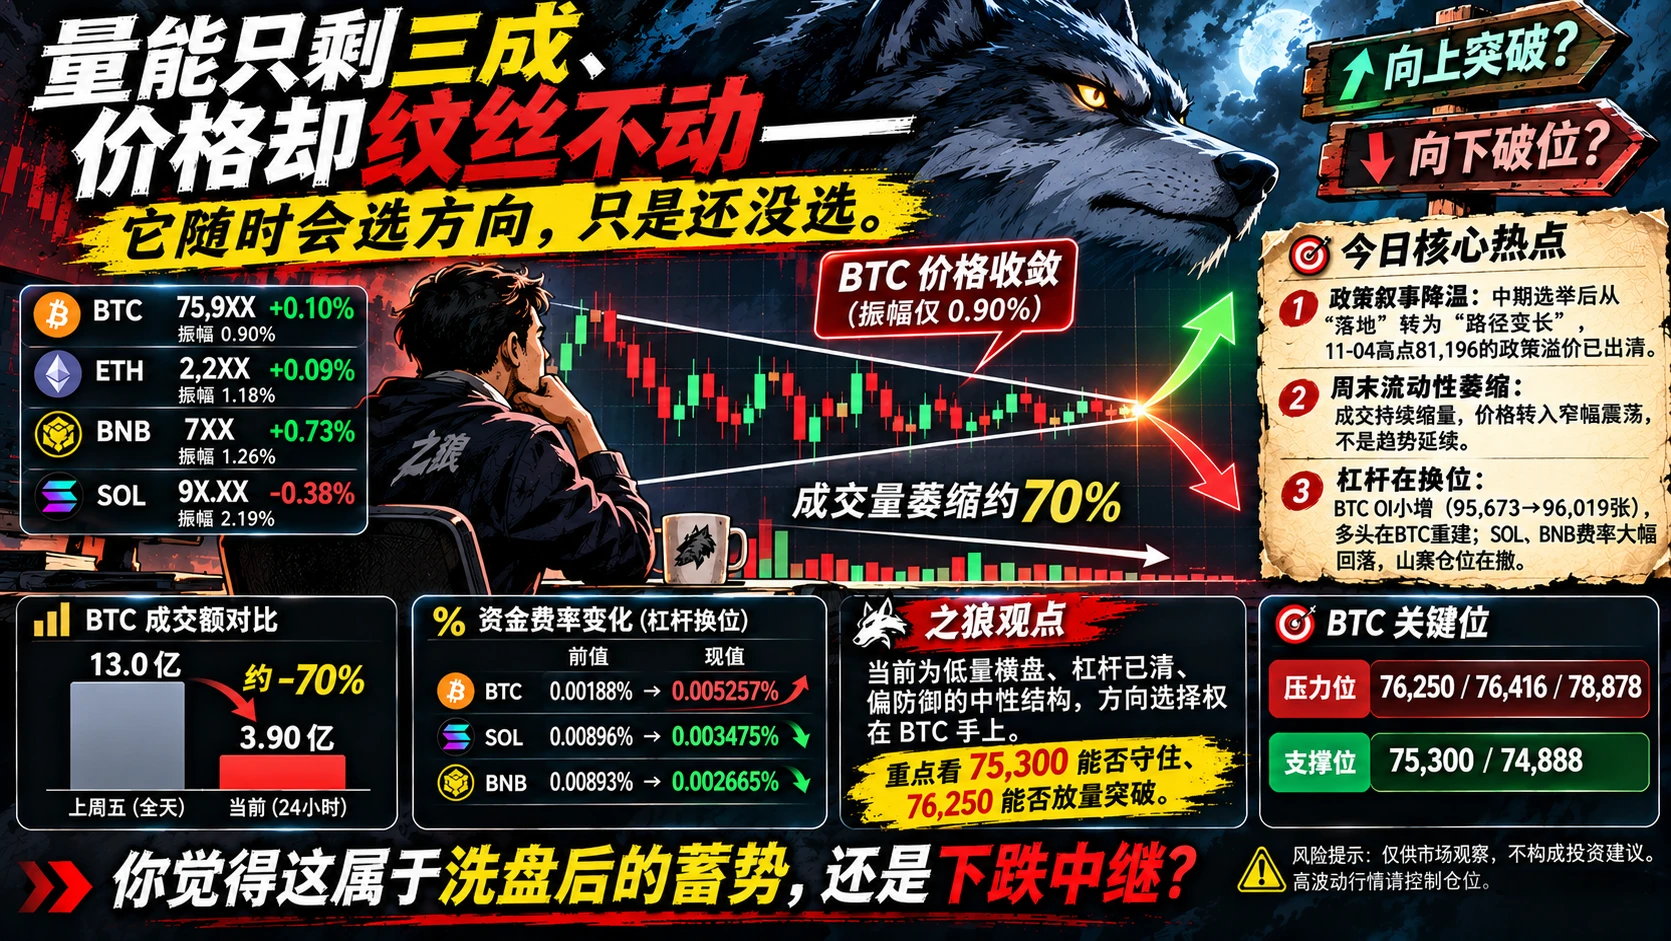
#BTCETF资金持续流出 What’s truly unsettling isn’t the decline, but this sideways action where “volume is down to 30%, yet the price hasn’t budged”—it could choose a direction at any moment; it just hasn’t yet.
Market:
All four coins are trading in a tight 1%–2.2% intraday range, with BTC at just 0.90%—a classic low-volatility compression. Volume is more concerning than price: BTC’s 24-hour trading volume is 390 million, compared with 1.3 billion for all of last Friday, a roughly 70% contraction, with even the pullback lacking volume. The market is clearly diverging: BNB is leading gains and closed a
post-image
BTC-0.65%
BNB-0.72%
SOL-0.74%
ETH-1.26%
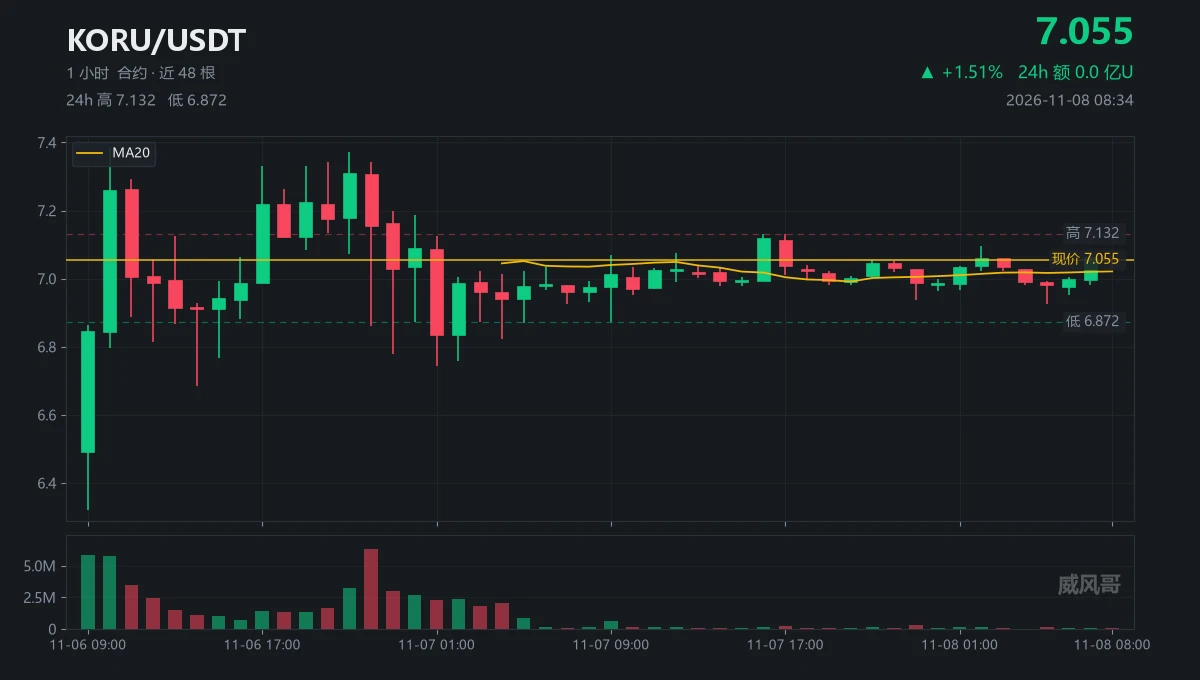
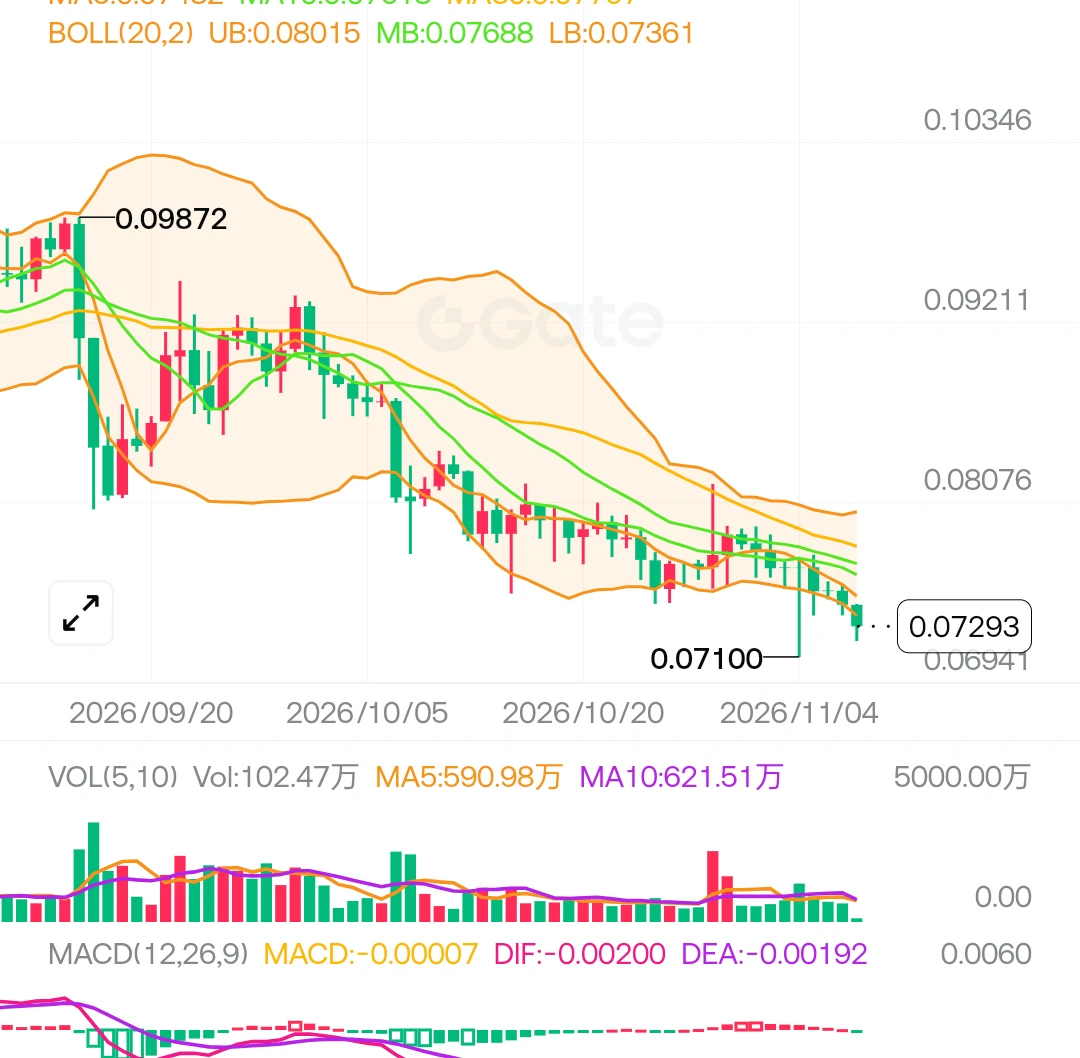
The best thing about this coin is that it can do in one hour what others take a week to do
But that hour was at 10:00 on 11-06, and it's already gone
6.321 to 7.387, up 16.9%; that's what 3x leverage feels like
But over the next 46 hours, it just wheezed sideways between 6.686 and 7.372
Now at 7.055, chasing a long with a stop at 6.93 means risking 0.125
Targeting 7.387 means a gain of 0.332; the 2.6-to-1 ratio looks pretty attractive on paper
The problem is that it has tested above 7.10 thirteen times and below 6.90 fifteen times
Twenty-eight boundary touches; at 0.1 per round trip, three tim
post-image
KORU-1.22%
Who is buying in the Bitcoin market? The U.S. premium index has been negative for 44 consecutive days, and capital flows are revealing an important signal!

Many investors watch Bitcoin’s price every day, happy when it rises and worried when it falls, but overlook a more important question: who exactly is buying?
Recently, the premium index has been negative for 44 consecutive days, making it a signal that has drawn attention in the crypto market.
Put simply, if Bitcoin’s price is lower than on other major trading platforms, it usually indicates relatively weak buying demand in the U.S. market
AMD+11.55%
  • 34
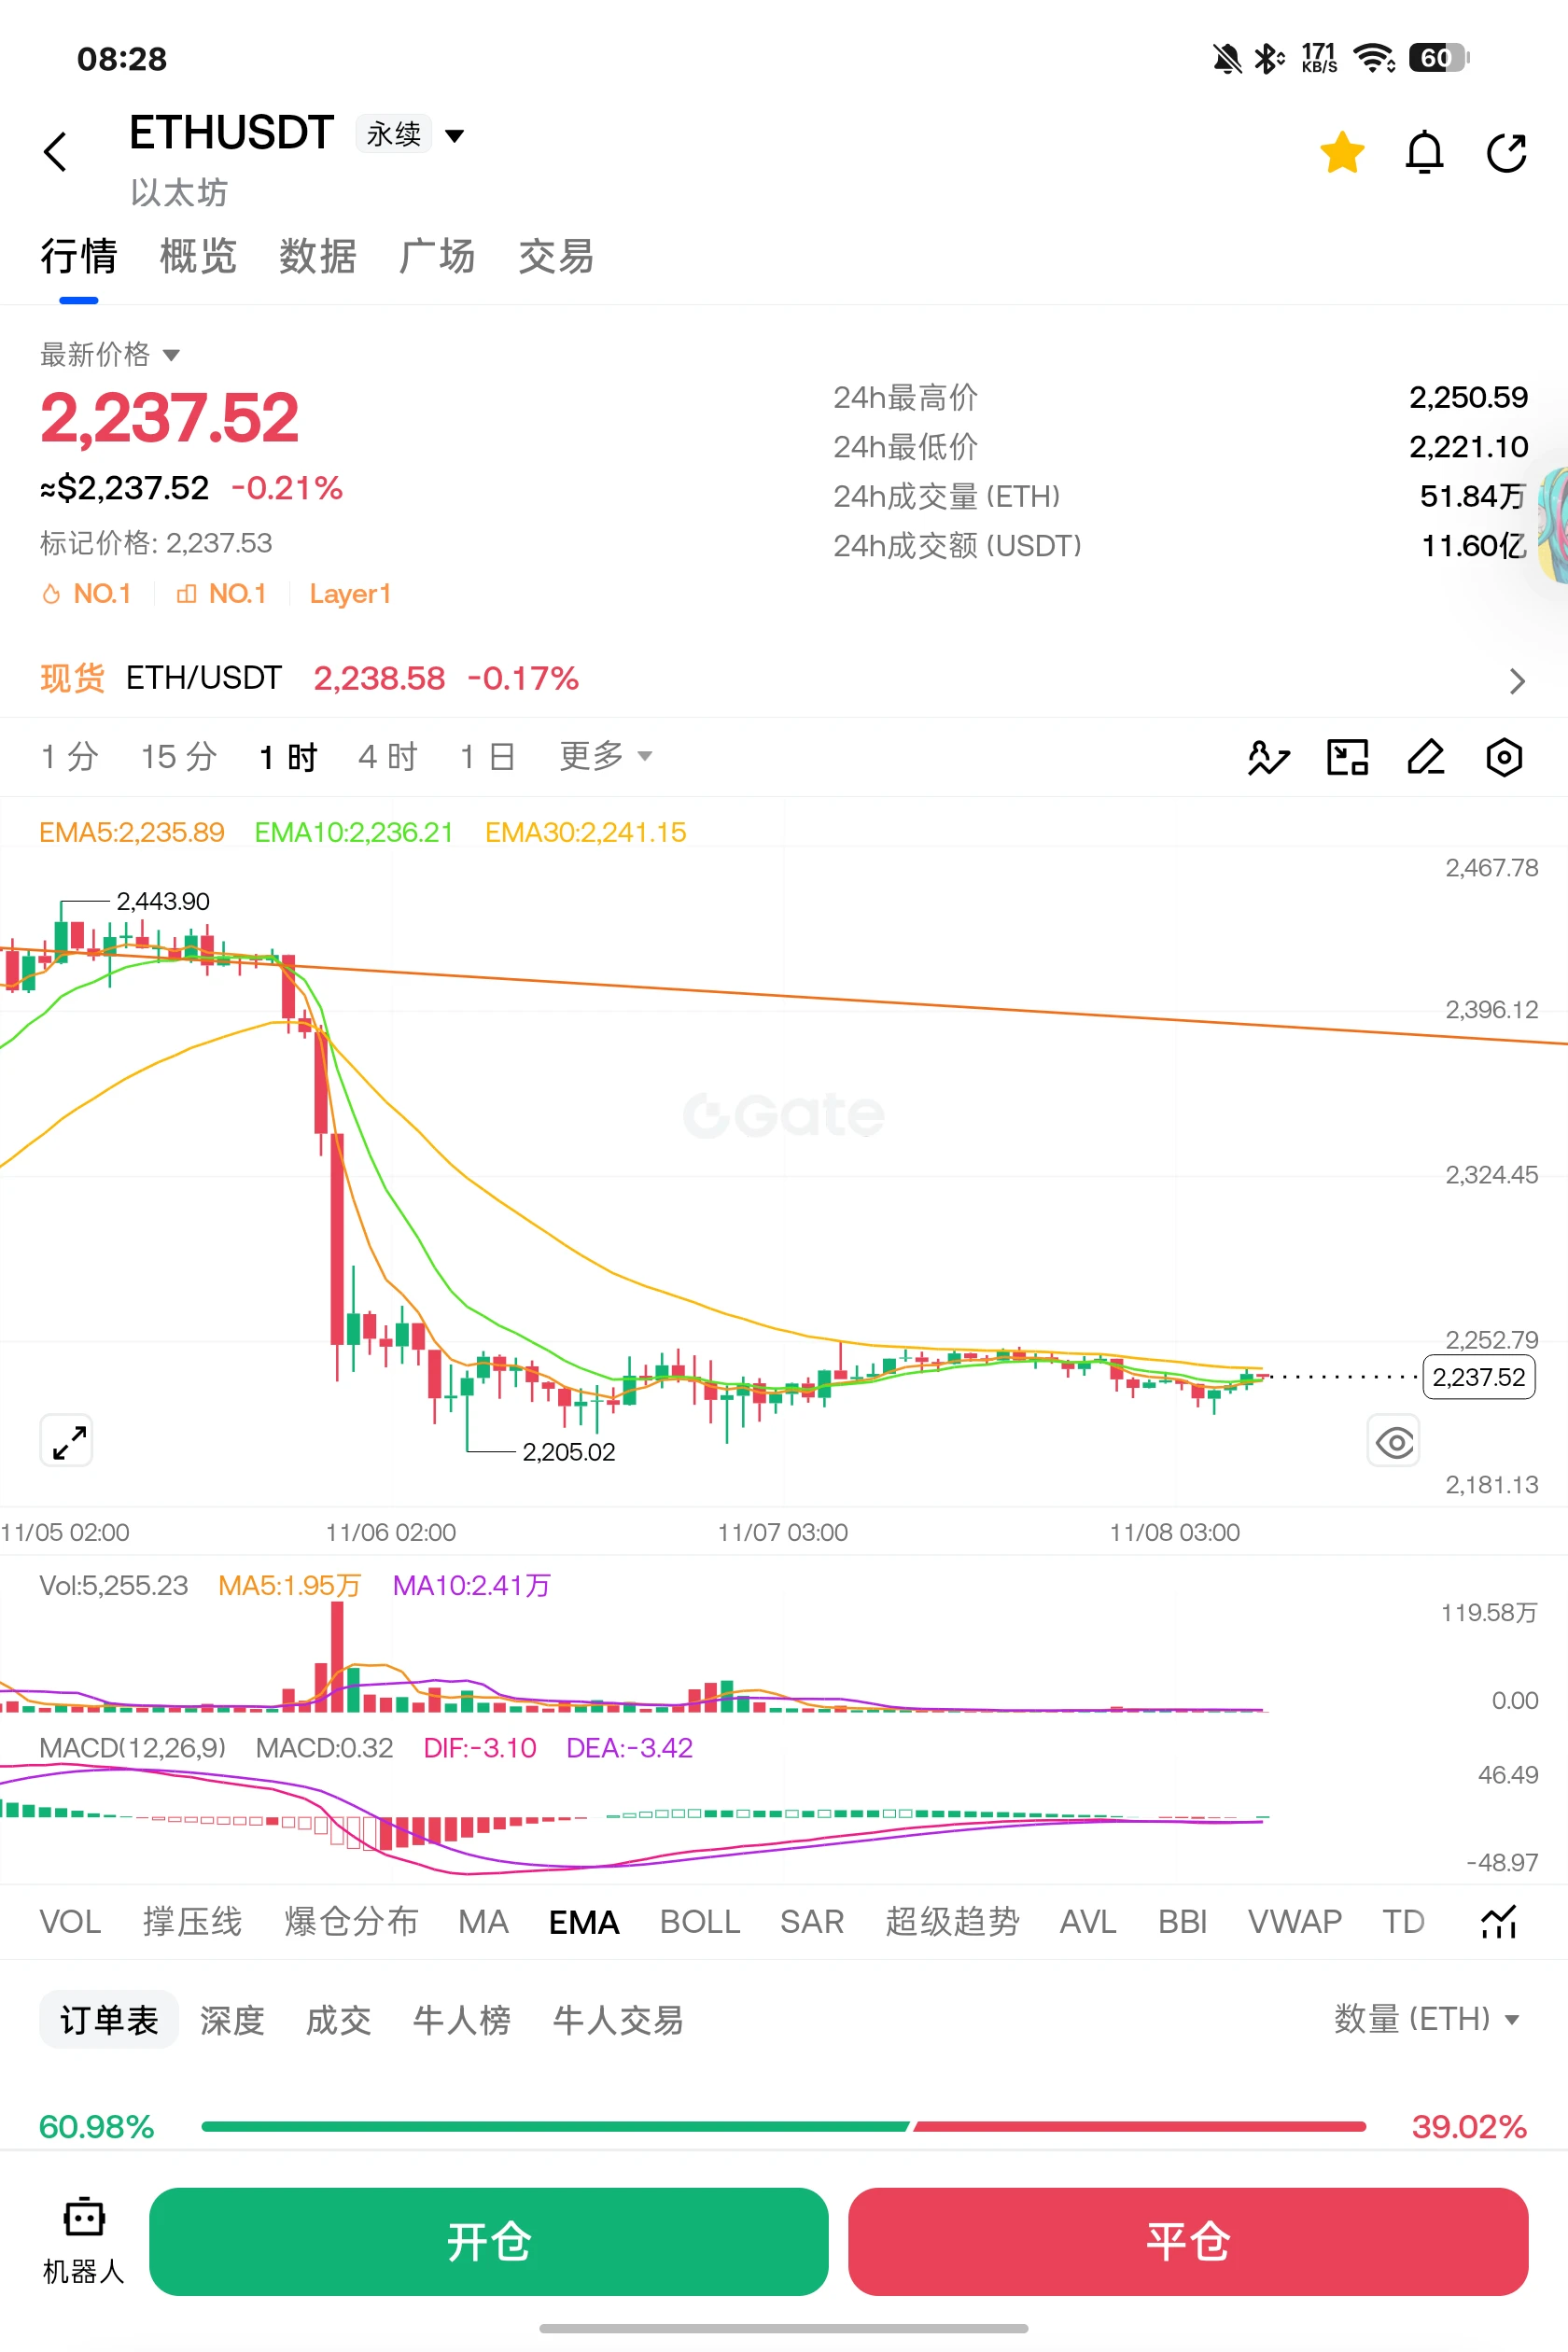
Market volatility is extremely low. The crypto market has had almost no independent movement recently, following broader markets and often falling with them but not rising. US October CPI data will be released next Tuesday, and funds are expected to move early to avoid risk over the next two days. Focus mainly on shorting at resistance, with longs at key support as a secondary strategy. See subscription updates for specific entry levels #美股AI板块遭遇重挫
post-image
$PI Whenever you buy, it's the peak
post-image
PI-0.60%
  • 1
Huge data center investments continue to move forward. Is the AI computing power race only just beginning?

Some thought that changes in the U.S. political environment would put the brakes on tech companies' investment plans. But OpenAI gave a different answer.
Chief Financial Officer Sarah Friar said the company would not change its data center investment direction based on the results of the midterm elections.
Behind this is the actual demand in the artificial intelligence industry.
Today, AI models are becoming increasingly complex, user numbers are growing, and enterprise customers' demand
MU+4.71%
  • 12
CRYPTO MARKET UPDATE
live-cover
LIVE571
I'm trading on Gate, a top-tier exchange with a 13-year track record. Come join me and dive into the hottest events right now! https://www.gate.com/campaigns/6905?ref=VLARBF1YAG&ref_type=132
post-image
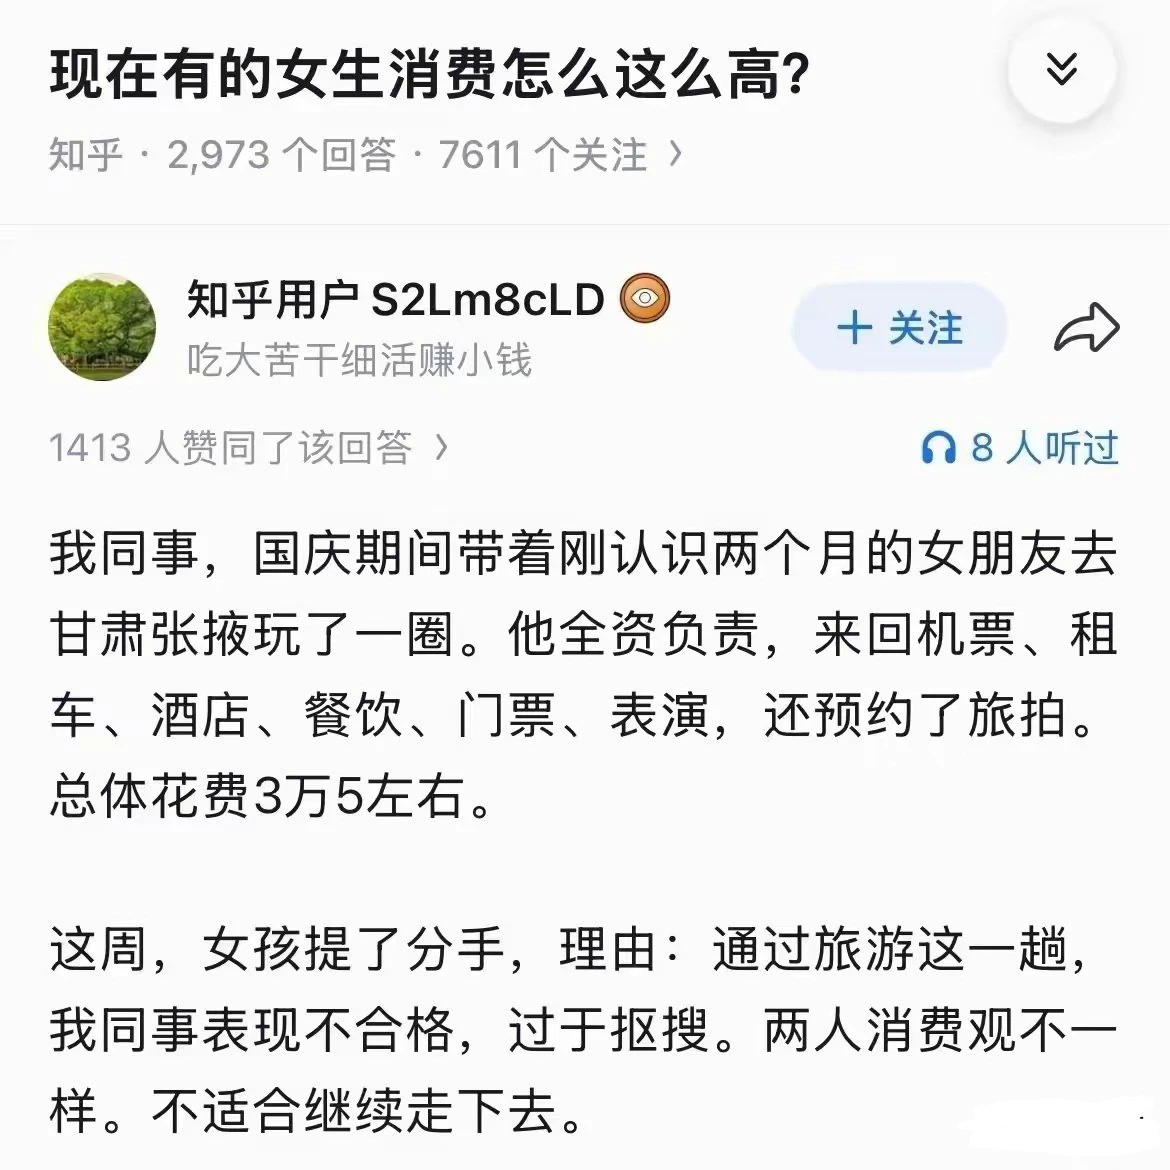
As everyone knows, when you travel, you either split the costs (AA) or use the AB method.
post-image
BTC market update
live-cover
LIVE2,790
#USAIStocksHitHard

USAIStocksHitHard: Wall Street’s AI Boom Faces a Reality Check

Market Shock

U.S. stocks suffered a major selloff on Thursday, November 5, as investors rapidly reduced their exposure to technology and artificial intelligence stocks. The Nasdaq Composite dropped 5.5%, while the Philadelphia Semiconductor Index plunged approximately 12.2%. The decline was severe enough to push the Nasdaq into correction territory, meaning it had fallen more than 10% from its recent record high.

The Dow Jones Industrial Average also declined 3.4%, while the S&P 500 lost 4.4%. This was not a
post-image
AMD+11.55%
  • 1
ESPORTS | Long 🟢 | Bullish | 15-minute 24-hour: +6.12% | Volume: 47.1M USDT Long rationale: Price is above EMA200; EMA20/50/200 are in bullish alignment; RSI14 is 61.9; MACD histogram is positive; ADX14 is 26.4; volume is 1.84x the 20-candle average; trend pullback/continuation. Entry: 0.011167 Stop loss: 0.0108735 Take profit 1: 0.0115339 | Take profit 2: 0.011754 | Take profit 3: 0.0120475 Entry price is for reference only; do not chase. The strategy is invalidated if the stop-loss level is hit. Technical analysis only, not financial advice. $ESPORTS
post-image
ESPORTS-5.30%
77.7%! The Fed’s December rate-hike probability suddenly surged—can gold investors sleep tonight?

What does the gold market fear most? Not rain or wind, but the Fed suddenly changing its course on interest rates!
After the release of the U.S. October nonfarm payrolls data, expectations of a December rate hike rose noticeably. Employment increased by 165k, far above expectations of 65k, while the unemployment rate also fell to 4.1%.
The report reminded the market that the U.S. labor market may not yet be weak enough to require the Fed to rush into rate cuts.
Rising rate-hike expectations typic
SPCX+8.74%
  • 12
Load More

Join 40 M users in our growing community

⚡️ Join 40 M users in the crypto craze discussion

💬 Engage with your favorite top creators

👍 See what interests you

Trending Topics

USCPIDataIncoming

23.39k Views1.45k Discussing

The U.S. October CPI report will be released on November 10 at 8:30 a.m. ET. September CPI came in at 3.7% year over year, and markets will be watching closely for signs that inflation is cooling, especially in core CPI. A softer-than-expected reading could strengthen rate-cut expectations, while hotter inflation may pressure risk assets through higher Treasury yields and a stronger dollar. How do you think this CPI print will move $BTC, U.S. stocks and gold?

USAIStocksHitHard

22.67k Views3.69k Discussing

USNonfarmPayrolls

38.29k Views4.37k Discussing

View More