Square
Following
Hot
News
Notifications
Profile
Share your thoughts
placeholder
Article
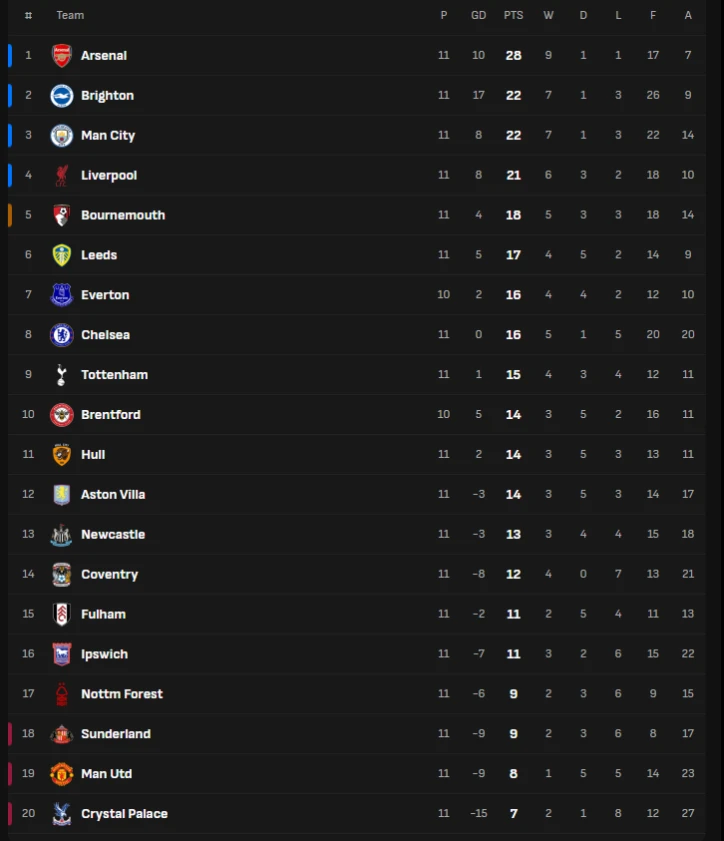
Liverpool 4 vs 0 Manchester United
He who sells a Monkey 🐒 and buys a dog 🐕, he should remember that..................?!!!!
post-image
$NEAR: Use price-volume confirmation to find opportunities; levels and exit lines are here
When I looked at $NEAR ’s chart again, I first covered up the 24-hour +5.54%. It’s just too easy to let that grab your attention. What really needs explaining right now is that $NEAR’s price has already moved, but trading activity and volume haven’t followed. We can tentatively trust the direction, but not assume it will continue; a move without anyone following through can be reversed at any time.
My view: the direction is tentatively in place, but low participation makes this move less credible.
Here’s
post-image
Trenches
PIEVERSE
P
bade
b
PIEVERSE
0x0e...25a9
Market Cap
$.
Change
.
24h Vol
$.
Holders
.
IDOL
I
bade
b
IDOL
0x3b...ab07
Market Cap
$.
Change
.
24h Vol
$.
Holders
.
JAGENT
J
bade
b
JAGENT
0x8e...ae15
Market Cap
$.
Change
.
24h Vol
$.
Holders
.
mihao
m
bade
b
mihao
4Cxj...pump
Market Cap
$.
Change
.
24h Vol
$.
Holders
.
BLOB
B
bade
b
BLOB
8s11...pump
Market Cap
$.
Change
.
24h Vol
$.
Holders
.
$BEAT finally woke up. Watching it jump back above the moving average, as if it forgot it still had real work to do today. Take profit: 0.07880 Stop loss: 0.07208 Quick market check: $PIEVERSE : Current price 3.6977 - 24-hour change: +9.13%$BR : Current price 0.4596 - 24-hour change: +15.62%
post-image
BEAT-1.19%
PIEVERSE+0.58%
BR+6.00%
Market update
live-cover
LIVE1,857
PEARL-2.04%
PIEVERSE+0.58%
Nothing to complain about with this $ACE trade. Take the money while it’s profitable. Close the position here. ROI: 183% Profit: 1029 USDT Also running:
$BR : Current price 0.4579 - 24-hour change: +13.74%
$BLESS : Current price 0.016866 - 24-hour change: +32.51%
post-image
ACE-4.36%
BR+6.00%
BLESS-2.00%
$INIT — Short entry: 0.08439 Take profit 1: 0.08355 Take profit 2: 0.08270 Stop loss: 0.08777 Price edged higher on low volume, testing resistance; cautious optimism has waned due to a lack of stronger market participation.
post-image
INIT-2.53%
Bitcoin whale wallets surge, but why is total BTC supply declining?
Bitcoin's 10+ BTC club is growing — but the picture is more complicated than it looks.
Santiment reports that the number of Bitcoin addresses holding at least 10 BTC has reached 150,770, the highest level since January 2026. The milestone comes as Bitcoin trades back around $63,000, pushing more addresses past the 10 BTC threshold.
⚠️ Personal market analysis only. NFA — manage risk and DYOR.
Educational content, not investment advice or a recommendation to buy, sell, deposit, or withdraw any asset. No paid promotion or referr
post-image
BTC-0.67%
I'm a ManUnited fan since 98 and I started crypto in 2013... "same energy"...
post-image
$ZEC The current price is 794.75, up slightly by 0.58% over the past 24 hours. However, the 1-hour chart looks strong, while the 4-hour chart looks weak, showing a clear divergence. The 1-hour RSI is 69.4, versus 45.21 on the 4-hour chart, suggesting mixed market sentiment in the short term.
I’ll wait here and avoid guessing the direction: go long on an upside breakout and short on a downside breakout—follow whichever direction gets a confirmed breakout. The current price is 794.75, with a stop loss at 761.28. If it falls below that, I’ll admit defeat.
This is not investment advice.
#ZEC #Zcas
post-image
ZEC+1.16%
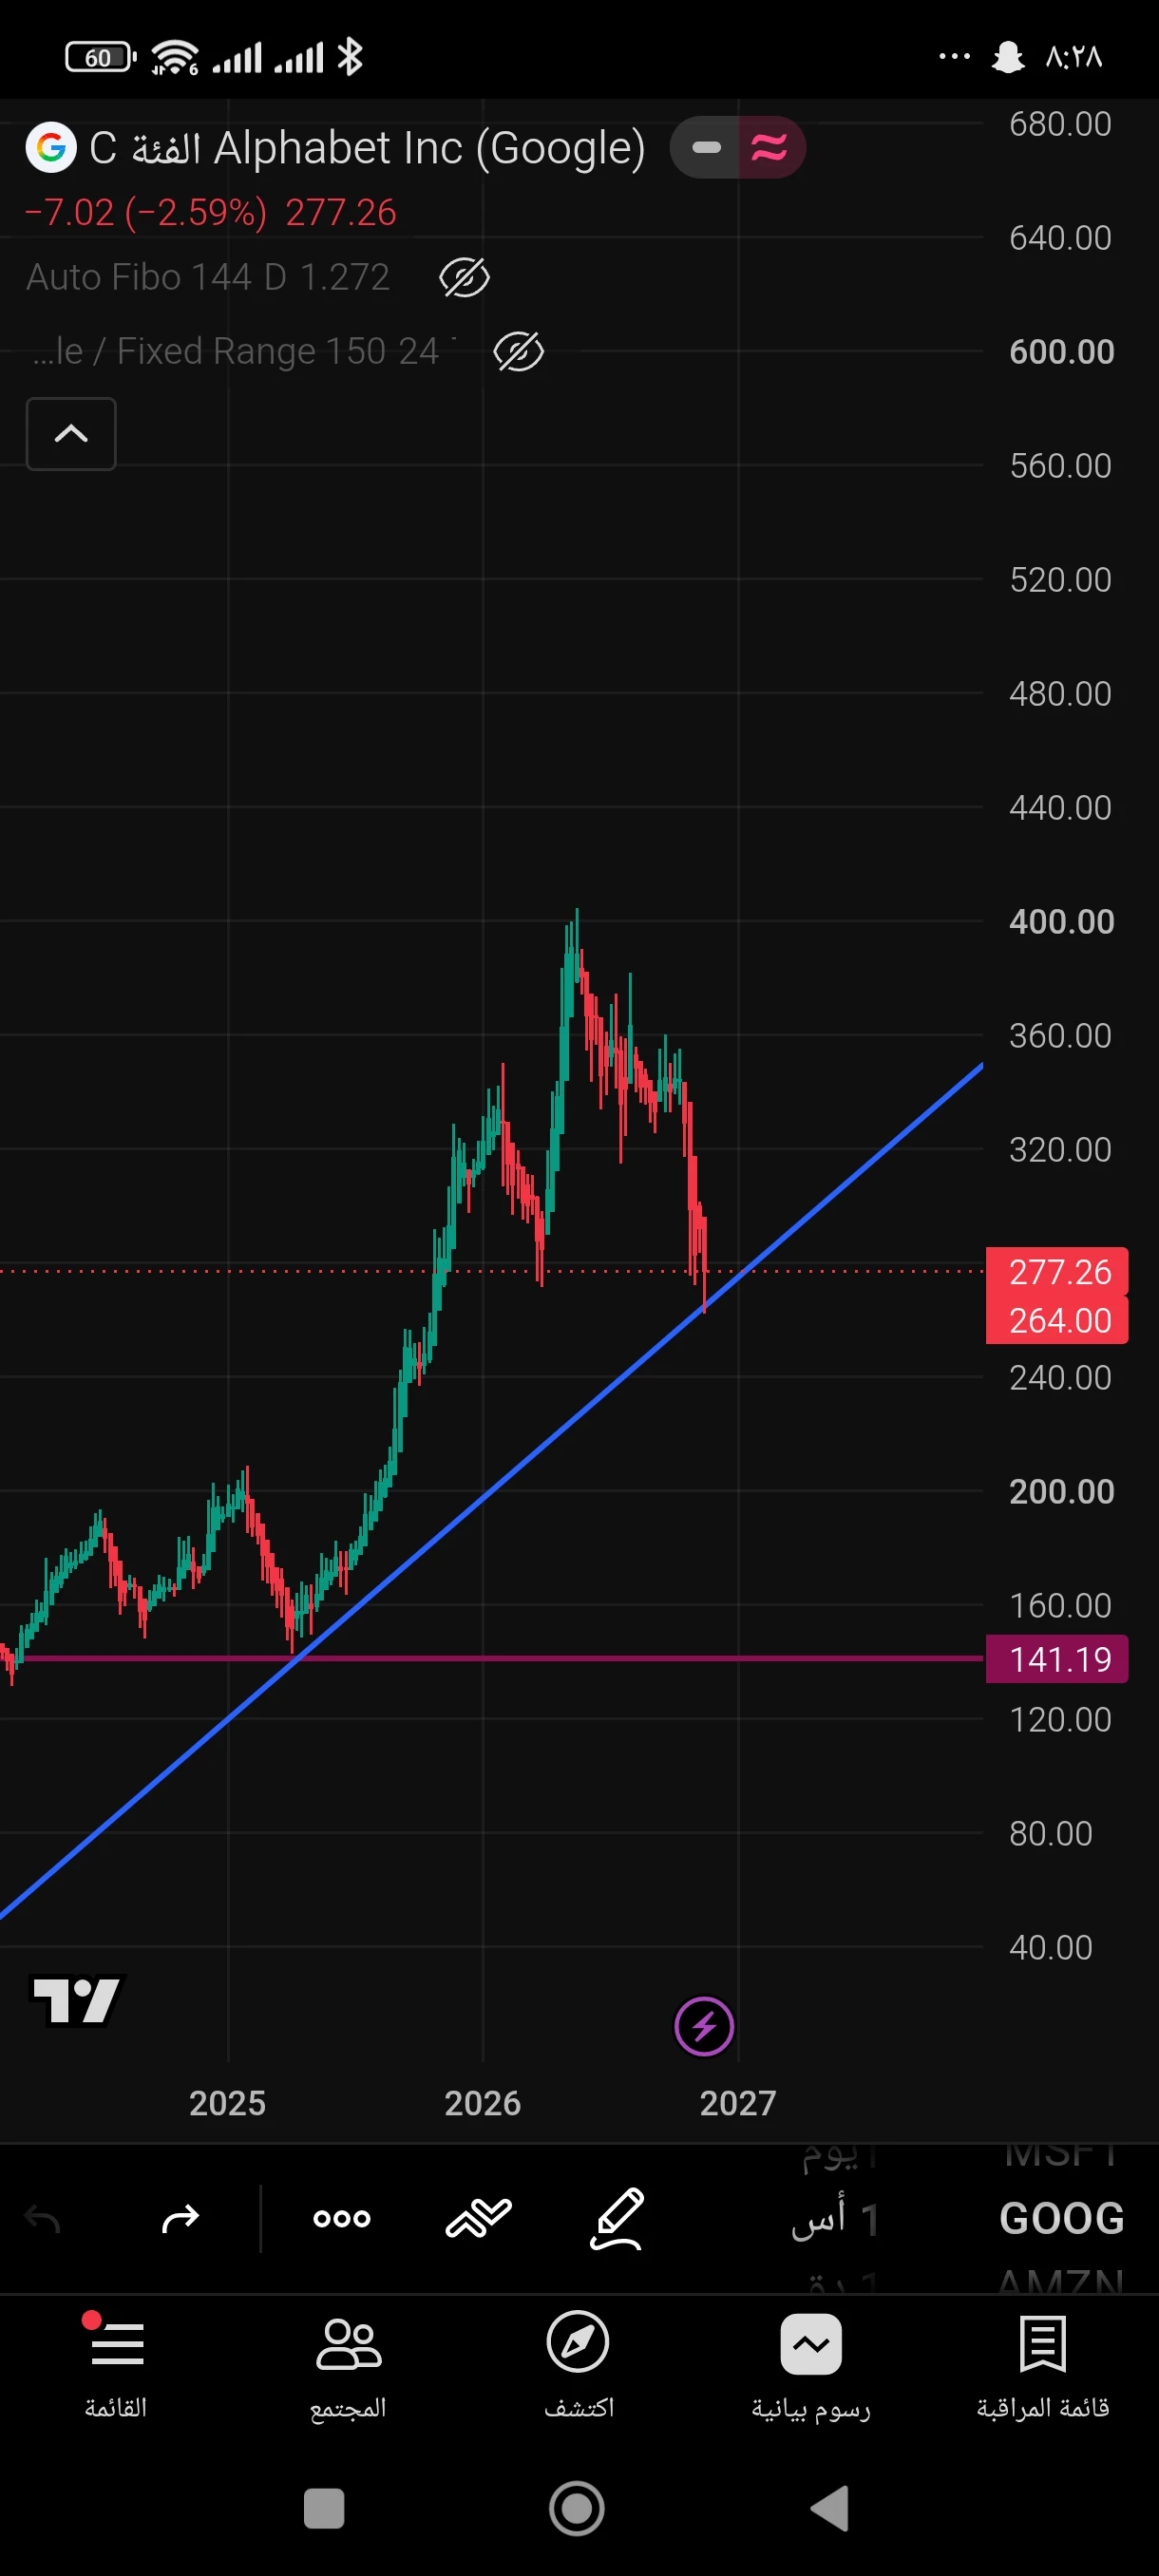
🚨 Beware potential downside in Google (Alphabet) stock... The $275 level is decisive! 📉

The stock is at a sensitive technical stage on the weekly timeframe, after coming under selling pressure and breaking below the previous support zone between $270 and $275.

But the next scenario depends on the stock’s ability to reclaim this area and hold above it.

📉 Bearish scenario:

If the stock fails to hold above $275 and resumes trading below it, we could see another downward wave, with a possible test of $265, then $257–$260 if selling pressure continues.

Reclaiming $275 and holding above it,
post-image
GOOGL-2.50%
  • 1
$DOGE There’s only one number behind the reversal, not a moving average: the 0.054 line.

It touched it in November 2022, then rose +184%; it touched it in June 2023, then rose +760%. Saturday’s drop to 0.0500 was a wick below followed by a recovery, not a close below. The daily RSI briefly fell below 20 this month, its lowest since June, and has now recovered to around 25.

One more factor: the counterparties to that INS short were wiped out on Saturday—of the 14.79 million in 24-hour liquidations, longs accounted for 90%, and OI fell 11% to 685 million. The forced liquidations are over; the
DOGE-0.18%
BTC-0.65%
ETH-1.23%
Open your eyes to the market.
Or your ass.
The choice is yours.
(If I'm wrong I'll just delete no worries)
post-image
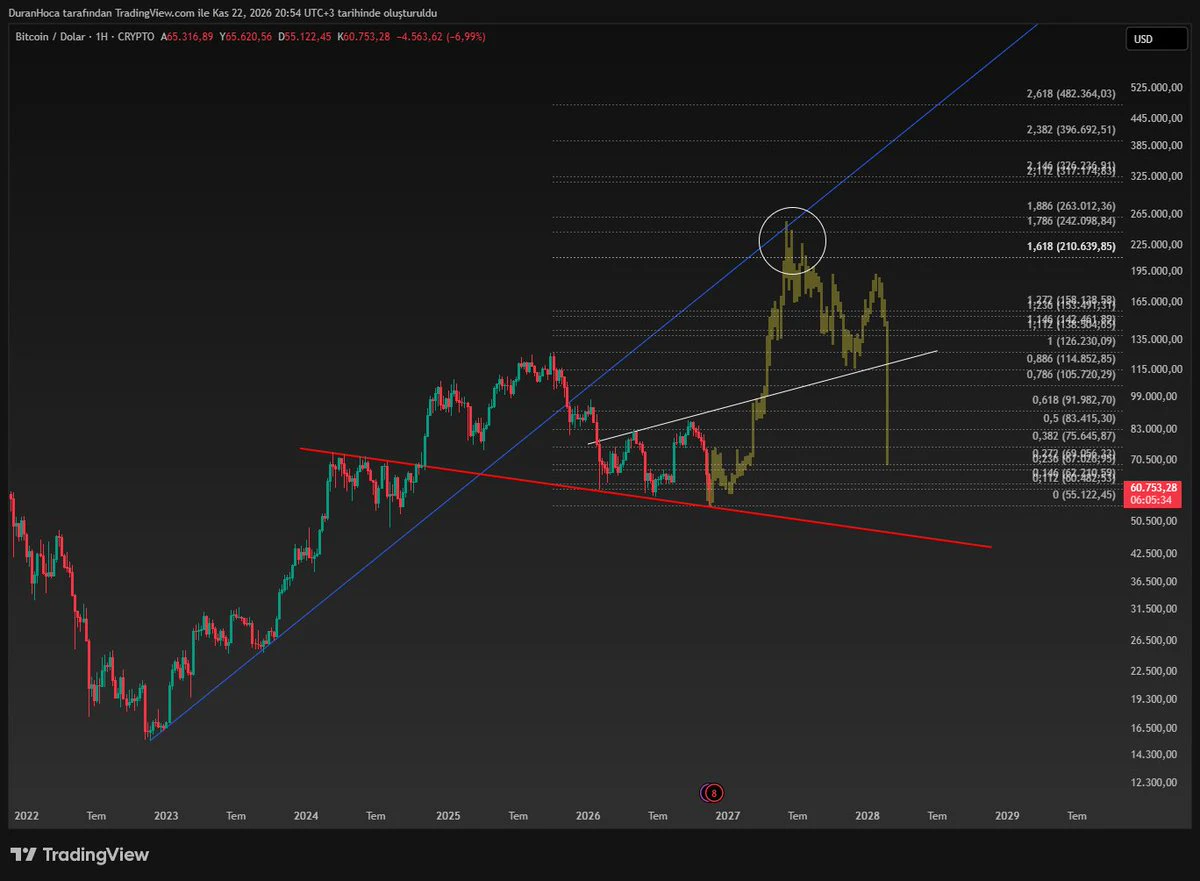
#BTC I did a bit of chart analysis. There are two lines, one red and one white. The red one has become trend support, while the white one is trend resistance.
As long as the red line doesn't break downward, there's no problem. I don't want to say what happens if it breaks—I hope it doesn't.
A breakout above the white line could bring a rally through April-May-June 2026.
It's hard to predict what path altcoins will take at this point.
There are four important things next week.
Wednesday, November 25
👉Core Personal Consumption Expenditures Price Index (YoY)
👉Gross Domestic Product (Quarterly)
post-image
BTC-0.67%
$ZEC Hard line: 808 (24h high + short-position concentration zone). Stay fully positioned only if a 4H candle body closes above 808 and the retest holds 790. Above that, take one-third off at each of 865 (11/20 open), 950, and 1,053. If it fails to close above, halve the position at 790 on the spot; don’t hold through another U.S. market open.

Below, reduce to 20% at 760 (first layer of long-position fuel), down to a watching position at 742 (all three fuel layers dismantled), and exit fully at 687—the moment the wick tip fills, the path points straight to 640 → 580.

Two independent triggers
ZEC+1.29%
BTC-0.65%
ETH-1.23%
Crypto Market Recovery Depends on Stronger Demand and Improved Sentiment
live-cover
LIVE324
NVDA-13.84%
MU-13.88%
AAPL-1.83%
SPCX-7.38%
AMD-13.27%
$BILL is rebuilding bullish momentum. Wait for a healthy pullback before going long. Entry: 0.004050 – 0.004100 Take profit: 0.004400 – 0.004600 Stop loss: 0.003900
post-image
BILL-4.10%
$SOL 70.39, 24H -0.50%. 1h resistance at 71.43 hasn’t been firmly reclaimed on a candle close, and RSI 62 isn’t overbought yet. Volume is thinning, and the 4h trend is still weak, so don’t rush in the short term. I’m only watching 71.43: follow only if it holds; otherwise, keep waiting. Don’t mistake sideways action for a reversal—wait patiently for confirmation. At this level, I really don’t feel comfortable adding to my position casually; I’m mainly staying on the sidelines. Not touching it for now. Wait a bit longer. Not investment advice
#SOL #Solana
post-image
SOL-0.77%
$LLY Eli Lilly and Company (NYSE: LLY) shares traded at $1,347.11 at the close of the regular session on November 20, 2026 (-0.31% for the day), with the company's market capitalization at around $1.27 trillion.
LLY-0.32%
Load More

Join 40 M users in our growing community

⚡️ Join 40 M users in the crypto craze discussion

💬 Engage with your favorite top creators

👍 See what interests you

Trending Topics

BTCReboundFaces60KTest

2.2M Views30.1K Discussing

BTC rebounded from around $55,300 on November 21, briefly reclaiming $60,000 before pulling back to around $59,300. The $60K level is back in focus as traders assess whether the recovery can last. Is this rebound a sign of stabilization or a short-lived recovery? Would reclaiming and holding $60K be enough, or do you need confirmation from trading volume and fund flows?

PCEAndGDPDataNextWeek

260.9K Views2.6K Discussing

GateDirectIPOPhase3ANTAllocates92100Shares

855.6K Views5.1K Discussing

View More