Square
Following
Hot
News
Profile

GateUser-df796f3c

vip
Active for: 1.9y
Peak Tier 0
No content yet
0
Following
12
Followers
123
Liked
A7 International launches today, bringing a new approach to cross-border payments.
Developed by Russia’s PSB Bank, the service lets users settle invoices from foreign counterparties in USDT, while recipients receive the funds through a regular SWIFT bank transfer in their preferred currency.
The service targets foreign trade businesses but is also open to individuals, with a fixed fee of 0.3%.
PSB Bank Chairman Petr Fradkov and A7 CEO Ilan Shor will introduce the service today at 10:13 UTC.
Live:
post-image
We’ve spent years figuring out how to put assets onchain.
But creating the token is probably the easiest part of building an actual market around it.
Once you tokenize a stock, bond, fund or private credit position, you still need:
→ Issuance: a way to bring the asset to market
→ Liquidity: somewhere holders can actually buy and sell
→ Price discovery: a market that can establish what the asset is worth
→ Collateral utility: somewhere the asset can be deposited and used
→ Credit: lenders willing to finance positions against it
→ Asset management: vaults and strategies that can deploy capital i
TOKEN-5.67%
ORCA-5.45%
Gold is already one of the bigger assets moving onchain.
@coingecko’s RWA tracker currently shows $6.06B in tokenized Gold market cap, with $347.9M in 24h volume and +2.9% over the past 30 days.
What I like here is being able to break the RWA market down at the asset level instead of looking at tokenization as one broad narrative.
You can see the assets, issuers, market caps and volumes in one place, with 1,600+ RWAs currently tracked.
Explore the live data here:
RWA+0.15%
I don’t think the +30% move in $STX is just the market reacting to @muneeb taking over @Stacks Labs again.
That’s the obvious catalyst.
The bigger read is that Stacks suddenly has a much clearer sequence for where Bitcoin infrastructure goes next.
Bitcoin Staking is already live.
From there, Muneeb’s KBW framework moves through three increasingly larger problems:
→ Bitcoin capital markets
→ institutional-grade privacy
→ post-quantum Bitcoin infrastructure
That progression makes sense to me.
First, give $BTC holders a reason to put dormant capital to work without giving up self-custody.
Then bu
STX+11.35%
BTC+0.19%
The Bitcoin seller I care about here isn’t necessarily underwater.
It’s the guy sitting on a huge PnL.
CryptoQuant has trader unrealized profits at a 21-month high.
At the same time:
Profit realization is increasing.
Demand is cooling.
That combination is more useful than any of those datapoints in isolation.
Because profitable supply only becomes a problem when the market stops absorbing it.
…
— The Seller Doesn’t Need to Be Bearish
A lot of BTC downside analysis starts with forced sellers.
Liquidations.
Miner selling.
Short-term holder capitulation.
Leverage getting blown out.
But you don’t
BTC+0.19%
  • 2
I checked $KAIO today and saw it was up over 110%, with volume pushing towards $7M.
That got me looking into what’s actually happening around @KAIO_xyz, because price alone doesn’t explain a move like that.
The fundamentals have been moving too.
KAIO brought a Mubadala Capital evergreen private-markets strategy onchain across Base, Solana and Sui, with more than $75M in AUM at launch.
That’s a meaningful institutional milestone.
Now KASH is coming, with the goal of giving broader access to diversified institutional-grade RWA yield.
At the same time, tokenised RWA value is approaching $40B excl
KAIO+9.66%
SOL-3.35%
SUI-4.85%
RWA+0.15%
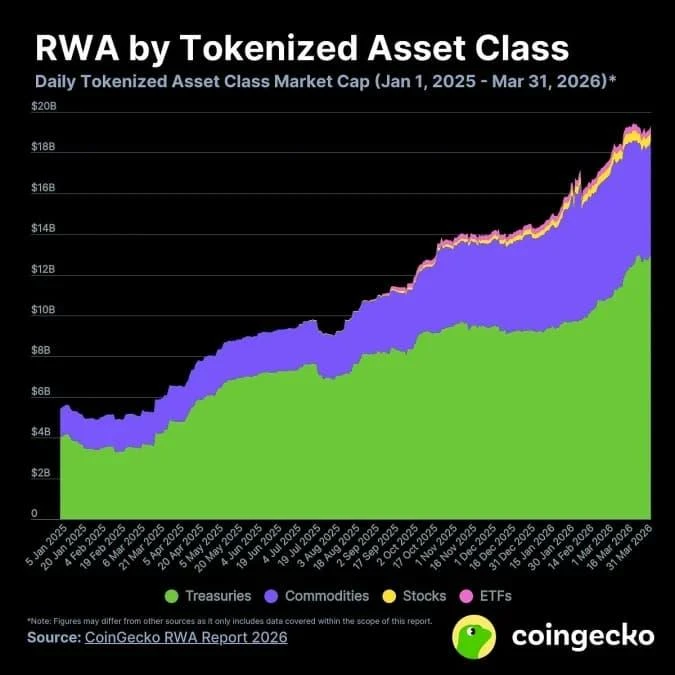
The RWA market looks very different once you stop measuring it as one giant number.
@coingecko’s RWA dashboard gives a better way to read the sector by separating capital, activity and breadth.
Right now, tokenized assets sit around $8.47B in market cap, with roughly $1.53B in 24H volume.
But the real signal is underneath that headline:
• Market cap shows where capital is concentrated
• Volume shows where activity is happening
• Token count shows how quickly the market is expanding
Gold and commodities still account for a large share of the value.
Equities tell a different story.
They represen
post-image
RWA+0.15%
XAUUSD+0.39%
  • 1
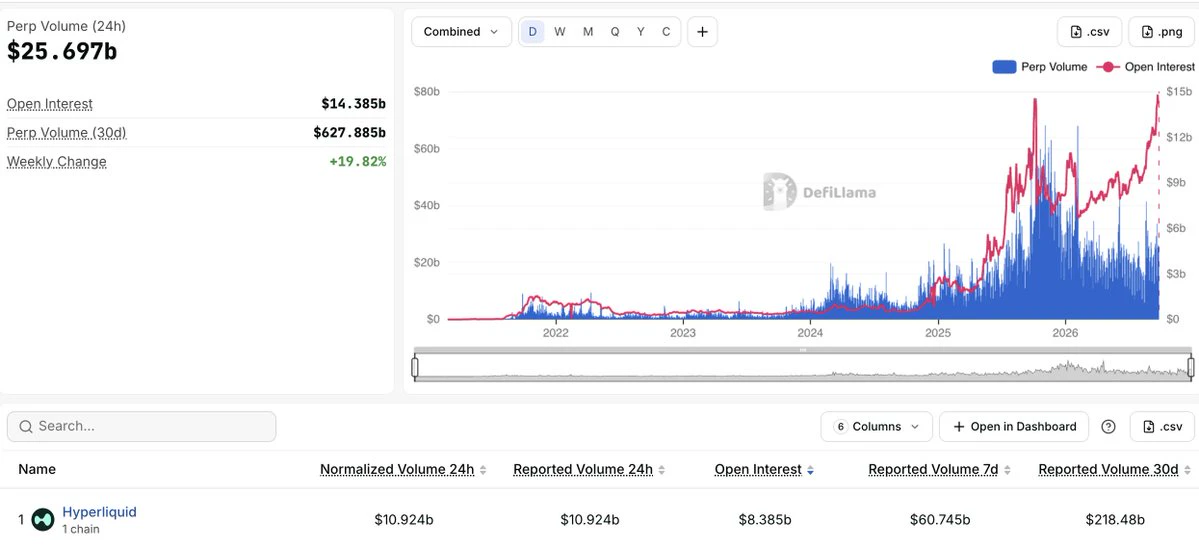
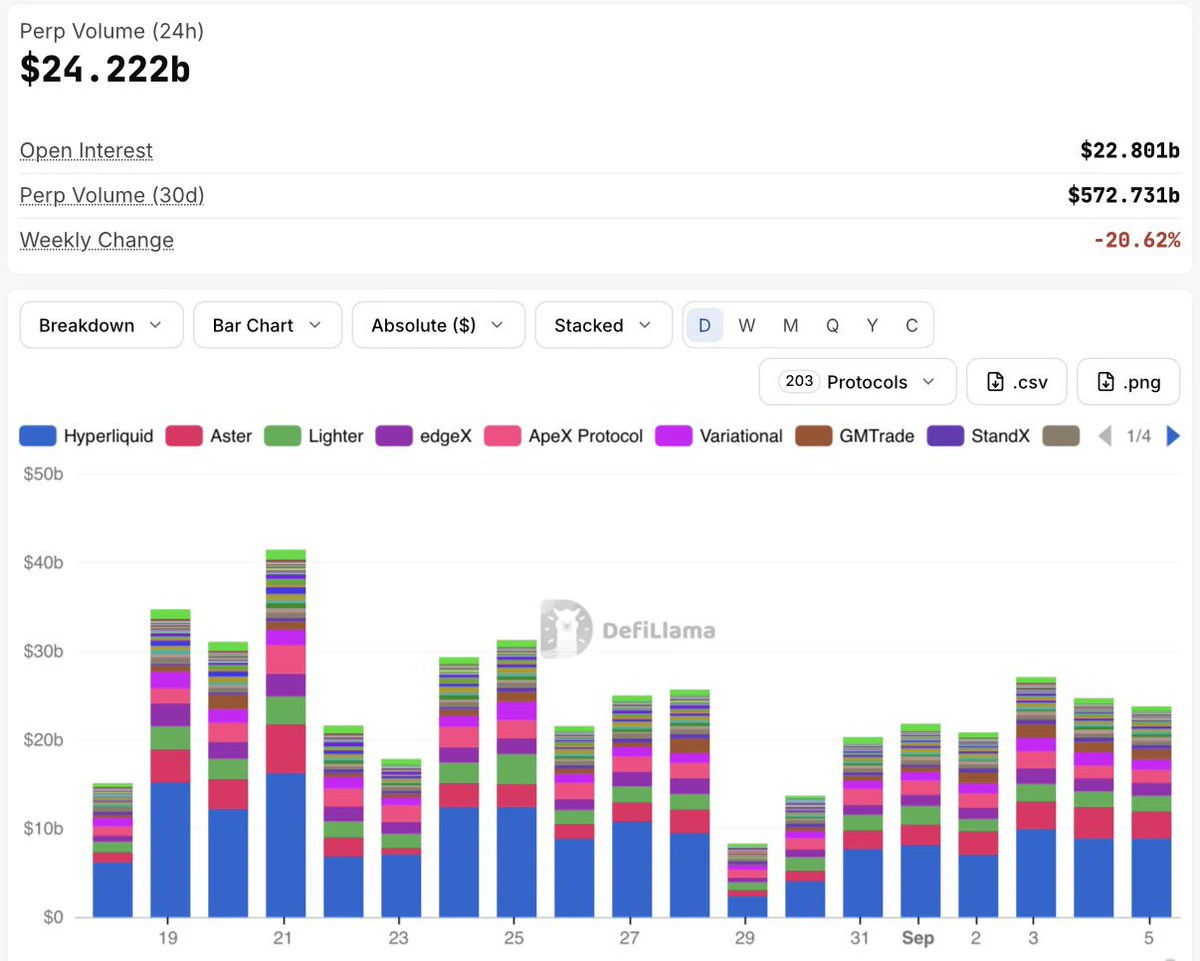
Hyperliquid has 43% of daily perp volume.
But 57% of the market’s open interest.
Across onchain perps:
→ Total OI: $14.6B
→ Hyperliquid OI: $8.38B
→ Daily volume: $25.70B
→ Hyperliquid volume: $10.92B
That gap is more important than the volume ranking.
Hyperliquid isn’t just processing trades.
A much larger share of the market’s outstanding positions is staying there.
Volume tells you where traders are active.
OI tells you where exposure remains.
post-image
HYPE-5.06%
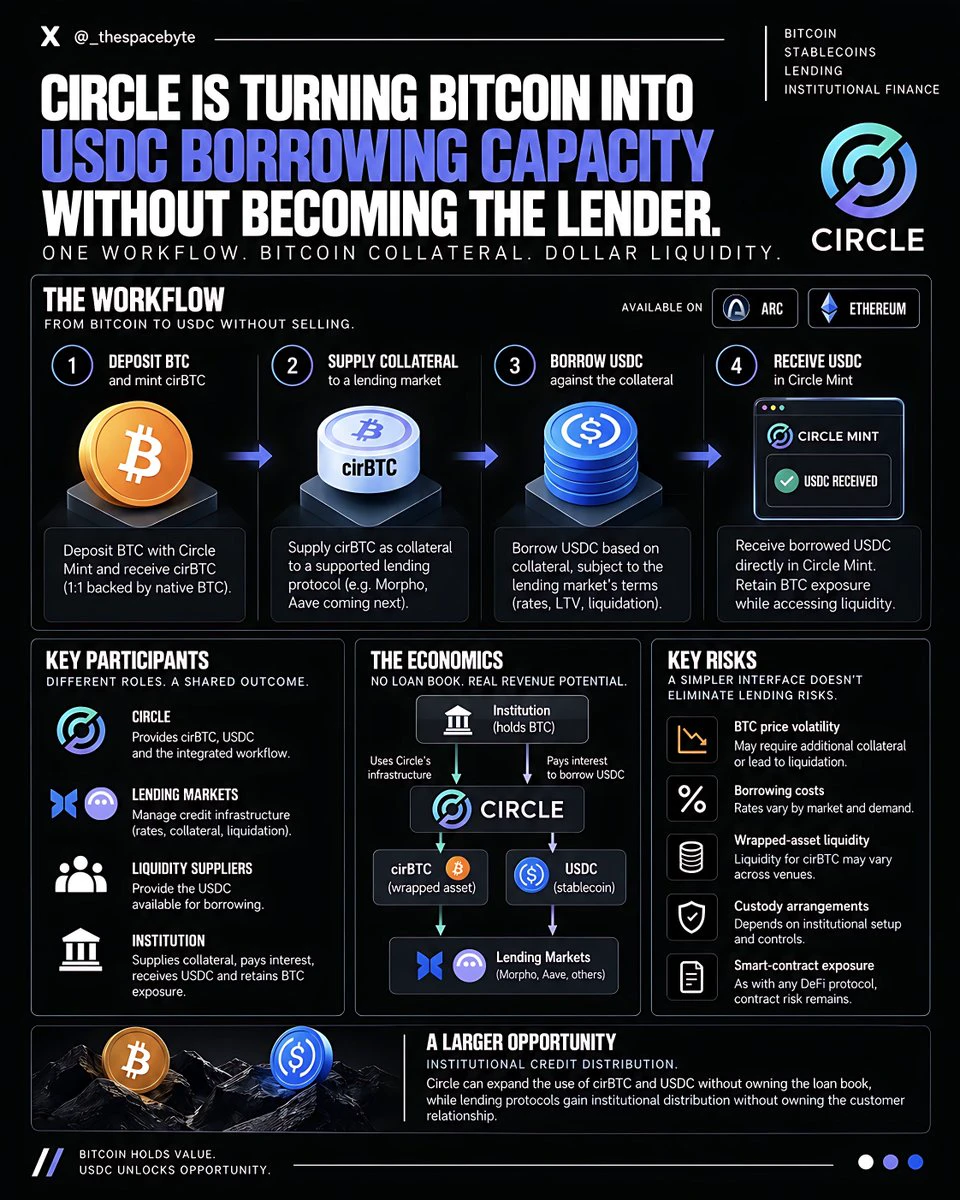
Bitcoin is valuable collateral. But institutions holding BTC long term have often needed to navigate several disconnected systems to access dollar liquidity without selling it.
Circle is bringing those operations into one workflow.
On September 21, @Circle introduced Digital Asset-Backed Borrowing for eligible Circle Mint customers on @Arc and Ethereum.
The process:
• Deposit BTC and mint cirBTC
• Supply cirBTC as collateral to a supported lending market
• Borrow USDC against the collateral
• Receive borrowed USDC directly in Circle Mint
The institution retains its BTC exposure while accessing
post-image
BTC+0.19%
CRCL-0.75%
ETH-1.13%
USDC+0.02%
MORPHO-3.10%
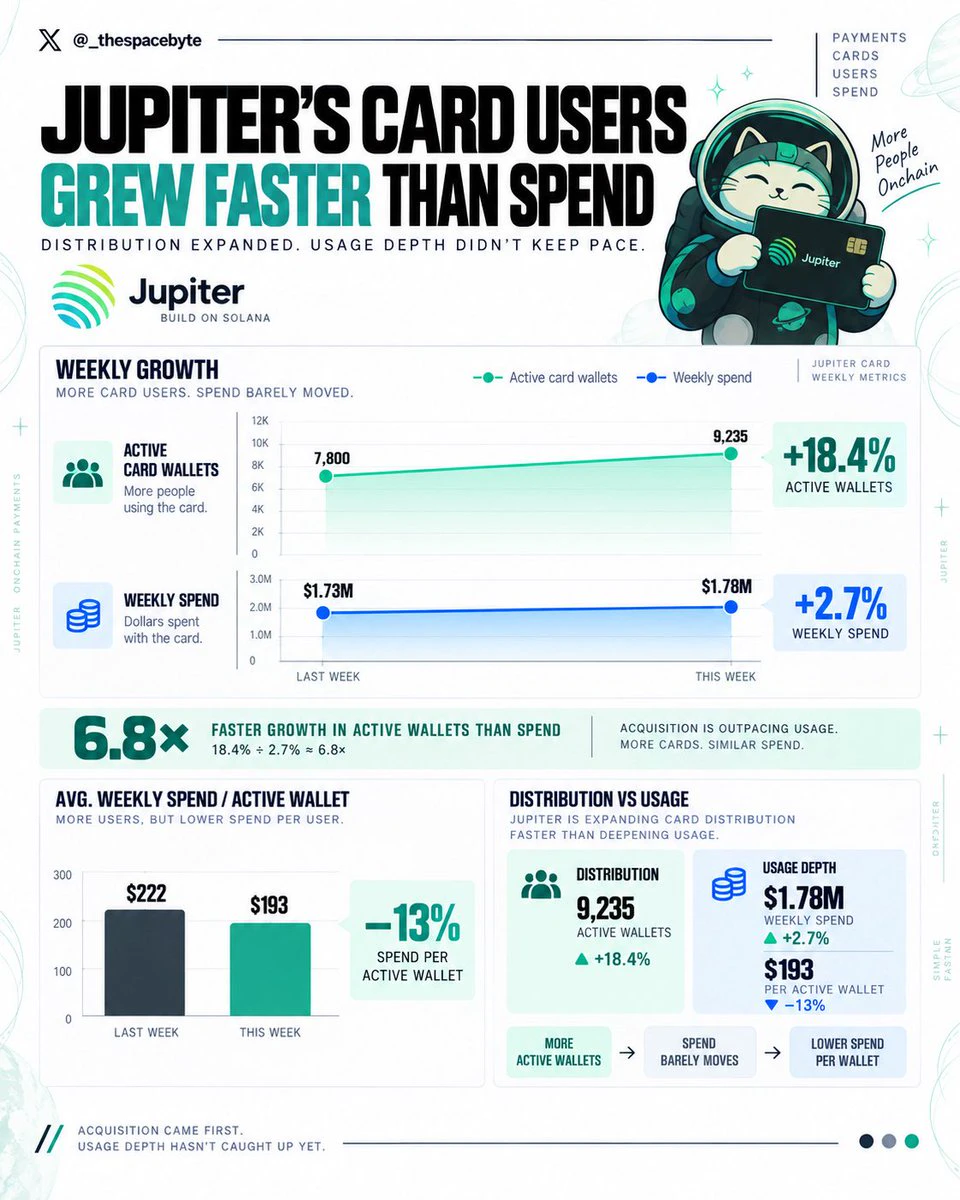
Jupiter added a lot more active card wallets last week.
Spend barely moved with them.
• Active wallets: from 7,800 to 9,235 (+18.4%)
• Weekly spend: from $1.73M to $1.78M (+2.7%)
That’s a pretty big gap.
More people are using the card, but the dollars being spent aren’t growing anywhere near as fast. Which means the average active wallet is currently spending less than it was before.
That doesn’t make the growth bad. It just tells you what kind of growth it is.
Right now, @JupiterExchange is doing a better job expanding card distribution than deepening card usage.
Acquisition came first. Usage
post-image
JUP-6.92%
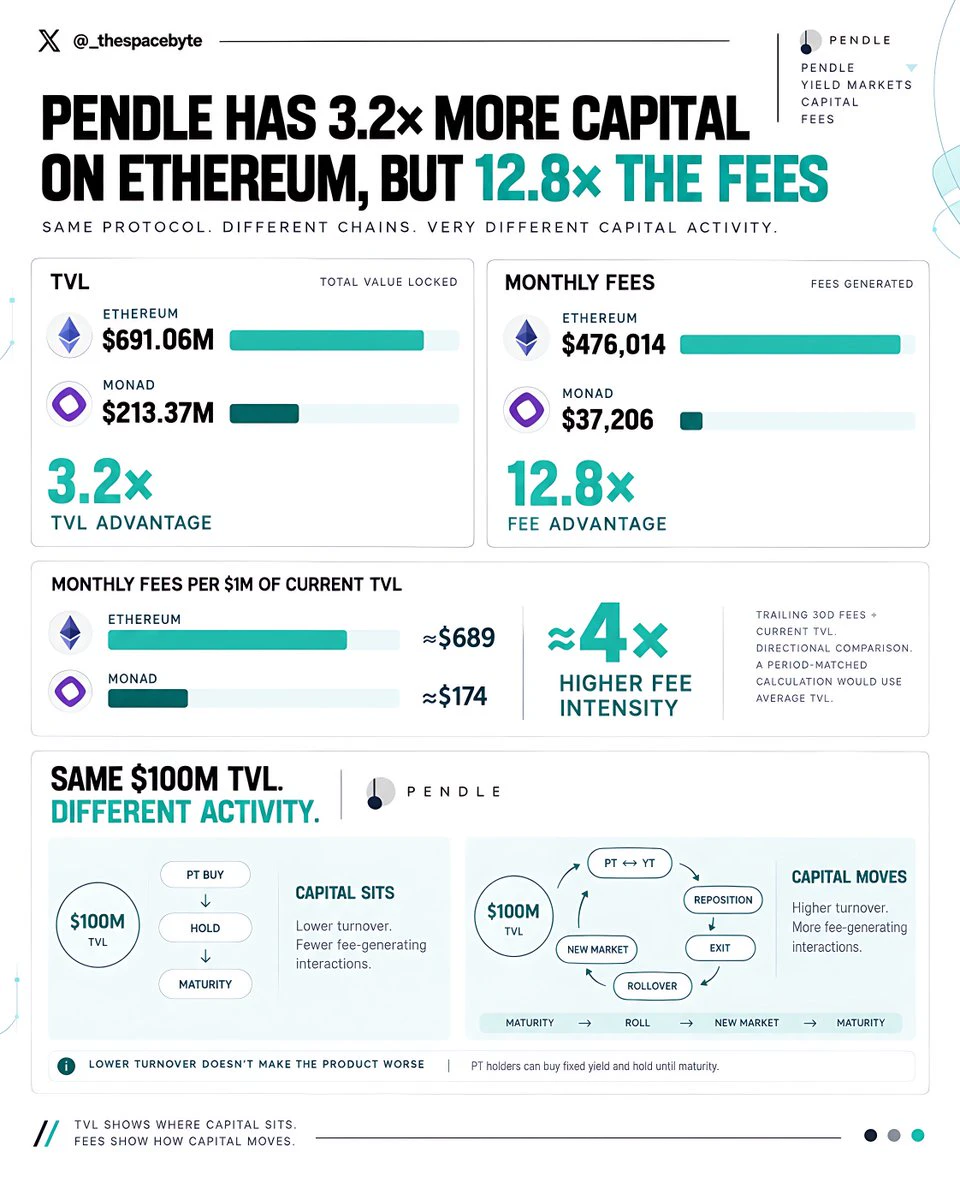
As of today, @pendle_fi has $691.06M in TVL on Ethereum versus $213.37M on Monad.
Ethereum holds roughly 3.2x more capital.
But monthly fees are much further apart:
→ Ethereum: $476,014
→ Monad: $37,206
That’s a 12.8x fee gap from only a 3.2x TVL gap.
This is why TVL alone can be misleading. Two deployments can attract significant capital while producing very different levels of economic activity.
———
— What $1 of TVL Actually Produces
Using current TVL as a rough denominator:
→ Ethereum: $689 monthly fees per $1M TVL
→ Monad: $174
That gives Ethereum roughly 4x higher fee intensity.
It’s not
post-image
PENDLE-3.17%
ETH-1.13%
MON-3.91%
  • 1
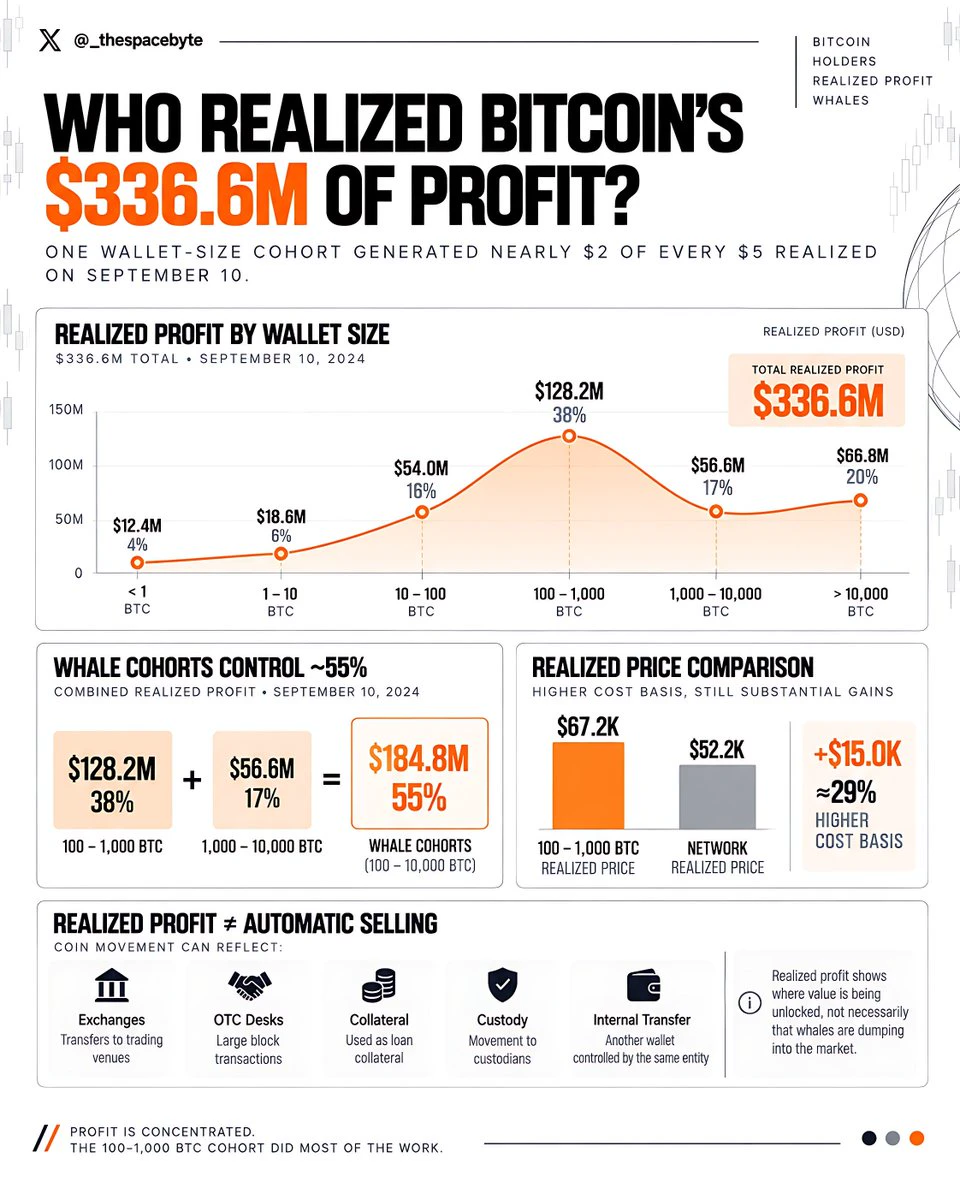
Bitcoin holders realized $336.6M in profit on September 10.
But it wasn’t evenly distributed across the holder base.
One cohort dominated:
• 100–1,000 $BTC : $128.2M
• 1,000–10,000 $BTC: $56.6M
• Total realized profit: $336.6M
The 100–1,000 $BTC cohort alone generated roughly 38% of the entire day’s realized profit.
Combine both whale cohorts and that rises to around 55%.
There’s another useful comparison.
The aggregate realized price of 100–1,000 $BTC wallets is roughly $67.2K, versus $52.2K network-wide.
So this cohort has a significantly higher cost basis than the average $BTC holder, while
post-image
BTC+0.19%
  • 1
Lending might be one of the cleaner rotations happening rn and nobody really talks about it.
Active loans:
• Aave $12.6B +11.9%
• Morpho $5.2B +15.2%
• Spark $2.1B +15.1%
• Fluid $1.7B +9.9%
• Maple $1.2B -9.9%
• Kamino $1.2B +27.9%
• Jupiter $902M +9.9%
@aave obviously still owns the category on size.
But that’s not really the part I’d focus on.
@Morpho loans are growing faster off a $5B base.
@kamino just did +28% in a month.
@0xfluid is quietly at $1.7B now.
And even Jupiter Lend is already pushing $1B.
Feels like lending went from “Aave and everyone else” to a bunch of venues actually find
post-image
AAVE-4.91%
MORPHO-3.10%
SPK-1.93%
FLUID+3.47%
  • 2
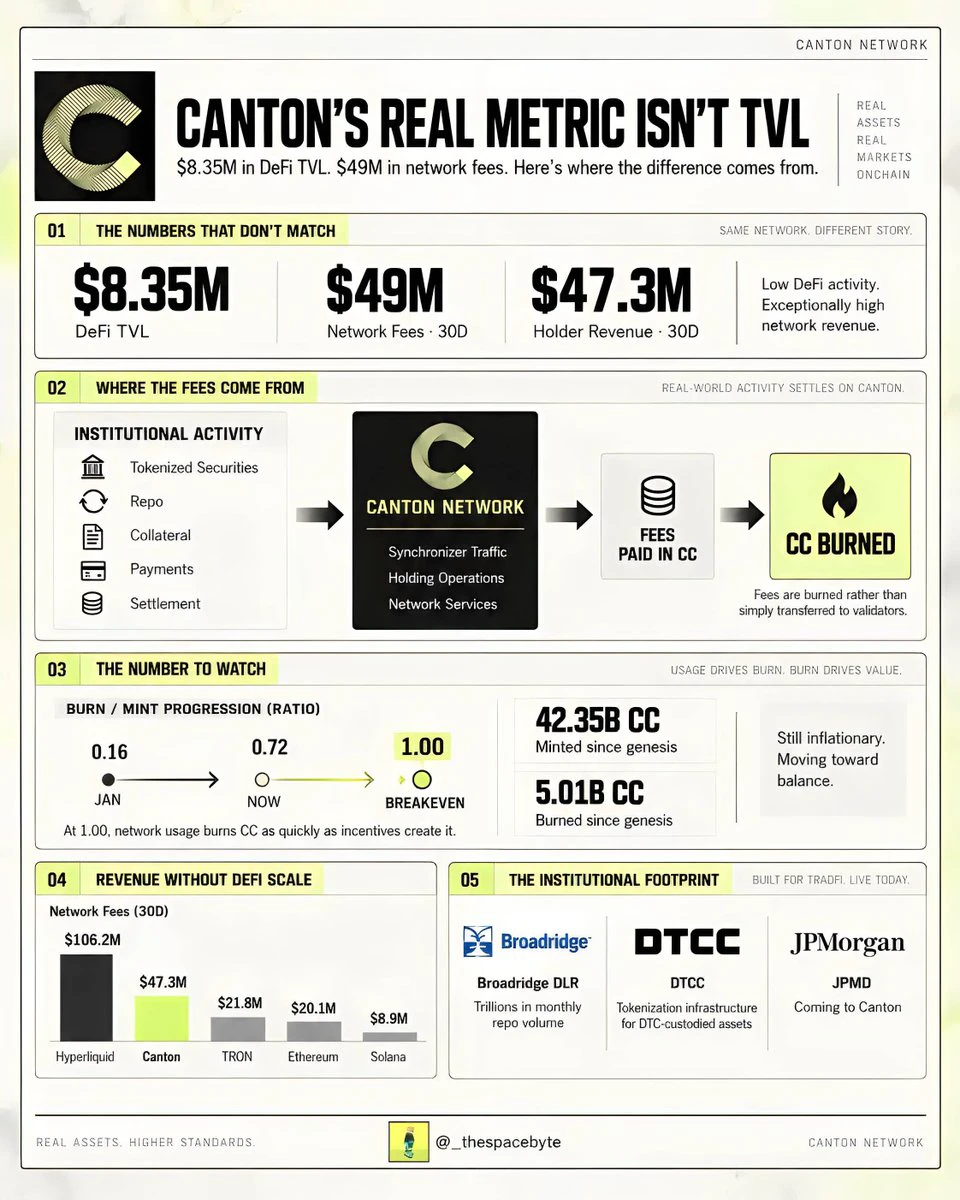
I found something weird in @CantonNetwork’s numbers.
It has only ~$8.35M in DeFi TVL.
Yet over the last 30 days it generated:
• $49M in network fees
• $47.3M in holder revenue
That’s more holder revenue than @trondao , @ethereum and @solana.
Only Hyperliquid is clearly ahead.
Normally, I’d expect numbers like this to come from a massive trading economy.
But Canton did only $105M in 7D DEX volume and $489M in perps.
So where are the fees coming from?
The answer is Canton’s network design.
Users pay for synchronizer traffic, holding and other network operations in CC. Those fees are burned rathe
post-image
ETH-1.13%
SOL-3.35%
HYPE-5.00%
CC-1.47%
DLR+0.72%
  • 1
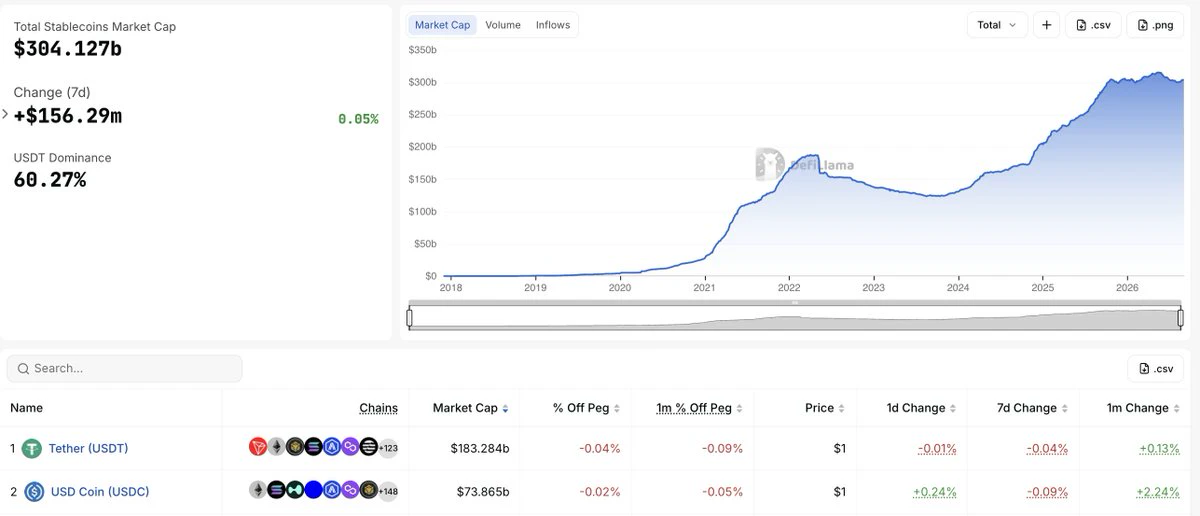
Stablecoin supply closed August at $304.6B.
It’s now sitting around $303.9B, barely lower as September gets underway.
$USDT still dominates with $183.3B, while $USDC has grown 2.4% over the past month to $73.7B.
Total supply isn’t expanding much.
But capital is still moving underneath the surface.
post-image
USDC+0.02%
  • 10