Square
Following
Hot
News
Profile
Share your thoughts
placeholder
Article
The 1K afternoon tea budget got slammed.
Evening Market Latest Update
live-cover
LIVE2,036
Trenches
ZIG
Z
bade
b
ZIG
0x8c...1145
Market Cap
$.
Change
.
24h Vol
$.
Holders
.
KIM
K
bade
b
KIM
8pjf...pump
Market Cap
$.
Change
.
24h Vol
$.
Holders
.
BTC
B
bade
b
BTC
C5xp...pump
Market Cap
$.
Change
.
24h Vol
$.
Holders
.
GTA6
G
bade
b
GTA6
4kjr...zDnz
Market Cap
$.
Change
.
24h Vol
$.
Holders
.
DESSA
D
bade
b
DESSA
npz2...pump
Market Cap
$.
Change
.
24h Vol
$.
Holders
.
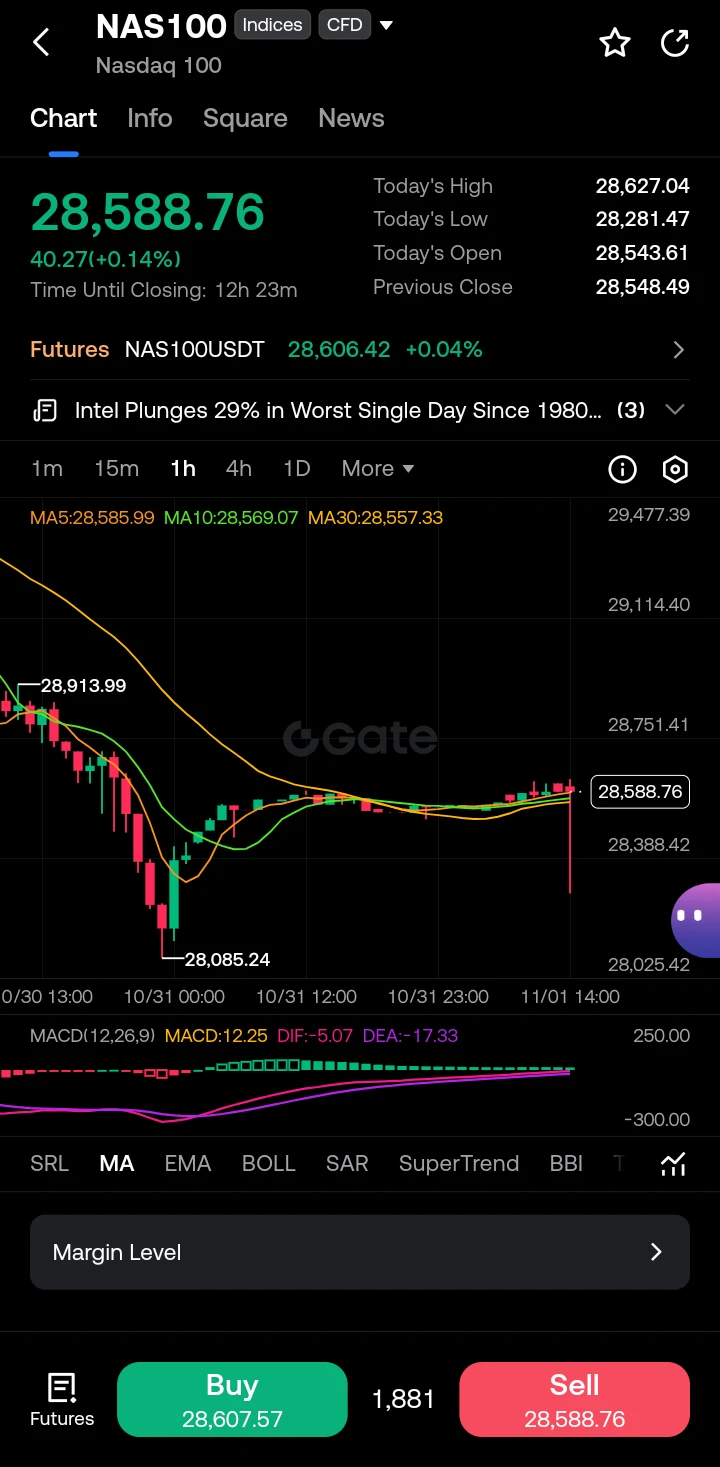
$NAS100 ‌
Current market situation:
The Nasdaq 100 is showing near-term weakness after a sharp sell-off driven by disappointing earnings from Intel (down 29%, its worst day since 1980) and Amazon, with AI-spending fears weighing on tech sentiment . The index is hovering around 28,588, having recovered slightly from lows near 28,085, but the broader technical picture remains bearish with the index trading below key moving averages .
Kline analysis (1H):
The chart shows a sharp decline followed by a consolidation phase, with price action forming a potential base around the 28,500–28,600 zone.
post-image
NAS100-2.31%
  • 6
  • 2
Weekly Market Review
The market was largely range-bound this week. On Friday, heavy selling by bears sent gold prices tumbling, breaking below the range. By the close, gold had hit a low of $3867.
November 26 (Monday): At 5 p.m., I reminded everyone to first watch the resistance around 4030. Gold failed to break above this resistance and was likely to continue falling. After the U.S. market opened that evening, gold rebounded to $4025 before plunging, hitting a low of $3988.
November 27 (Tuesday): Gold traded in a narrow range of 4000–4020 in the morning. At 11:30 a.m., I again said that while
On-chain buying, ETFs selling, what are you doing?
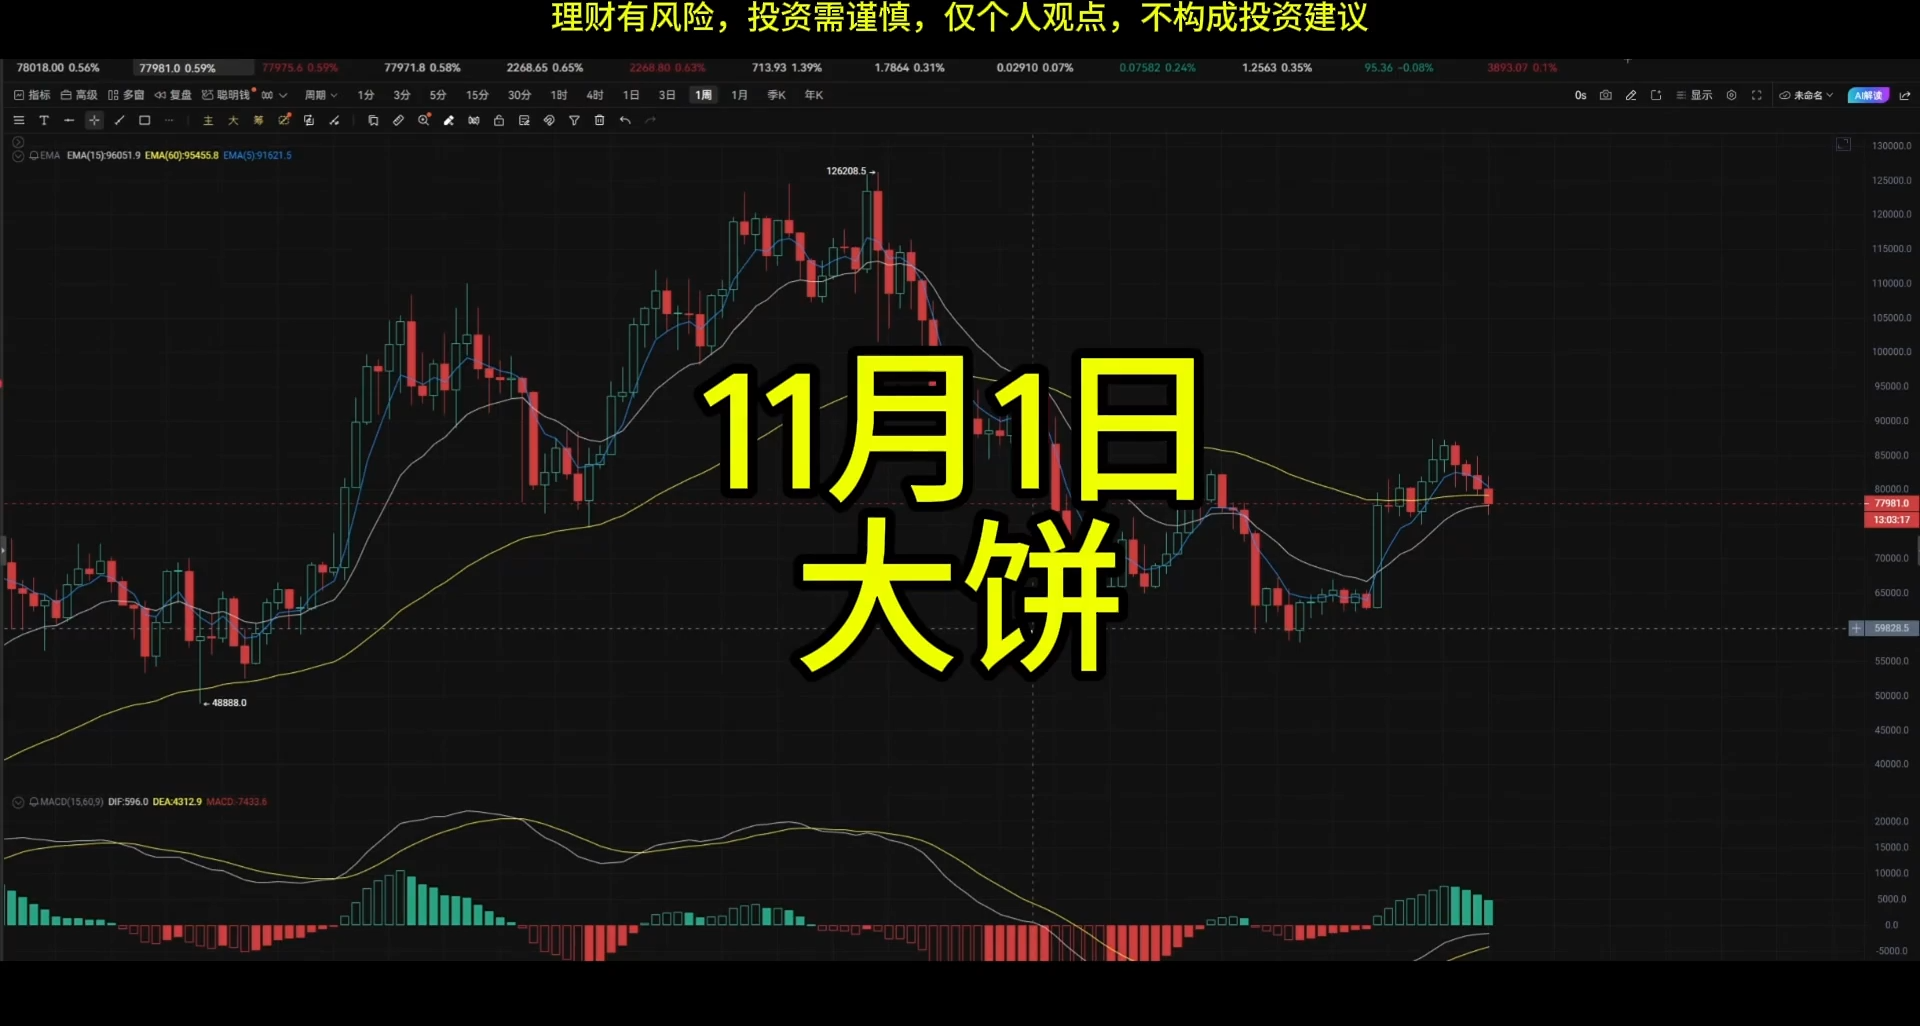
When the price fell to $77,000, different types of capital were doing completely different things.
ETFs were selling. From October 22 to 23, Bitcoin spot ETFs saw cumulative net outflows of $773.5 million, while BTC fell 3.45% over the same period. The single-day net outflow peaked at $636 million midweek, setting a recent record for the largest single-day withdrawal. ETF flows have still totaled about $202 million in net outflows in October. ETF capital is highly sensitive to short-term prices and sentiment; its behavior looks more like “foll
BTC-0.65%
$POWR Up 16% in 24h to 0.07, then dumped back to 0.0657, with $102 million in trading volume—about 10 times the usual level. Who's accumulating?
Looking back through the history books: In the previous halving cycle, after the first rally in the early bull market, mid- and small-cap tokens like POWR that held the 20-day moving average on a pullback marked the start of a second leg up. The current 0.0657 is right at the upper edge of the previous high-volume trading zone. The 24h low of 0.0554 was a false breakdown followed by a recovery—a classic shakeout wick. I don't see any whale outflows in
POWR-0.76%
  • 7
  • 1
When Micron and Hynix made a second new low, did Micron follow with a new low? No. Figure 2 shows Micron's wave pattern. $MU ‌
MU-0.63%
Almost everyone’s feedback about the strategy and indicator has been positive. Everyone is happy and scalping successfully.
Even people who don't understand my language, and whose language I don't understand, are using it and getting results.
I promised that I would make trading easier for everyone, and I will keep that promise.
YOUR BROTHER HAS MADE A PROMISE. WHAT I SAY, I WILL DELIVER. 🐂
UMER THE BULL
  • 1
Bitcoin reference (November 1)$BTC $ETH
BTC-0.65%
ETH-1.23%
$1000PEPE$Short 1000PEPE with a large position now and earn a new Panamera with me tonight 👀Entry price: 0.0049-0.0053, short $1000PEPE 👇
post-image
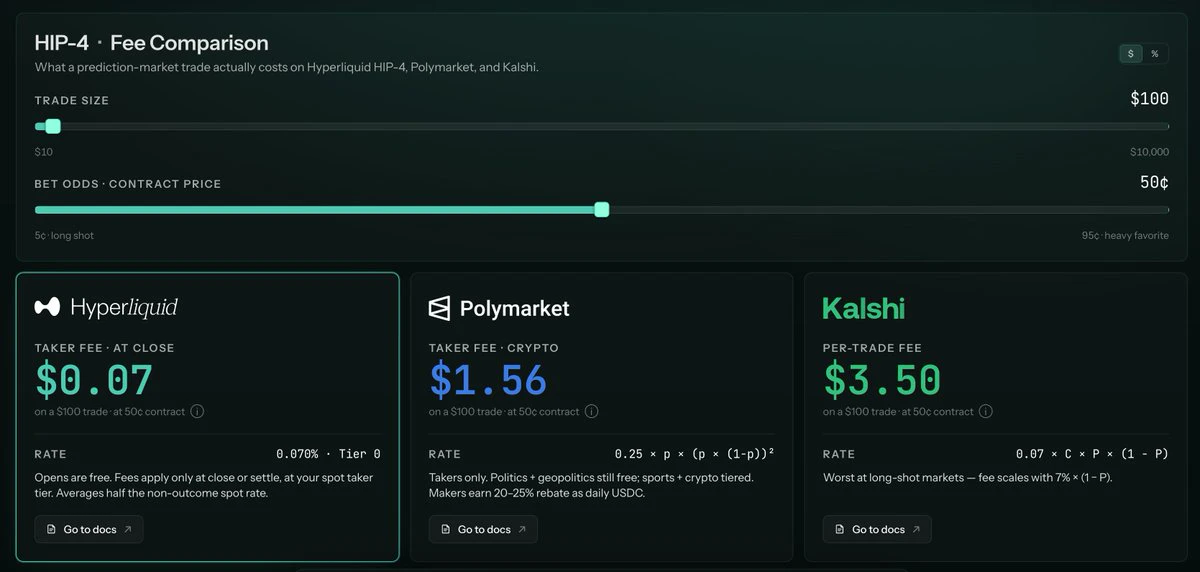
Hyperliquid will win Prediction Markets. Why?
> Fees are a fraction of Polymarket / Kalshi
> Markets are real and settled on chain with better liquidity
> No fake wins on social media to lore in users
post-image
HYPE+0.24%
KALSHI+0.00%
MARKET UPDATE OVERVIEW
live-cover
LIVE1,698
That’s the downside of being single at 36.
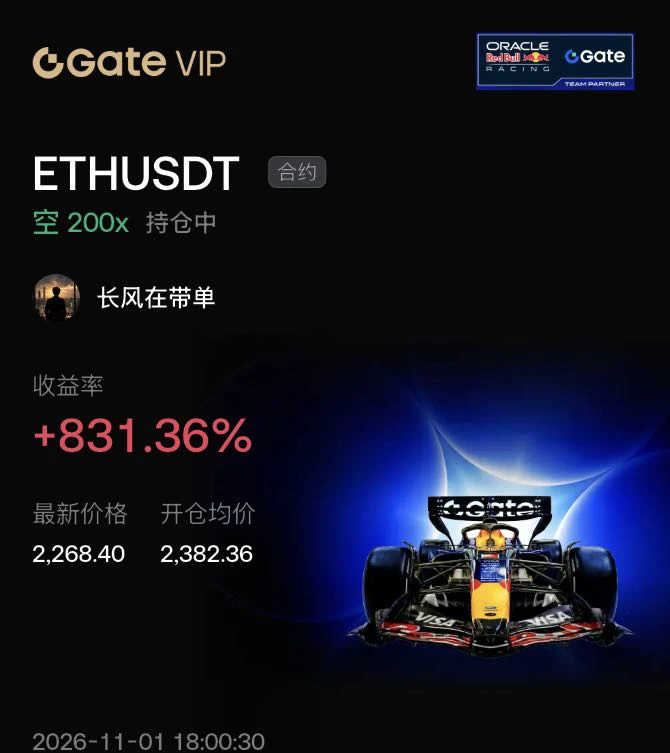
Don’t let $ETH ’s brief rebound over the past few days fool you. The modest uptick is essentially just a brief breather in a bearish market.
ETH spot ETFs have seen sustained outflows recently, with institutional funds continuing to exit. Combined with delays to upgrade news, the market lacks strong positive catalysts, and overall risk appetite is weak. Trading volume has clearly failed to keep pace with the rebound, making this a typical battle over existing funds, with no new capital coming in to provide support. I opened a short position around 2382 because I saw this coming.
On the candles
post-image
ETH-1.23%
BTC-0.65%
  • 1
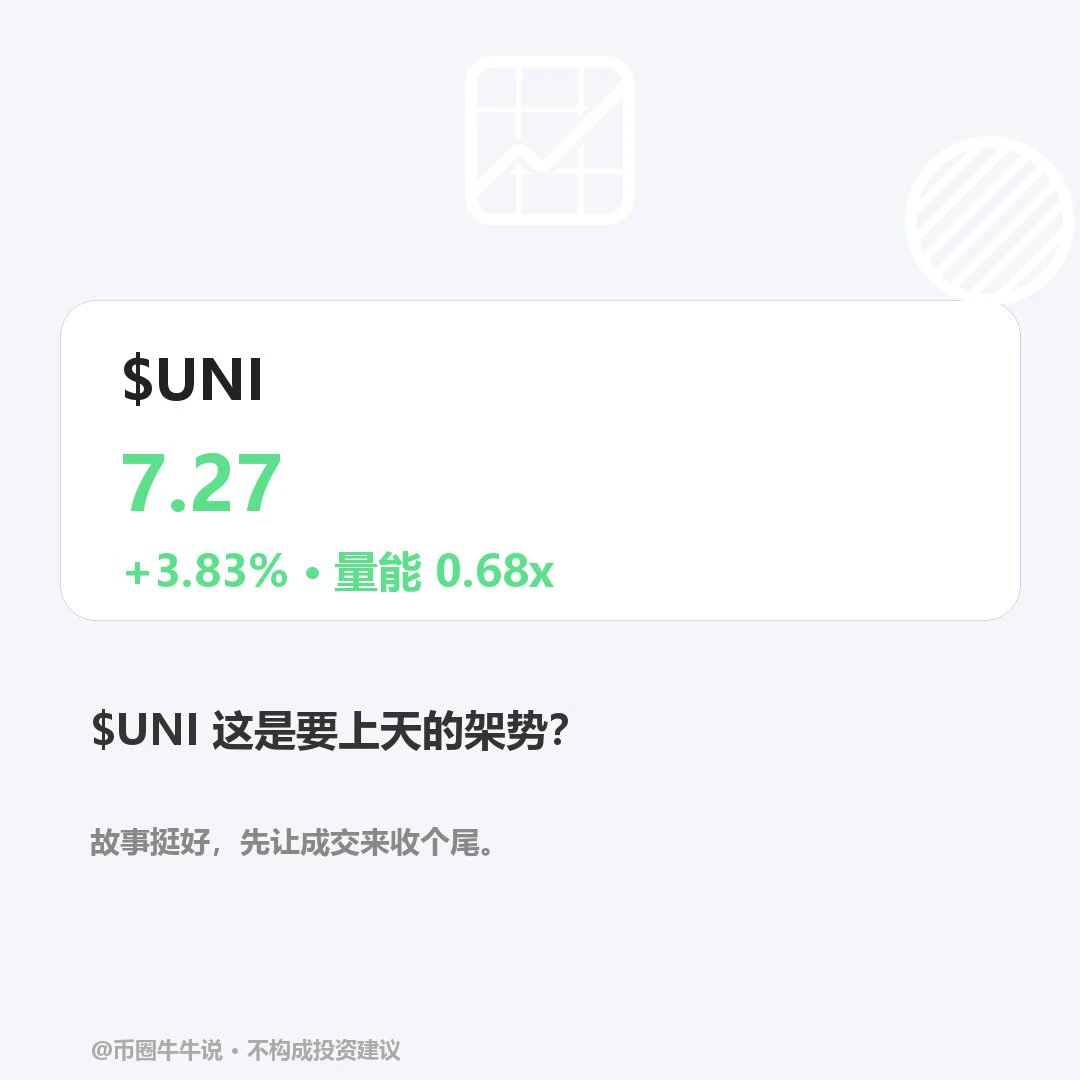
$UNI is currently at 7.272, up 3.83% over 24H. The 1H trend is strong (RSI66.74), and the 4H trend is strong (RSI75.14), pointing upward in tandem. If it holds above the 7.33 resistance, watch for a breakout. If it falls below the 6.948 support, it may move lower. Volume is insufficient, so participation needs confirmation. In the next review, watch whether 7.33 holds and whether the price can recover after losing 6.948. Markets are volatile; for observation only.
post-image
UNI+3.05%
#ETHPullsBack
$ETH ‌#ShareWeekly — Ethereum (ETH): Seven Days of Volatility, a Sharp Sell-Off and the Fight to Recover $2,300
**From Monday’s Opening to Sunday’s Market Position**
Ethereum’s weekly performance tells a story of recovery attempts, aggressive selling and an unfinished battle between buyers and sellers. ETH opened Monday, October 26, around $2,326.58. By Sunday, November 1, the supplied latest price stood at $2,271.43, representing a decline of approximately 2.37% from the weekly opening.
The more important development was the journey between those two prices. ETH reached $2,389
ETH-1.26%
$CORE Every time I get in, it drops. Let it drop, let it drop—we'll charge ahead next year
CORE+1.11%
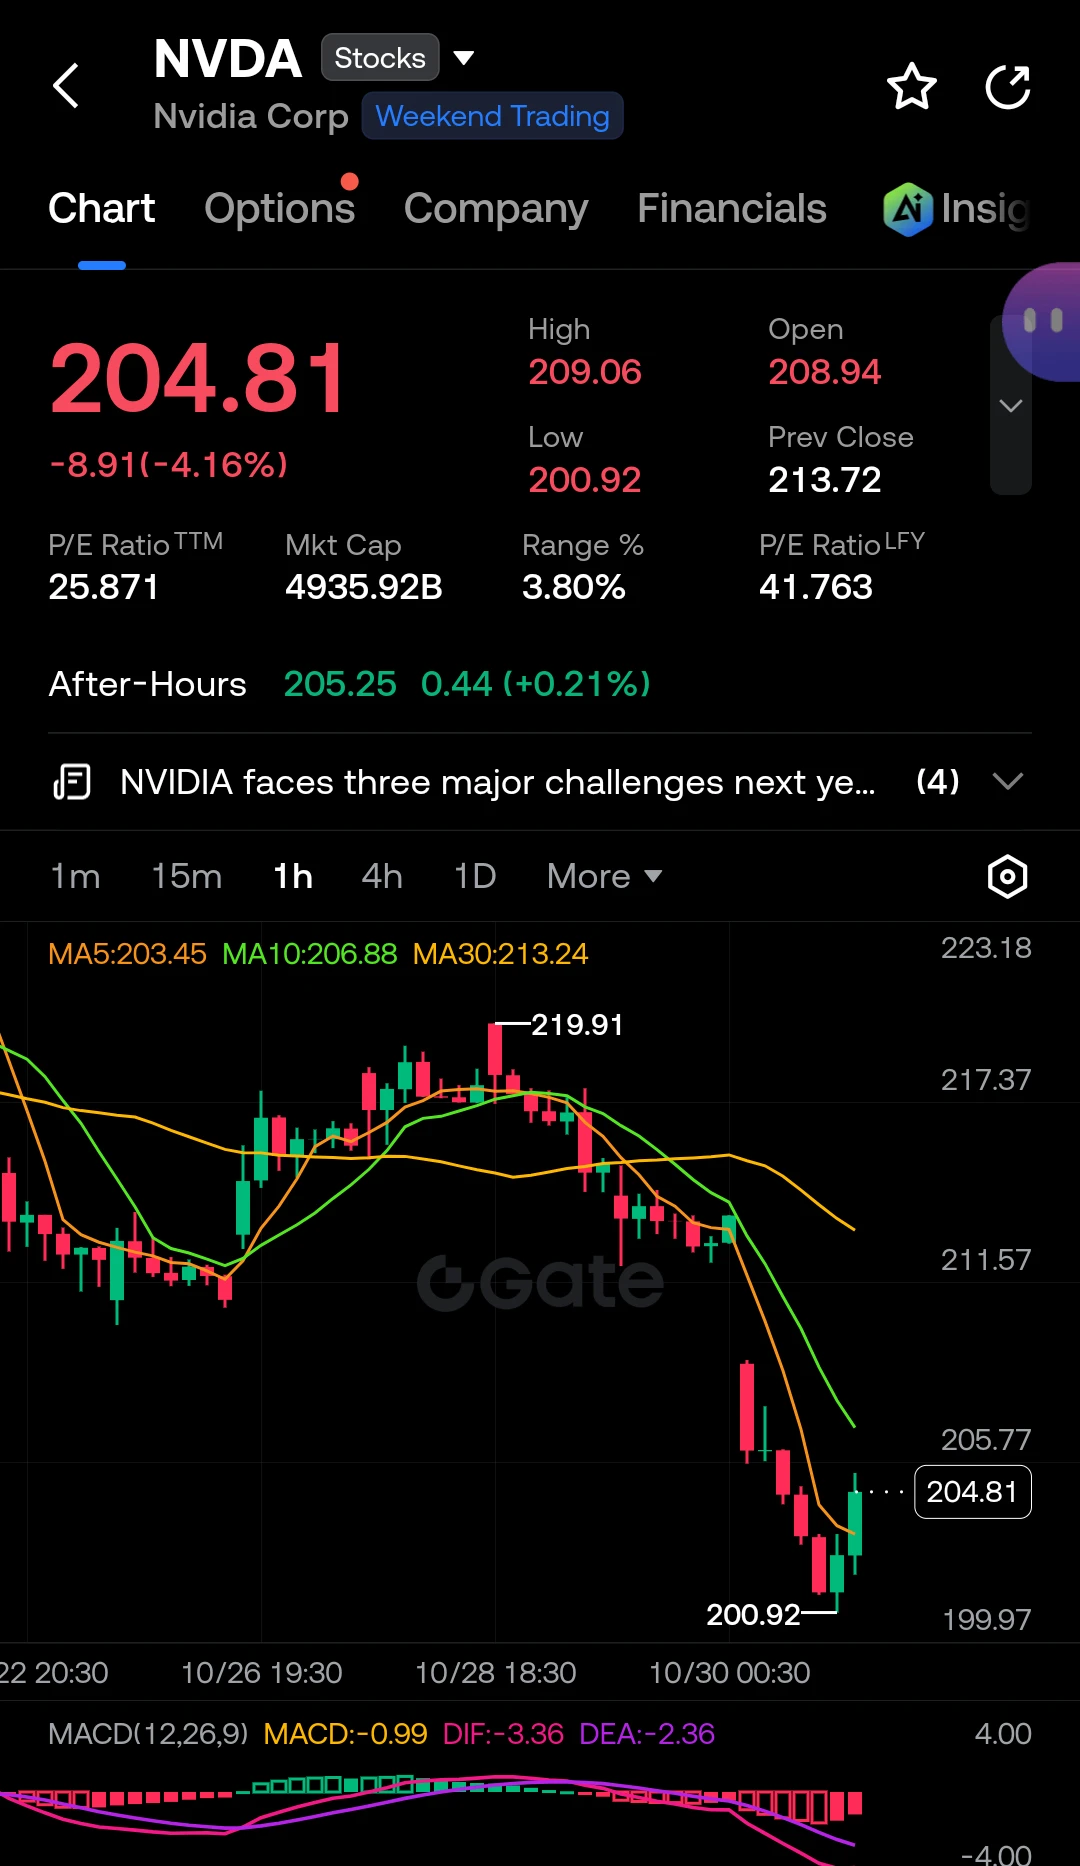
$NVDA ‌🟢 Why did Nvidia go to therapy? Because it couldn't handle the extreme voltage of its own bearish breakdown! 🔌📉
NVDA (Nvidia Corp) – Stocks / Weekend Trading 📊
Bias: Strong bearish trend on the 1H chart (trading below MA10 and MA30), but showing signs of a short-term oversold bounce off the 200.92 low. Expect a retest of lower support or a rejection at the moving averages. ⚠️
---
📈 Long – Oversold Bounce
Entry: 203.50 – 204.80 (Current level + MA5 support at 203.45)
TP1: 206.88 (MA10 resistance)
TP2: 209.06 (24h high)
TP3: 213.24 (MA30)
SL: 200.50 (Below 24h low)
📈 Long – Breakou
post-image
NVDA-4.16%
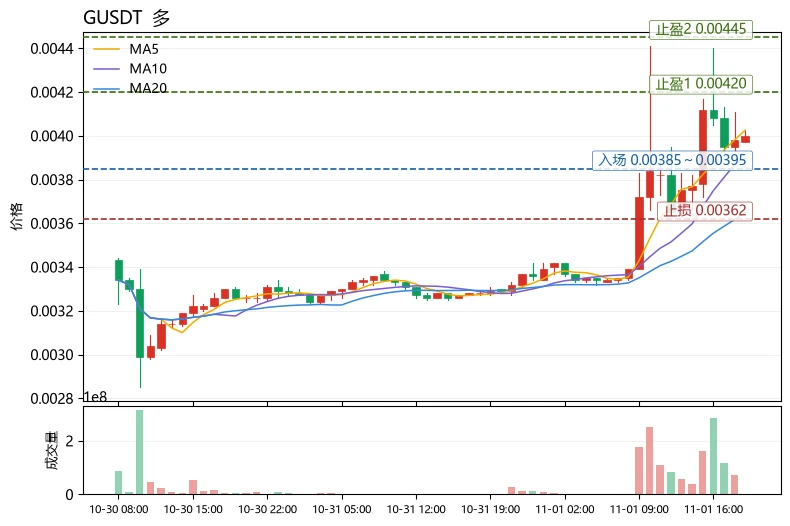
The most unusual detail in today's market action isn't the gain, but the funding rate: $G is up 21.95% over 24 hours, yet the funding rate is -0.3413%. Shorts are paying to hold their positions, while the price is hovering near the upper Bollinger Band at 0.0042064. This “rising price, negative funding” combination usually means the short squeeze is not over, but it also shows that longs are getting crowded—RSI at 68.7 is nearing overbought territory, the 30-candle range is 29%, and volatility is high enough to easily trigger stop-losses in either direction. At this point, the risk in chasing
post-image
SUI-1.05%
TRX+0.42%
Load More

Join 40 M users in our growing community

⚡️ Join 40 M users in the crypto craze discussion

💬 Engage with your favorite top creators

👍 See what interests you

Trending Topics

BTC大跌

451.59k Views39.79k Discussing

$BTC briefly fell below $77,000 and remains under pressure around the $77K zone, with its 24-hour decline still above 4%. With risk appetite weakening and Fed uncertainty rising, where is the next key support after losing $80K?

IntelBeatsEarningsButStockPlunges

39.64k Views1.01k Discussing

StrategySTRCNears100ParValue

47.8k Views4.19k Discussing

View More