Square
Following
Hot
News
Profile
Share your thoughts
placeholder
Article
Altcoins Under Pressure! Is Bitcoin Dominance Set to Rise?
live-cover
LIVE2,093
$ZK Up 40% in seven days, with open interest more than doubling as longs piled in and pushed prices higher. It surged to the 75th percentile of the seven-day upper range—the more people pile in, the more dangerous it gets. This kind of rally is a bull trap, with nothing but bagholders waiting above. The more longs push, the more precarious it becomes. Don’t wait for the waterfall to arrive before running—the shorts are closing in😤
post-image
ZK+5.04%
Yesterday I suggested buying XPL, and looking at today, it was almost exactly the bottom. After the PPI data came out and the bearish news was priced in, it immediately V-reversed. Still, pay attention to coins with discernible patterns. Keep following #美国9月PPI大超预期
XPL+6.63%
A scrap-collecting beggar sponsors a girl who cannot afford to go to school, and that is called positive energy.
But you cannot ask why he collects scrap or why she cannot afford to go to school.
If you ask, you are negative energy.
post-image
$ANTHROPIC Added to my long position again. The current price is below 2000, which is practically like picking up money for the long term. Applied for an IPO listing in June this year, with a market valuation reaching $2 trillion.#美国9月PPI大超预期 #作手分析
post-image
ANTHROPIC+2.33%
  • 1
Why did every cryptocurrency crash at exactly the same time?
This isn’t natural selling; it’s pure manipulation.
$BTC ‌
post-image
BTC+0.61%
The guy on my list who has been watching ETH’s yearly moving average has kept an eye on it for more than half a month—the wick that stabbed down to 2318 yesterday morning actually prompted him to place an order. Those still holding long positions are probably feeling a bit panicked right now.
I wrote down his rules: after the three-leg decline, treat it as the C he mentioned and place an order below; the stop-loss is set at just one level—the low of yesterday’s wick.
I checked that wick: the 1-hour candle plunged 100 points, with volume 8 times that of the previous hour; he hasn’t fired all hi
post-image
ETH+0.89%
Do you have an update to this touching story?
post-image
Indian retail investors are still pouring money in, but trading frequency has declined, and market share has also been taken away. Angel One’s earnings report can be summed up in one sentence: client funds grew by 40%, yet orders fell nearly 10% month over month—a typical high-level stagnation on the monthly chart. When open interest in derivatives hits a record high, it is often the eve of a major market shift. What’s your view?
post-image
#JapanAndKoreaStocksPlunge Japan and Korea Stocks Plunge: Global Markets Face a Major Technology Sell-Off
Global financial markets experienced a sharp wave of selling on October 15, 2026, as Japan and South Korea witnessed significant stock market declines. The sell-off was primarily driven by rising concerns about persistent U.S. inflation, the possibility of additional Federal Reserve interest rate hikes, and growing uncertainty surrounding the sustainability of the artificial intelligence (AI) investment boom.
The sudden downturn highlighted the vulnerability of technology-heavy Asian marke
post-image
October 15, 2026, 8:30 AM Morning Market Analysis
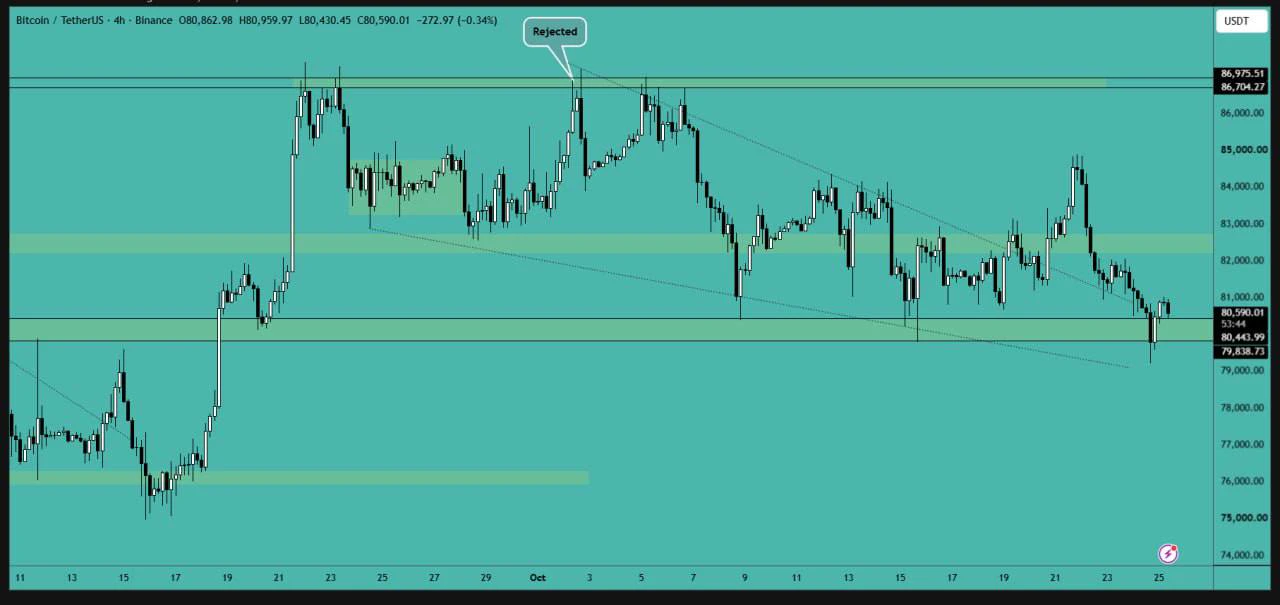
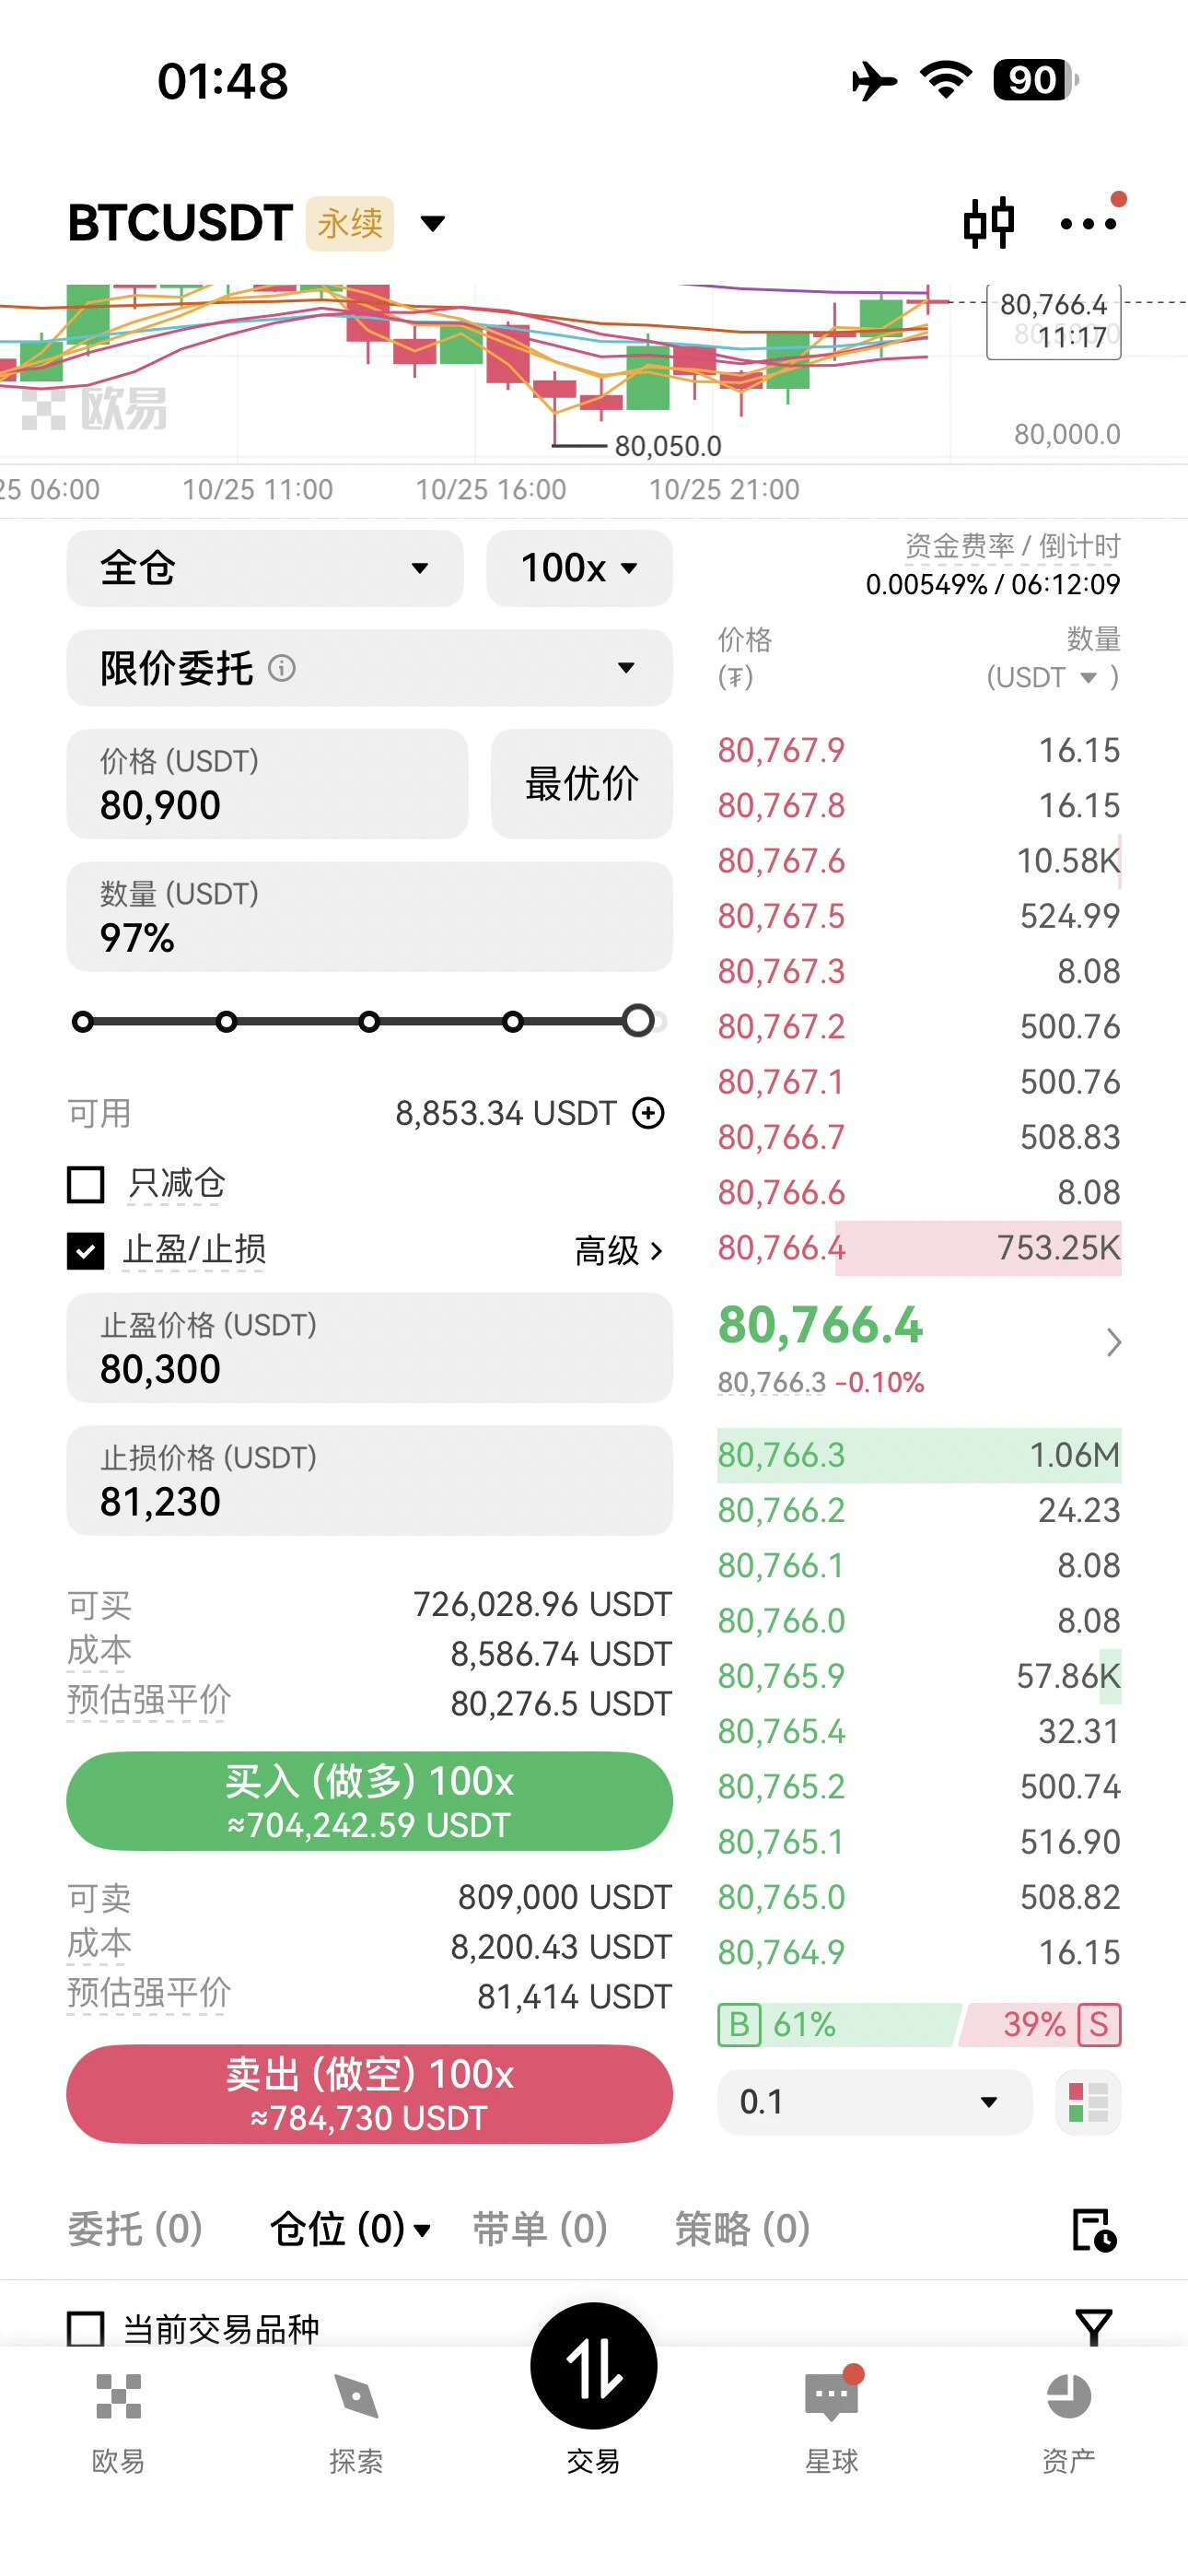
Recap: Last night was thrilling. How are everyone's positions? Those who carefully read yesterday's morning analysis made profits. Yesterday's market reversal was very fast; BTC reached all the analysis targets and levels I gave yesterday, with the market hitting a low of 79732. I added to my position. Those currently holding positions can set a breakeven stop-loss or lock in a small profit. Make sure not to incur losses. I am currently holding gold; ETH can refer to BTC.
Analysis: BTC: I currently have a long position and have set a break
BTC+0.62%
GLDX+0.28%
PAXG+0.36%
ETH+0.83%
10.16 Gold Morning Analysis
Last night's U.S. employment and retail data exceeded expectations, weighing on gold and silver. Bullish momentum weakened, gold came under pressure at 4177 and retreated, ending the rebound and entering a high-level correction.
The rise followed by a retreat shows that this rebound was merely a corrective recovery within the downtrend; the broader trend has not reversed. 4180 is strong resistance on the hourly chart. Expect range-bound adjustment this morning; do not chase the decline, but wait for a rebound to face resistance before entering a position.
Strategy:
post-image
XAUT+0.40%
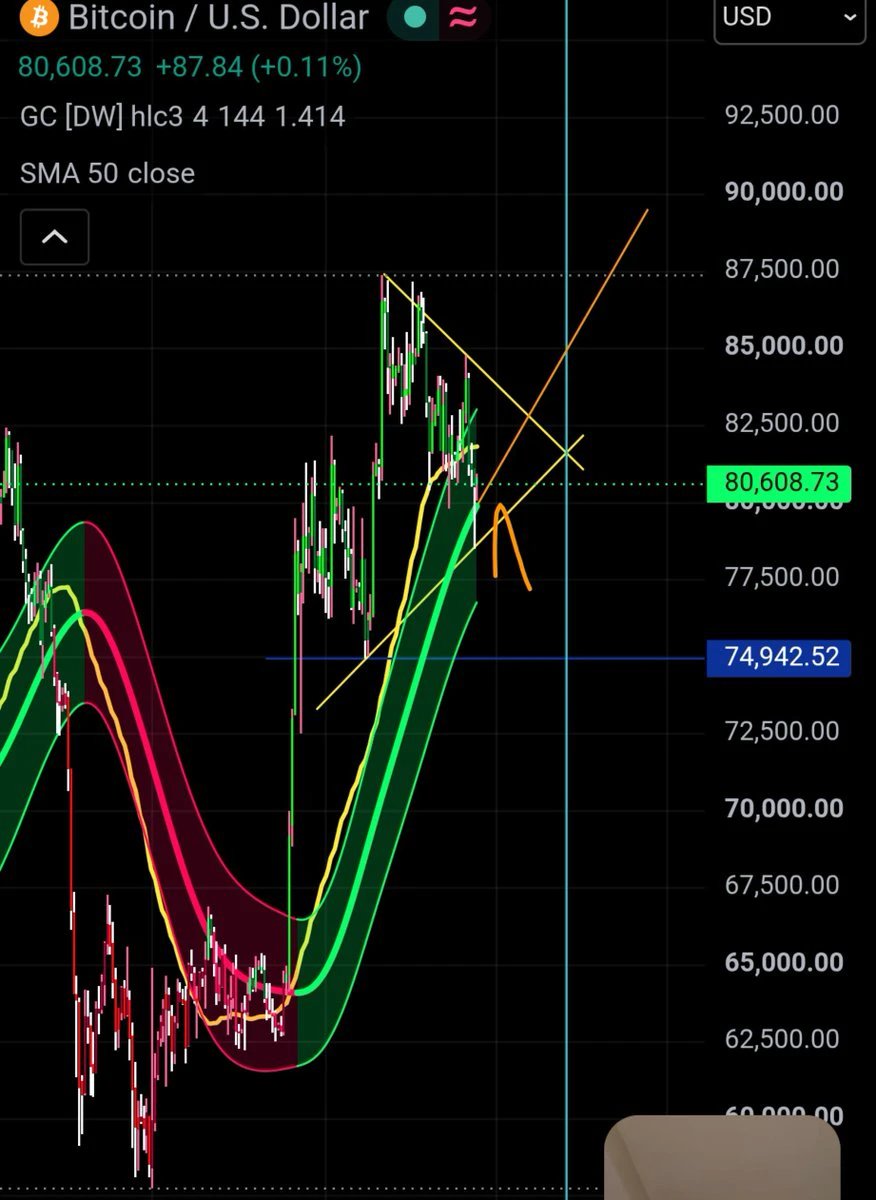
$BTC 10.16 Bitcoin Trend Analysis
Two expected Bitcoin price movements:
1. White line: The Wave 2 correction is complete, and the Wave 3 rise begins directly.
2. Yellow line: Still in the Wave 2 correction’s Wave B rebound, followed by a Wave C decline.
Both are possible, and either scenario includes a rebound and rise.
It is currently recommended to continue holding long positions, then decide on subsequent operations based on the rebound’s height and strength.
Risk disclaimer: This is only an analysis of market structure and does not constitute any trading advice.
#BTC走势分析 #Bitcoin Trend Ana
post-image
BTC+0.62%
Yesterday, I sold many ETH forward put options! I think the bull market will continue; this is just a pullback! #美国9月PPI大超预期
ETH+0.89%
The demand area looks promising for a price rebound.$SNDK ‌
post-image
SNDK-0.56%
US Initial Jobless Claims
live-cover
LIVE1,576
I’ve turned off the gainers and losers ranking for $ZRO for now, and what remains on the chart is actually just one question: $ZRO’s strength is still intact, but the crowding is already plain to see.
$ZRO is currently at 2.177, up 14.28% in 24 hours. The 1-hour support is 1.8, resistance is 2.208, and current volume is 0.72 times the average volume of the past 20 candles.
My view for now is this: I acknowledge that the trend is strong, but what matters next is not how much higher it can surge, but whether buyers step in during the first pullback. To the upside, merely touching 2.208 does not
post-image
ZRO+14.64%
#每周来晒
When I look at inflation data, I don't focus only on whether the number goes up or down. I want to understand what is driving the move, how the Federal Reserve might interpret it, and what the market could do next. September's US PPI gives us a good reason to look beyond the headline.
US producer prices rose 1.3% month over month in September, significantly above the approximately 0.6% increase expected by the market. Annual producer-price inflation accelerated to 6.3%, compared with 5.6% in August. That's a meaningful surprise, and it puts the inflation outlook back under pressure.
The
post-image
BTC+0.62%
GAS-0.36%
  • 2
Long positions
1. Place a long order at 2435, stop-loss 2415, target 2480
2. Place a long order at 2400, stop-loss 2380, target 2450
3. Place a long order at 2325, stop-loss 2300, target 2380
Short positions
1. Short near 2455, stop-loss 2475, target 2410
2. Place a short order at 2485, stop-loss 2505, target 2440
3. Place a short order at 2510, stop-loss 2530, target 2460
4. Chase the short if it breaks below 2375, stop-loss 2395, target 2320
$ETH ‌#美国9月PPI大超预期 #韩林博士受邀牛津大学辩论社演讲 $BTC ‌
ETH+0.89%
BTC+0.61%
Load More

Join 40 M users in our growing community

⚡️ Join 40 M users in the crypto craze discussion

💬 Engage with your favorite top creators

👍 See what interests you

Trending Topics

USSeptemberPPIBeatsExpectations

91.35k Views1.9k Discussing

US September PPI came in at 6.3% YoY, well above the 5.3% market expectation, pointing to renewed producer-side inflation pressure. Weekly jobless claims were 199K, broadly in line with forecasts. Could hotter inflation further reduce room for rate cuts, and what does it mean for $BTC, US stocks, and gold?

DrLinHanSpeaksAtOxfordUnion

135.63k Views1.86k Discussing

KOSPIJumps3.3%

47.29k Views1.88k Discussing

View More