Share your thoughts
placeholder
Article
Why $SUI /USDT’s “safe” range is the most dangerous place to be right now.

$SUI /USDT - SHORT

Trade Plan:
Entry: 0.7883 – 0.7931
SL: 0.8140
TP1: 0.7733
TP2: 0.7616
TP3: 0.7442

Why this setup?
- 1D trend is *range*, but 4h bias flips SHORT—that’s a classic bull trap setup.
- RSI 15m at 38.64: momentum already cracked, but price hasn’t followed yet (lag = your edge).
- Entry ref 0.7907 with TP1 at 0.7733 = 2.2% move, but ATR 1h is only 0.0097—tight stops mean most longs get shaken before the drop.
- “Why now?” Because 0.7931 (entry_high) is the last wall before the slide; if we lose
post-image
SUI+1.03%
This trend doesn’t even require me to think—the account is partying on its own.

During the early-session sell-off, while everyone else was running, I noticed that every rebound in $PUMP came with declining volume. The price-volume coordination was terrible. The pressure above was extremely heavy, and the rebound was clearly weak. This trend looked exactly like it was handing out short-position red envelopes.

Without hesitation, I chased the short at 0.004390. I had already been waiting before the market fully started moving—the entry point I was waiting for was precisely this kind of low-v
post-image
PUMP-5.20%
DOGE+6.04%
ZEC+16.22%
$ZEC $UNI $SUI #doge
#furry
post-image
ZEC+16.13%
UNI+10.29%
SUI+1.00%
DOGE+6.07%
Thanks for the dip on $PURR
One clip candle for 100k is insane but the chart still holds.
See you at 100mn
post-image
₿ Why Timing Bitcoin Can Be So Difficult
Bitcoin’s history shows an interesting pattern: a large share of its yearly gains has often come from just a small number of trading days.
That creates a problem for market timers.
Missing only a few of Bitcoin’s strongest days can significantly reduce overall returns. Meanwhile, consistently identifying those days in advance is extremely difficult.
The takeaway isn’t that Bitcoin always goes up.
It’s that trying to perfectly time the market can be much harder than it looks. 👀
Historical performance is not a guarantee of future results.
#Gate60MillionU
post-image
BTC+0.21%
  • 6
  • 1
Today The most token #Gainers on
1️⃣ #PEZ | @search
2️⃣ #Sue | @Sue_BSC
3️⃣ #HODL | @hodl2013
4️⃣ #BabyAsteroid | @BabyAsteroid_BB
5️⃣ #AKE | @akedofun
6️⃣ #SANTACOIN | @Santahoodcoin
7️⃣ #XST | @XSolutAI
8️⃣ #PIPEDOG | @pipedog_
9️⃣ #BULLSHIT | @bullshit_ansem
🔟 #AP | @Artificialypepe
#Fourtis #Gainers #Memecoin
post-image
AKE-18.25%
PIPEDOG+57.90%
MEME-0.69%
No operations, no analysis, just sheer luck—this performance is embarrassing even to talk about. 🙈

It’s not that I didn’t look at the chart at all. It’s just that while everyone else was still waiting and watching, I stared at the sell orders for $VVV for a while—the sell orders were being eaten away layer by layer, leaving only buy orders pushing upward. This kind of capital movement is the most direct evidence: buying pressure is strengthening, and the trend could start at any moment. I didn’t hesitate, opened a long position directly, set my protection, and went off to do other things.
post-image
VVV-3.62%
BNB+0.85%
BTC+0.21%
$RAY Signal】After a volume-backed 1H surge, the pullback holds; the bullish trend remains intact
$RAY The 1H high of 1.1999 met resistance and pulled back. Selling pressure currently dominates the order book around the current price of 1.0981, with buyer order depth at 0.48, indicating weak short-term support. 4H MACD bullish momentum continues to expand, while the BOLL upper band at 1.0472 has been breached. After trading outside the upper band, the price has returned inside the channel, constituting a normal correction after a strong move. RSI is 75.55 on 1H and 77.87 on 4H, both at elevate
post-image
RAY+31.48%
BTC+0.17%
ETH+1.62%
SOL+2.77%
Feels pretty good
Blocked dozens of people
But gained nearly a thousand followers
You feeling it, bro?
post-image
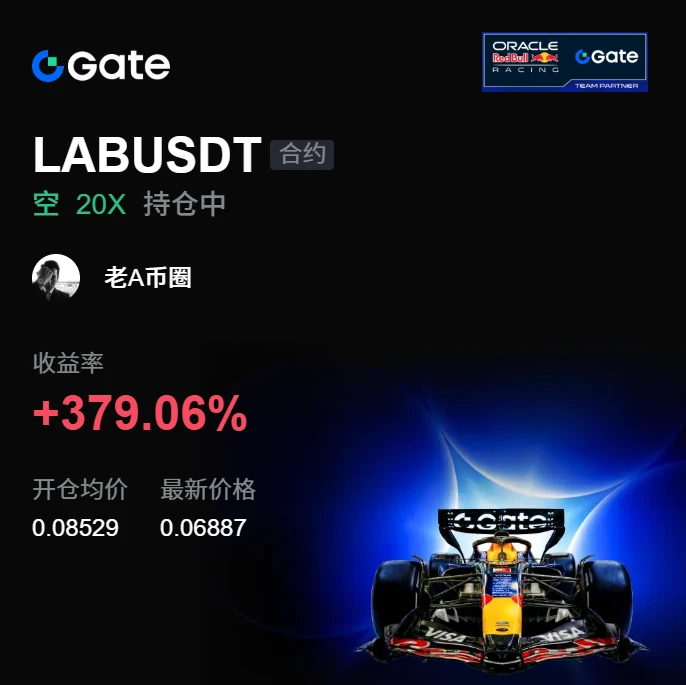
Enjoy it, but don’t mess up your position management. I’ll first close out 70% and pocket the bulk, then move the protection level up on the remaining 30% and place it around breakeven. If it keeps falling, I’ll let the profits run; if it rebounds, I won’t give those profits back.

$LAB $SNDK
post-image
LAB-3.75%
SNDK+1.49%
Samsung Securities’ Quantitative View of the Memory Market
post-image
Well it's my birthday again. Happy birthday dude. Zaheer.
post-image
Up over 21 percent in the 24 hours, $FLOCK is making major moves on the chart and with the utilities.
Cross-chain integration with Chainlink is a big-time bonus for $FLOCK. This happened in August of 2026. Plus, the partnership with Red Hat has been another positive prize.
This is a very solid crypto project, but its very still young. The gains have been very promising for holders.
Heck, they are not complaining at all. They are singing, We are Flock. They also launched FOMO, which stands for FLOCK Open Model. This allows people to trade, launch, and much more.
FLOCK+44.50%
LINK+4.13%
Trading Summary for the First Week of September
This week saw a constant stream of news, with the market pulled back and forth.
In a highly volatile, range-bound environment, stubbornly staying bullish or bearish can easily lead to losses. Prioritize following market signals and trade the swings.
Trading does not require perfection on every trade; focus on execution and risk management, and wait patiently for next week’s opportunities.$BTC $ETH #美国8月非农超预期
post-image
ETH+1.67%
BTC+0.21%
Woke up and drank a bag of milk. I always thought it was Mengniu, but it turns out to be New Hope? Huaxi, Hope Group?
How does it compare with Mengniu and Yili—which one is better?
post-image
[New Streamer] Whales Move in Sync!
live-cover
LIVE1,895
Let’s talk about Dogecoin again. I’m still quite bullish on it—looking at the monthly chart, going all in with half your position in spot is perfectly fine. On a longer timeframe, just buy DOGE below 0.1 whenever you have money. Not asking for much; 0.3 still seems achievable. $DOGE
post-image
DOGE+6.07%
$BTC Signal】Bullish absorption + order-book imbalance, lie in wait in the sniper range
$BTC The order-book buy-side ratio is 2.87x, with a 48.25% depth imbalance. Buy orders are concentrated below, but the price has not broken below EMA50. The 1H MACD histogram has contracted continuously, with bearish momentum not yet spreading. The funding rate is 0.0020%, OI is stable, and short-squeeze conditions are not yet fully mature. The 4H Bollinger Bands are tightening, with range-bound movement awaiting a breakout.
🎯Direction: Long
⚡Entry/limit orders: 79630-79800, scale in for the sniper entry
post-image
BTC+0.21%
FET USDT LONG TRADE SETUP
FET is currently showing an interesting structure after price moved into a tight consolidation area. The chart is forming a compression between the descending resistance and rising support, and the breakout zone is now very close.
My planned entry is around 0.1620 with 7x leverage.
Entry
0.1620
Stop Loss
0.1531
Targets
Target 1 0.166
Target 2 0.173
Target 3 0.177
Final Target 0.184
The most important thing in this setup is not just entering the trade. We also have to follow proper market rules and risk management.
Our first focus will be the 1:1 risk reward level. Onc
FET+0.18%
Load More

Join 40 M users in our growing community

⚡️ Join 40 M users in the crypto craze discussion

💬 Engage with your favorite top creators

👍 See what interests you

View More