Square
Following
Hot
News
Notifications
Profile
Share your thoughts
placeholder
Article
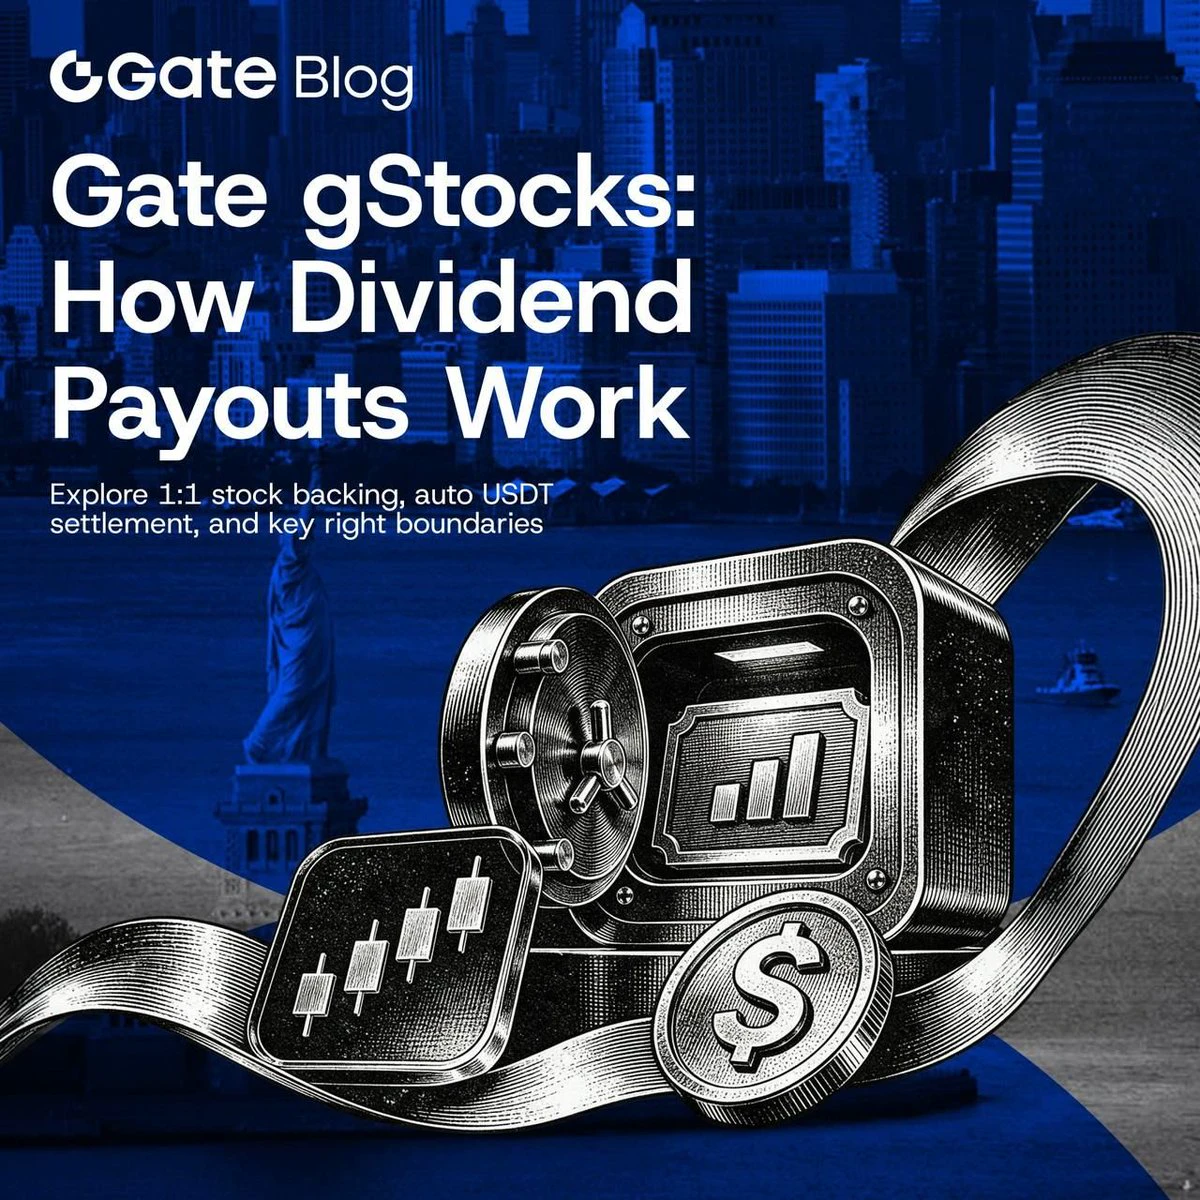
gate gstocks automatically credits eligible stock dividends in usdt, after a 10% withholding tax, with no manual claims required.
#GSTOCKS #DIVIDENDS $GATE
post-image
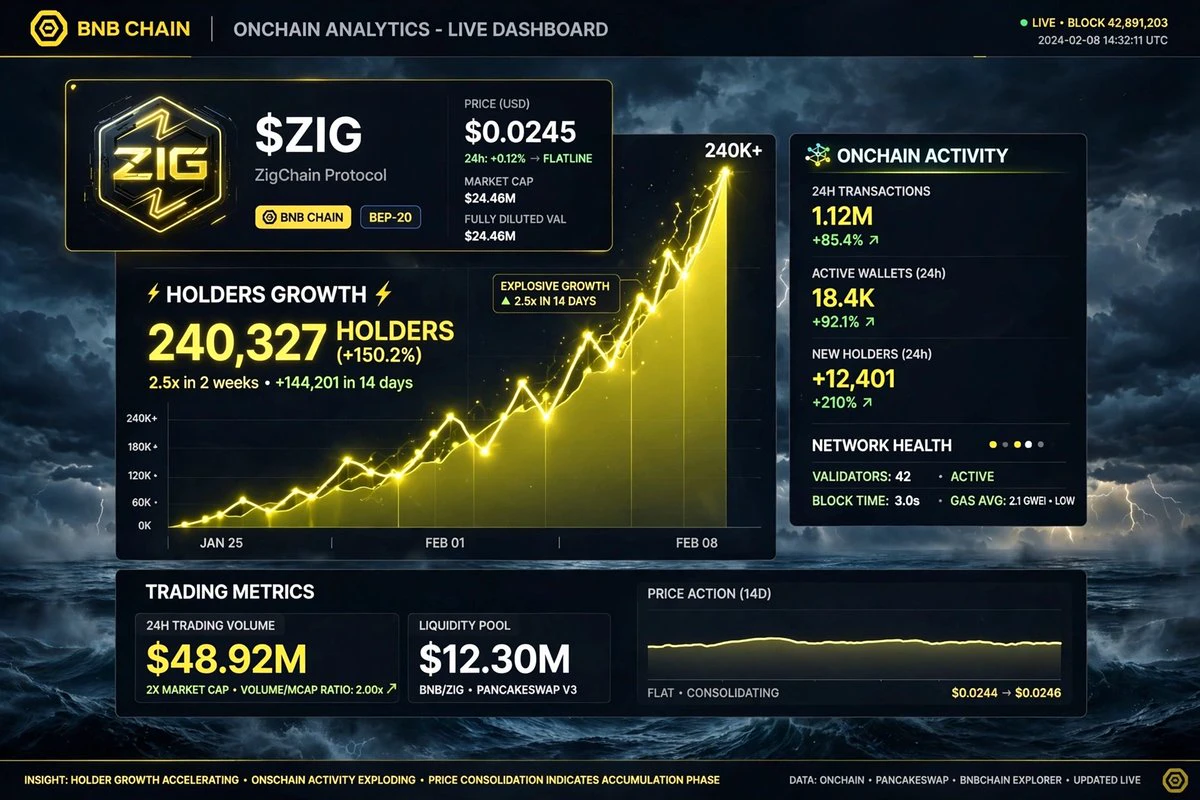
$ZIG is the calm before the storm 🌊
Everyone is looking at price.
Smart money is looking at onchain.
Holders: 240K+ on BNB Chain (+150% in 2 weeks)
Volume: 24h volume = 2x market cap
Let me translate:
People are not selling. They are positioning.
Price hasn't reacted yet. It usually does after this kind of data.
Stay asleep on $ZIG if you want. Onchain won't wait.
post-image
ZIG-8.79%
BNB-0.76%
Trenches
PIEVERSE
P
bade
b
PIEVERSE
0x0e...25a9
Market Cap
$.
Change
.
24h Vol
$.
Holders
.
FIONA
F
bade
b
FIONA
B34n...pump
Market Cap
$.
Change
.
24h Vol
$.
Holders
.
IDOL
I
bade
b
IDOL
0x3b...ab07
Market Cap
$.
Change
.
24h Vol
$.
Holders
.
Singularity
S
bade
b
Singularity
7R4M...pump
Market Cap
$.
Change
.
24h Vol
$.
Holders
.
CLAUDIA
C
bade
b
CLAUDIA
2j5S...W2ZM
Market Cap
$.
Change
.
24h Vol
$.
Holders
.
I changed my mind. I used to believe the saying, “After a drop this deep, the bottom can’t be far away.” $MMT Today’s low was 0.2113, down from 0.2783, a 16.65% drop, with turnover still at 162.4M. That’s not a small figure. It shows buyers are stepping in, but getting buried one batch at a time.
A deep drop doesn’t mean it’s the bottom; it only means sellers are still on the move. What really matters isn’t how much it’s fallen, but whether volume contracts after the drop and the price holds steady in a certain range. This move looks more like the car is still going downhill, with no brake lig
MMT-2.35%
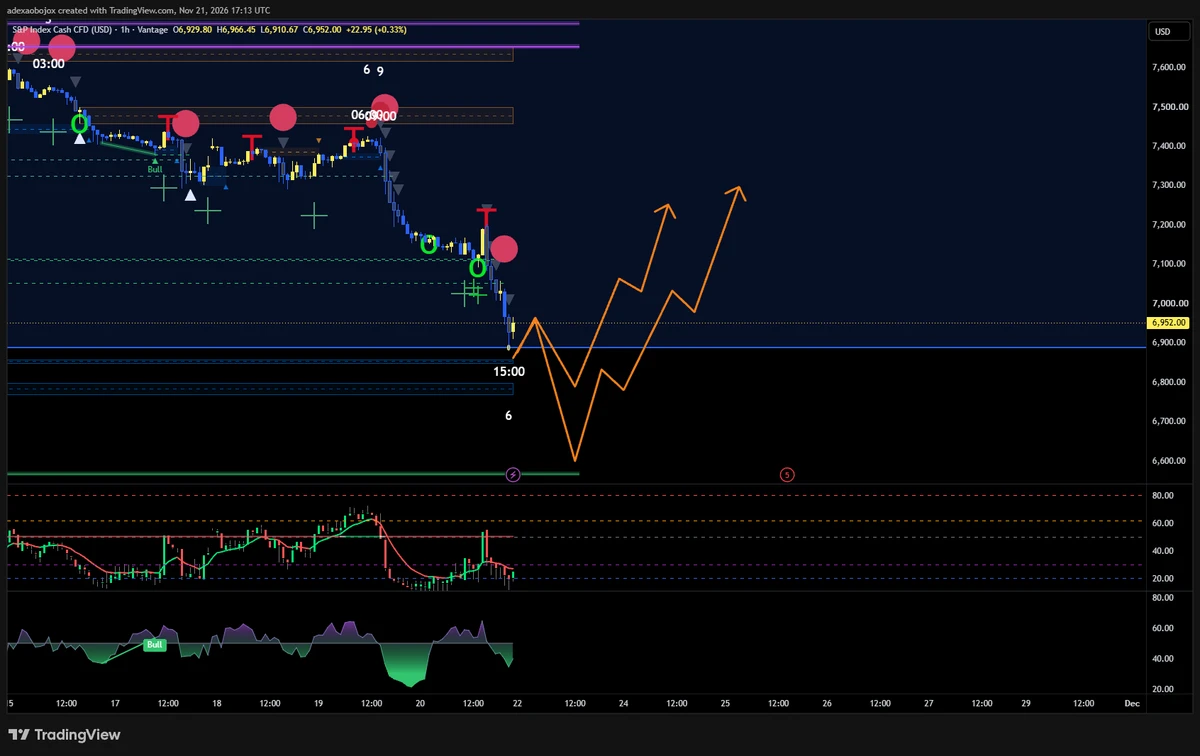
sp500 bottom will be in monday imo most likely all past 4 major dumps bottoms on mondays 6600-6800
post-image
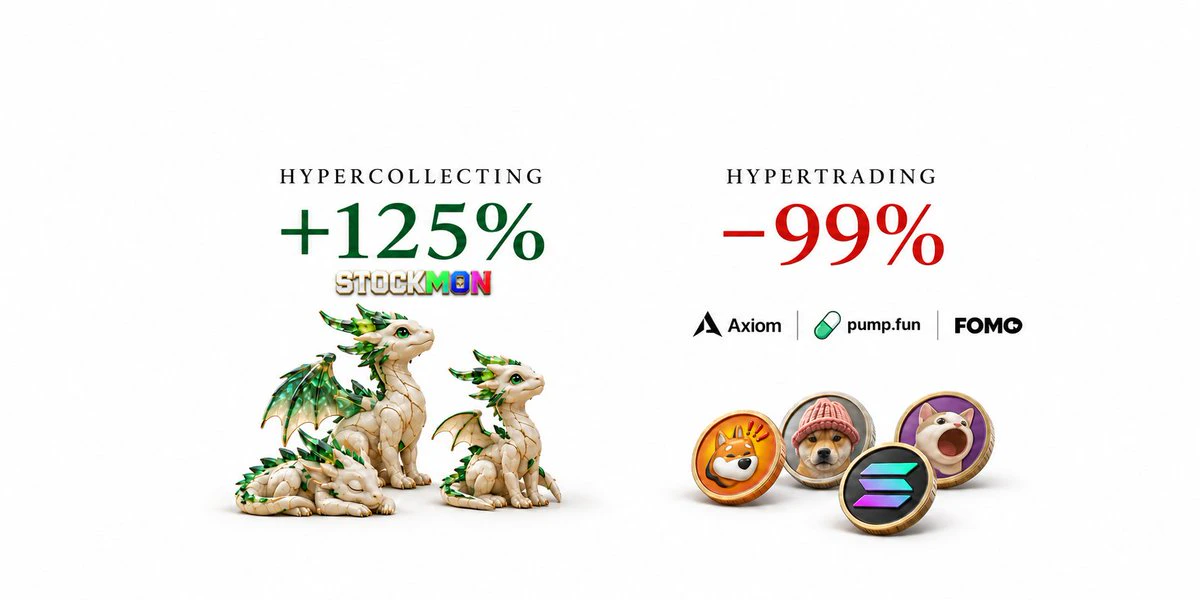
Hypercollecting >> Hypertrading
post-image
#GoldNears3500 #ShareWeekly

Gold at $3,547.80: Is the $3,500 Level Becoming a Strong Foundation for Recovery or Just a Temporary Pause?

Gold is approaching an important turning point as the precious metal attempts to stabilize after a significant correction. With the current spot price at $3,547.80 per ounce, the market is showing early signs of a battle between buyers looking for discounted opportunities and sellers who continue to benefit from the recent bearish momentum.

The latest 24-hour trading range provides an interesting picture. Gold reached a high of $3,581.80 and a low of $3,49
post-image
GLDX-0.40%
PAXG+0.37%
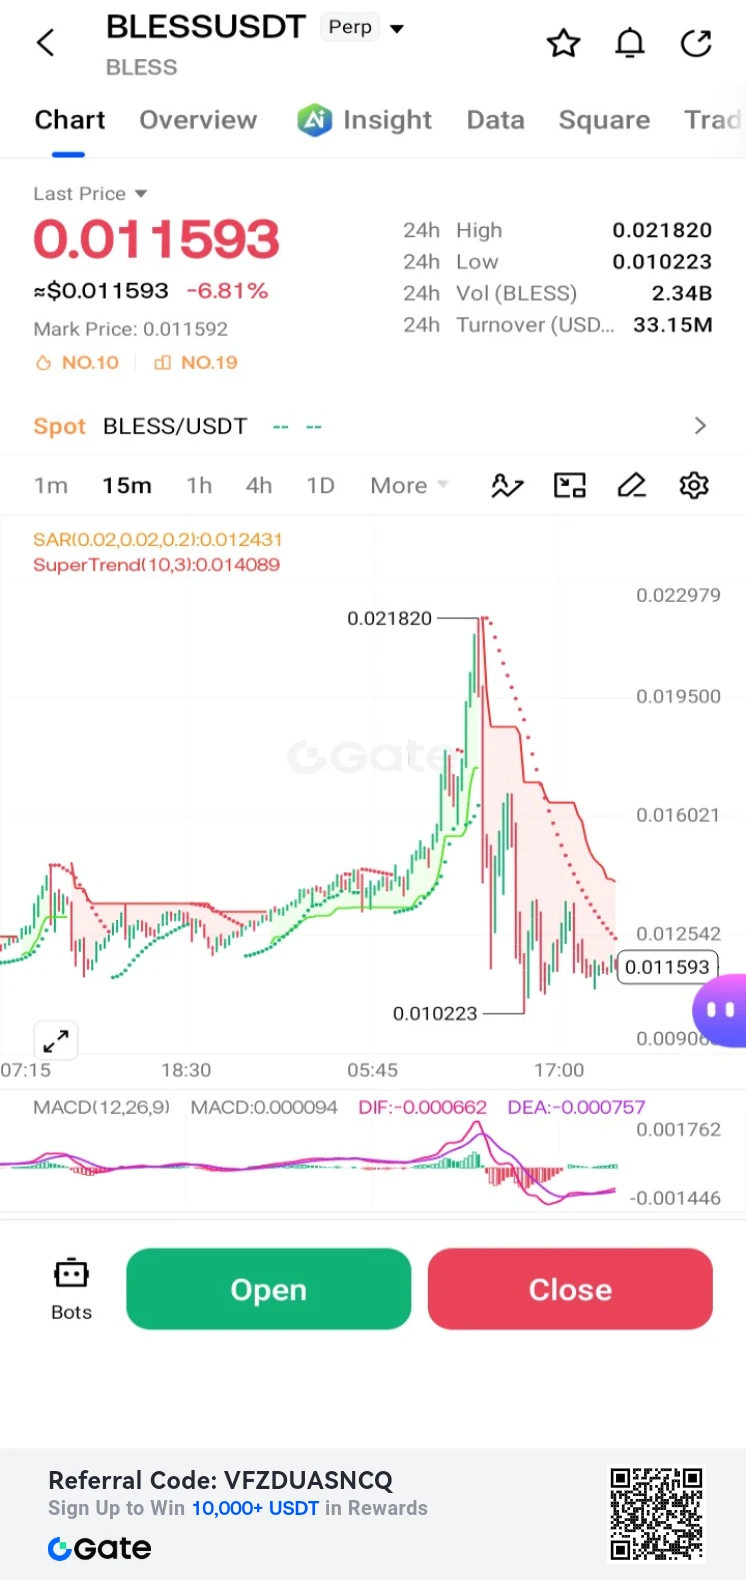
$BLESS /USDT Perp – "Post-Spike Retracement – Short"**
Trading Plan Short $BLESS
Entry: 0.011593
SL: 0.014089
TP1: 0.010223
TP2: 0.009000
BLESS is down -6.81% after rejecting the 0.021820 high. MACD is bearish; targeting a continuation down to the 0.010223 support.
post-image
BLESS-2.03%
Quickly go short on $PIEVERSE , entering with a sell at 3.4000 or 3.5000. First target: 3.2000; second target: 3.1000; third target: 3.00; final target: 2.9000++. Severely overbought conditions have emerged, and everyone is piling in to short aggressively. RSI has reached 91%
post-image
PIEVERSE+0.58%
$VVV I think this is a bullish timeframe. Buy at 23.25 and 22.15. Targets: 24.07, 24.70, 25.30. Stop loss: 21.20
post-image
VVV+0.37%
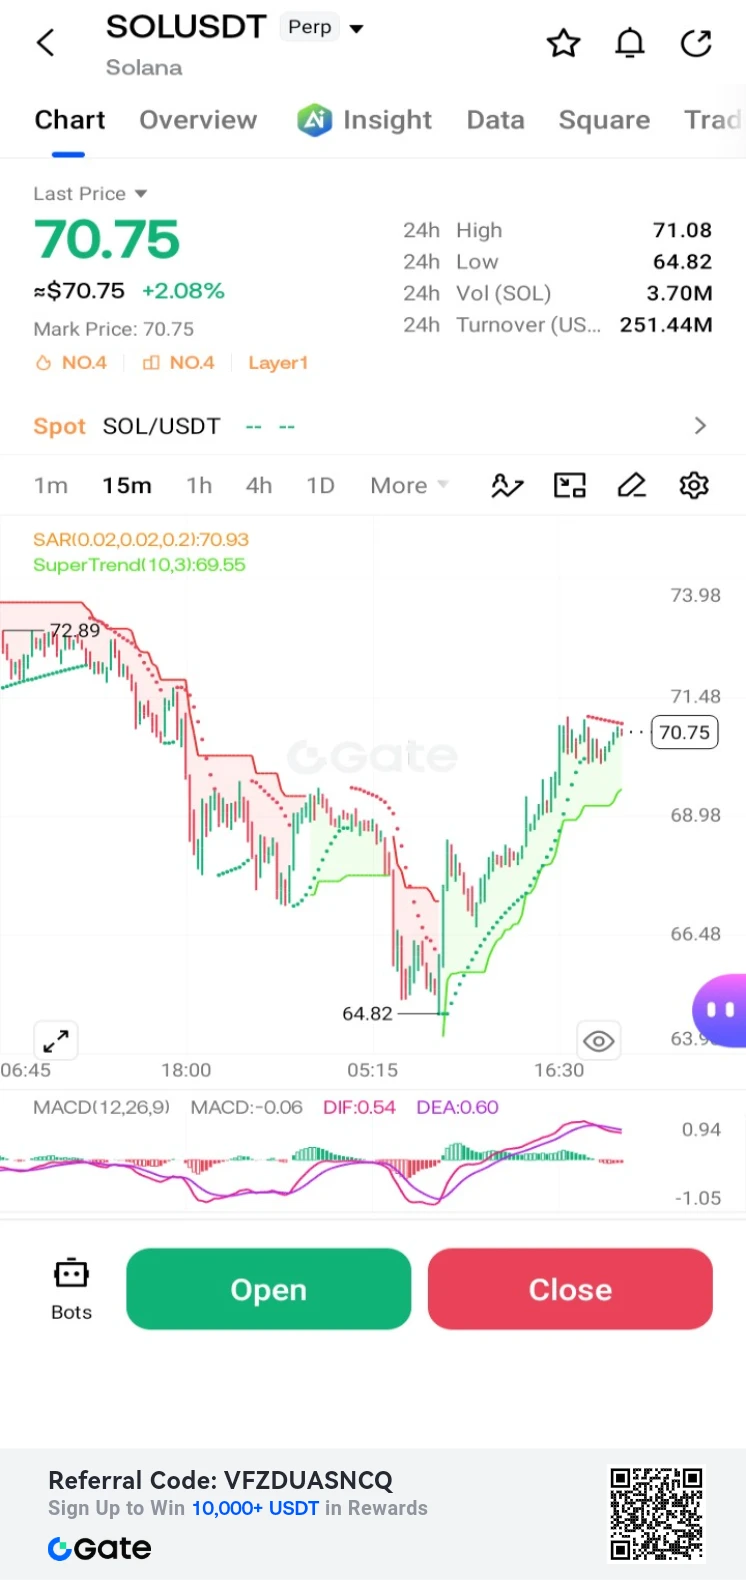
$SOL /USDT Perp – "Bottom Reversal – Long"**
Trading Plan Long $SOL
Entry: 70.75
SL: 69.55
TP1: 71.48
TP2: 72.89
SOL is up +2.08% after a strong bounce from 64.82. MACD is bullish; targeting a retest of the 71.48 local high.
post-image
SOL-0.74%
$BULLA Don't rush to exit; triple upside is still ahead.
I’ve already opened a long position in the BULLAUSDT perpetual contract, currently up +0.74USDT in unrealized profit, with BULLA up +12.90% at the current price.
The market has just started moving. Hold your position and wait for the main rally.
Risk warning: Contract trading carries extremely high risk. The above is only a record of my personal trading activity and does not constitute investment advice.
post-image
BULLA+10.92%
Look at this: The AI bubble “bursts” once every year, because:
1. U.S. investors are so used to “asset-light” businesses that they really can’t stand needing capex to make money
2. 99% of people who trade stocks don’t use it, so they can’t experience it firsthand
3. They’re used to looking at SaaS and expect steady monthly growth. They don’t understand that AI revenue is stepwise and pulse-driven. When it grows 60% in a month, they dream it can keep going for a long time; when it grows 10%, they say demand has hit a bottleneck
There’s no denying that recent liquidity shortages and panic over c
WMT+1.54%
$ARB $ARB Bullish: Price is hovering in the 0.1124–0.1129 range 👀If 0.112 holds: targets are 0.115, then 0.117. If it breaks below 0.110: this idea is invalidated. Waiting for buyers to step in. If this level fails, I’m out. - The 4-hour chart is at 0.113; this is a bounce attempt, so stop-losses are important. - BTC is short-term bullish, providing a tailwind for this idea. - Stop-loss distance: 2.4%; TP3 distance: 4.0%; if TP3 is reached, the risk-reward ratio is 1.7R. Long at 0.1124–0.1129Take profit 0.1144 / 0.1155 / 0.1172Stop-loss 0.1099Not investment advice. Please manage your position
post-image
ARB+1.17%
gate gstocks automatically credits eligible stock dividends in usdt, after a 10% withholding tax, with no manual claims required.

\#GSTOCKS #DIVIDENDS
$GATE
post-image
IN-6.89%
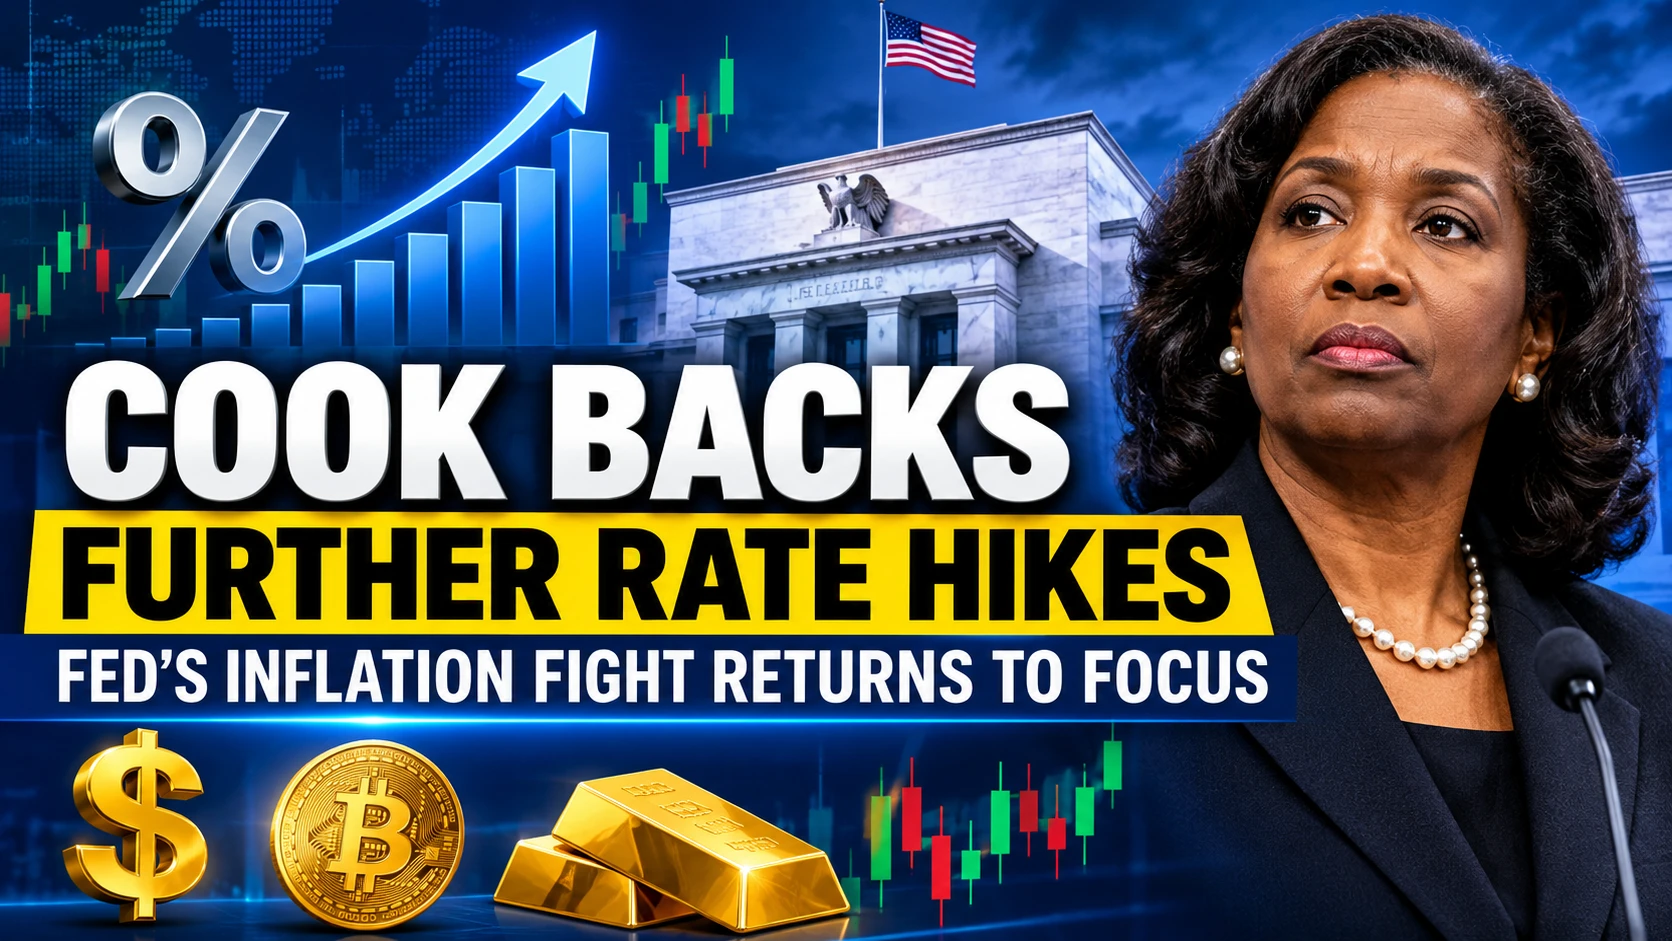
#CookBacksFurtherRateHikes
Cook Backs Further Rate Hikes: What It Could Mean for Global Markets and Crypto

The possibility of further interest rate hikes is once again drawing attention across global financial markets. Cook's support for additional rate increases highlights the ongoing challenge central banks face in balancing inflation control, economic growth, and financial stability.

For investors, traders, and cryptocurrency participants, this development deserves close attention because interest rate expectations can significantly influence market sentiment, capital flows, and risk app
post-image
BTC-5.94%
ETH-1.26%
USIDX-0.09%
$PIEVERSE Still moving along the ascending trendline! I’m waiting for pullback confirmation before looking for a long entry opportunity. Entry: 2.9500–3.0000 Take profit: 3.2000 Stop loss: 2.8500
post-image
PIEVERSE+0.58%
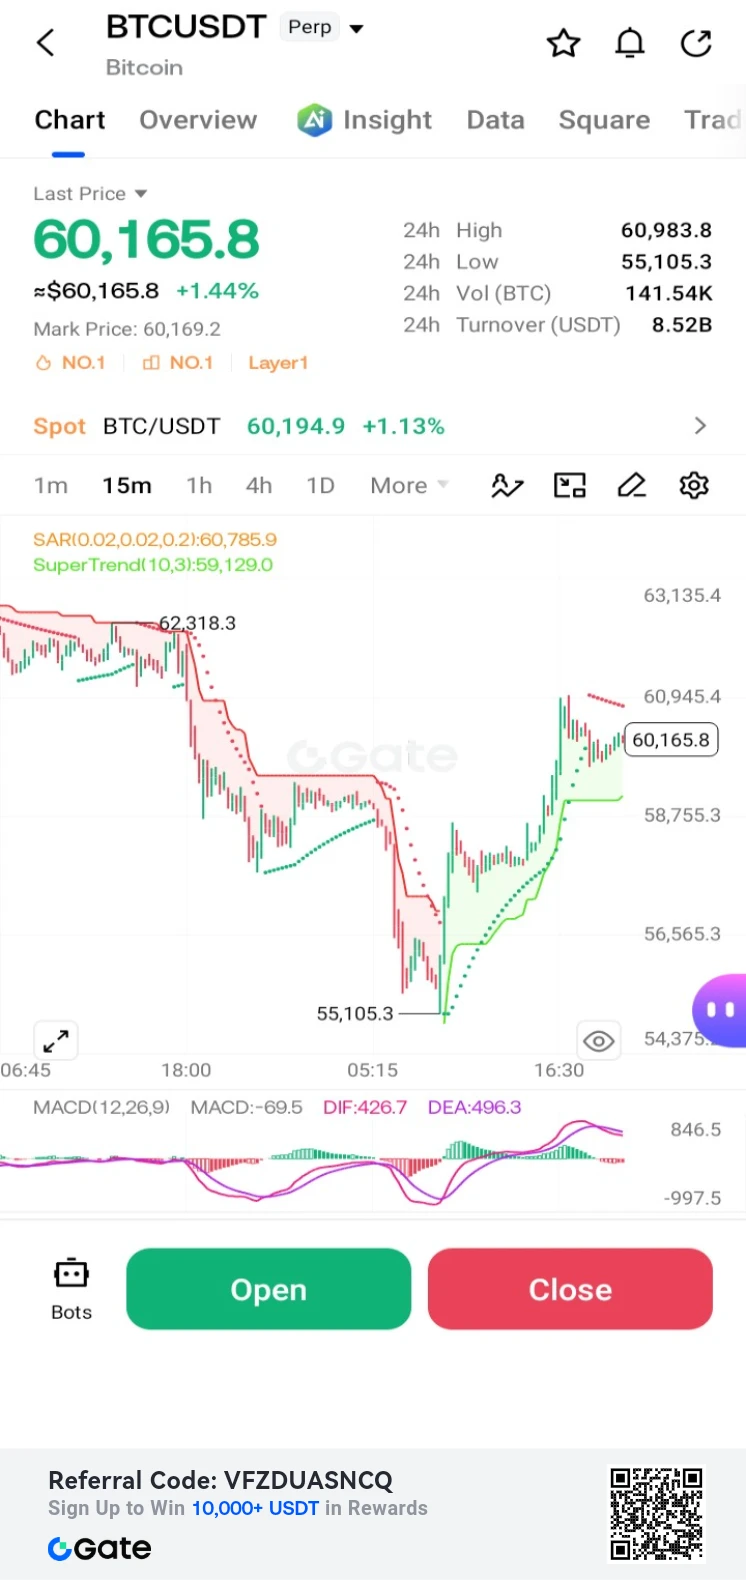
$BTC /USDT Perpetual – "V-Bottom Relief – Long"**
Trading Plan: Long $BTC
Entry: 60,165.8
SL: 59,129.0
TP1: 60,945.4
TP2: 62,318.3
BTC is up +1.44% and recovering from its low of 55,105.3. MACD is showing a strong bullish crossover, with the 60,945.4 resistance zone as the target.
#ShareWeekly.
post-image
BTC-0.65%
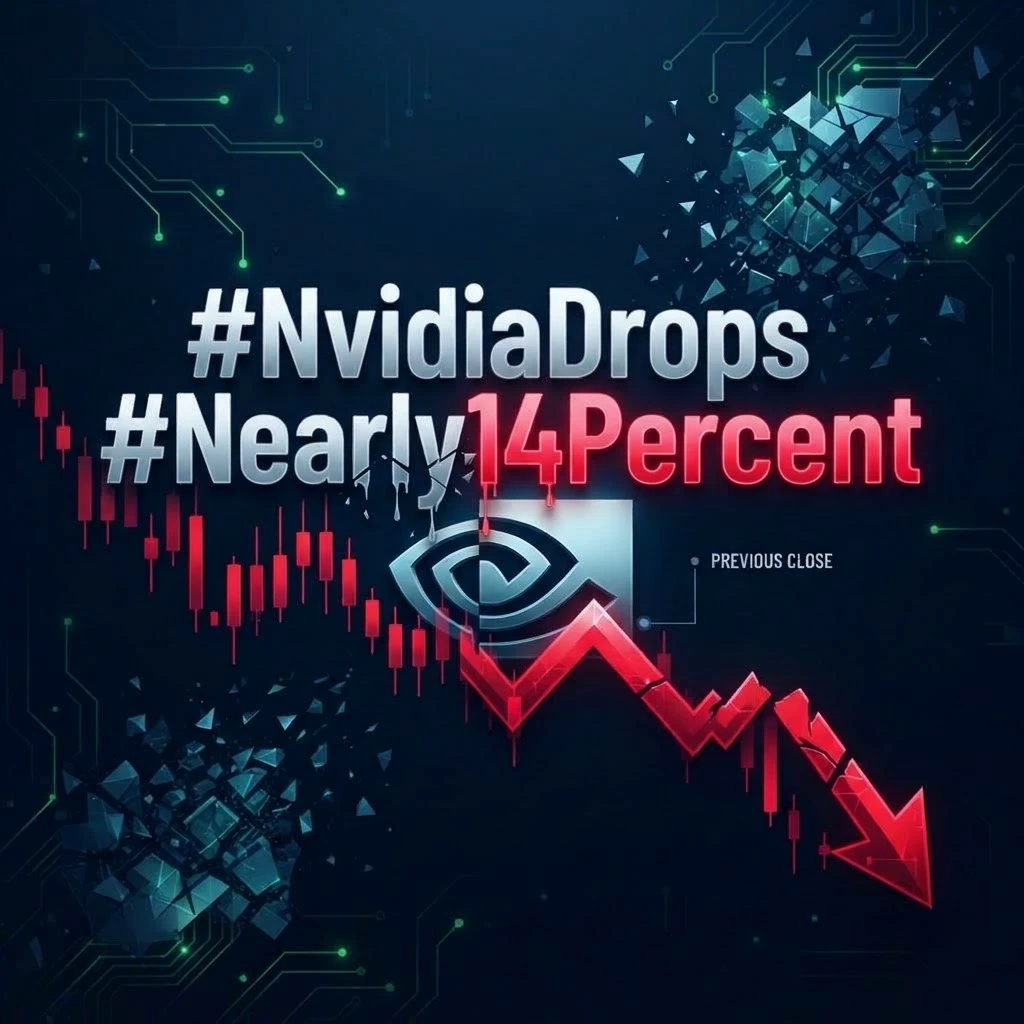
#NvidiaDropsNearly14Percent #ShareWeekly

NVIDIA at $128.45: Is This a Recovery Attempt or Just a Temporary Bounce After a Historic Sell-Off?

NVIDIA is entering a critical phase. After one of its most painful trading sessions in years, NVDA has moved back to approximately $128.45, showing some recovery from Friday's closing price of $125.53. However, the bigger question is whether buyers are finally returning or whether the market is simply taking a short break before another potential decline.

In my view, this is no longer just a technical correction. It is a combination of changing invest
post-image
NVDA-13.84%
BTC-0.67%
[New Streamer] Market Prediction
live-cover
LIVE1,029
BTC-0.67%
ETH-1.26%
SOL-0.77%
ZEC+1.16%
TAO+0.41%
Load More

Join 40 M users in our growing community

⚡️ Join 40 M users in the crypto craze discussion

💬 Engage with your favorite top creators

👍 See what interests you

Trending Topics

BTCBreaksBelow60K

2.1M Views29.9K Discussing

BTC fell below $60,000 on November 20 for the first time since July, alongside a tech stock selloff and broader pressure on risk assets. Will $60K become resistance, or can BTC quickly reclaim it? What price or volume signals would convince you that selling pressure is easing?

GateDirectIPOPhase3ANTAllocates92100Shares

782.8K Views4.9K Discussing

NvidiaDropsNearly14Percent

328K Views7.6K Discussing

View More