Square
Following
Hot
News
Notifications
Profile
Share your thoughts
placeholder
Article
After weeks of a quiet, gradual erosion, the price of gold appears to have suddenly plunged off a cliff. A look at the charts reveals that the price has retreated to the $3,500 level, marking a weekly decline of approximately 9%—its worst performance in 34 weeks. Moreover, this drop is merely the latest chapter in a massive, roughly 37% meltdown that gold has experienced since reaching a historic peak of over $5,500 in January.

So, why has this "safe haven"—a place we typically turn to during times of chaos—let us down now? The answer lies in a much larger and more ruthless struggle currently
GVZ+2.87%
XAUT+0.30%
PAXG+0.37%
XAU+0.38%
XAUUSD-2.40%
  • 11
  • 3
Hot hot hot 🚨🚨🚨$NAORIS continues to surge, with steady momentum—great for a short-term long trade. $PIEVERSE sees another strong rally during its Alpha campaign, making it a good opportunity to ride the long trend for a while. $VVV is still climbing strongly, so I’m hopping aboard the long trade and riding the wave. 📈📈📈
post-image
NAORIS+0.66%
PIEVERSE+0.58%
VVV+0.37%
Trenches
IDOL
I
bade
b
IDOL
0x3b...ab07
Market Cap
$.
Change
.
24h Vol
$.
Holders
.
PIEVERSE
P
bade
b
PIEVERSE
0x0e...25a9
Market Cap
$.
Change
.
24h Vol
$.
Holders
.
FIONA
F
bade
b
FIONA
B34n...pump
Market Cap
$.
Change
.
24h Vol
$.
Holders
.
Singularity
S
bade
b
Singularity
7R4M...pump
Market Cap
$.
Change
.
24h Vol
$
Holders
.
CLAUDIA
C
bade
b
CLAUDIA
2j5S...W2ZM
Market Cap
$.
Change
.
24h Vol
$.
Holders
.
EVAA | Long 🟢 | Bullish | 15m24h: +7.97% | Volume: 322.3M USDTLong rationale: Price above EMA200; EMA20/50/200 in bullish alignment; RSI14 at 60.6; MACD histogram positive; ADX14 at 18.5; volume at 0.69x the 20-candle average; trend pullback/continuation. Entry: 6.4238Stop loss: 6.26472Take profit 1: 6.62265 | Take profit 2: 6.74197 | Take profit 3: 6.90105For reference only; do not chase price. This strategy is invalidated if the stop-loss level is hit. Technical analysis strategy only, not investment advice.$EVAA
post-image
EVAA-0.49%
Towards the end of the week, something interesting unfolded in the markets. While stocks faced a sharp sell-off, the bond market moved in the opposite direction. The yield on the 10-year U.S. Treasury note fell by more than 10 basis points to 4.948%, while the 2-year Treasury yield dropped by over 13 basis points to 4.647%. In short, capital fleeing the stock market sought a "safe haven"—and it found one in bonds.

Why is this surprising? Because, typically, the expectation of a Federal Reserve interest rate hike pushes bond yields higher. Indeed, the market still views a rate hike in December
BTC-0.67%
GT-2.41%
SOL-0.77%
IDOL-6.71%
4STOCK-3.94%
  • 2
  • 1
$IDOL No coincidences, only opportunities; the coin lives up to its name: 0.048 is just right, neither more nor less
post-image
IDOL-6.71%
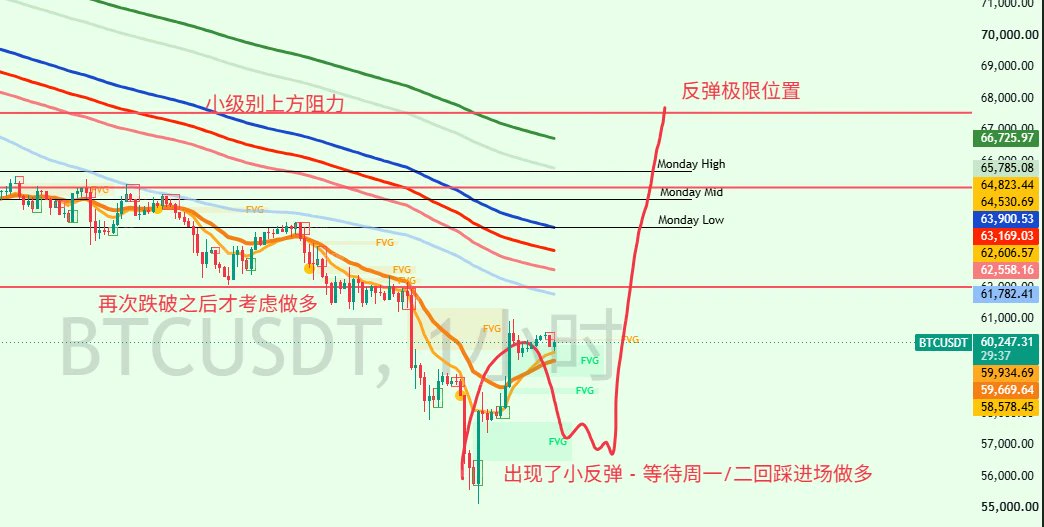
BTC Market Outlook
Wait for a Pullback to Go Long
After two weeks of waiting, we’re finally nearing a bottom, and the market has seen its first rebound of around 10%—though it was only 5,000 points, it’s still encouraging
Many believe BTC will continue falling below 48,000. I don’t rule out that possibility, but I also think the market will rebound next Monday or Tuesday. At the very least, “there’ll be a rebound to trade”
This rebound is in sync with the rebound I expect in U.S. stocks
After the VIX rose on Friday, I think U.S. stocks will continue falling until intraday Monday or before the
post-image
BTC-0.67%
  • 2
U haven't felt enough pain yet
Buckle up alt coiners
$btc
post-image
BTC-0.67%
At 5 a.m., this street healed me.
post-image
XRP Technical Outlook: Bearish Pressure Continues as Price Tests $0.93 Support

XRP is trading around $0.9364 after another strong bearish move on the daily chart. Price has broken below the previous support structure and is trading beneath all four major EMAs. Sellers remain in control, while the $0.8619 area is now an important support zone to watch.

EMA Structure

XRP is trading below all major moving averages, confirming a bearish market structure.

- 20 EMA: $1.0502
- 50 EMA: $1.1777
- 100 EMA: $1.2374
- 200 EMA: $1.3108

The 20 EMA remains below the 50, 100, and 200 EMAs. This alignment
XRP-1.12%
She doesn't know that I'm down 6 figures this month
post-image
Btc market prediction update
live-cover
LIVE1,550
BTC-0.67%
ETH-1.26%
SOL-0.77%
XRP-1.15%
#黄金逼近3500美元关口
Gold at $3,538: The $3,500 Support Battle Could Decide the Next Major Move

Gold is approaching a critical turning point after an aggressive selloff pushed prices toward $3,500. The latest available spot-market quote stands near $3,537.90 per ounce, following a session decline of approximately 2.38%. The metal traded as low as $3,502, bringing the market dangerously close to breaking an important psychological threshold.

What makes this decline particularly significant is that gold is experiencing selling pressure despite broader financial market uncertainty. This reflects a ma
XAU+0.38%
  • 1
  • 2
The Musk-themed Little Puppy emerged out of nowhere within a minute of Musk tweeting “l love you puppies”; its contract address ends in 6eb2, and it is listed on more than a dozen exchanges. Communities are actively building in over 50 countries. Worth accumulating at low levels
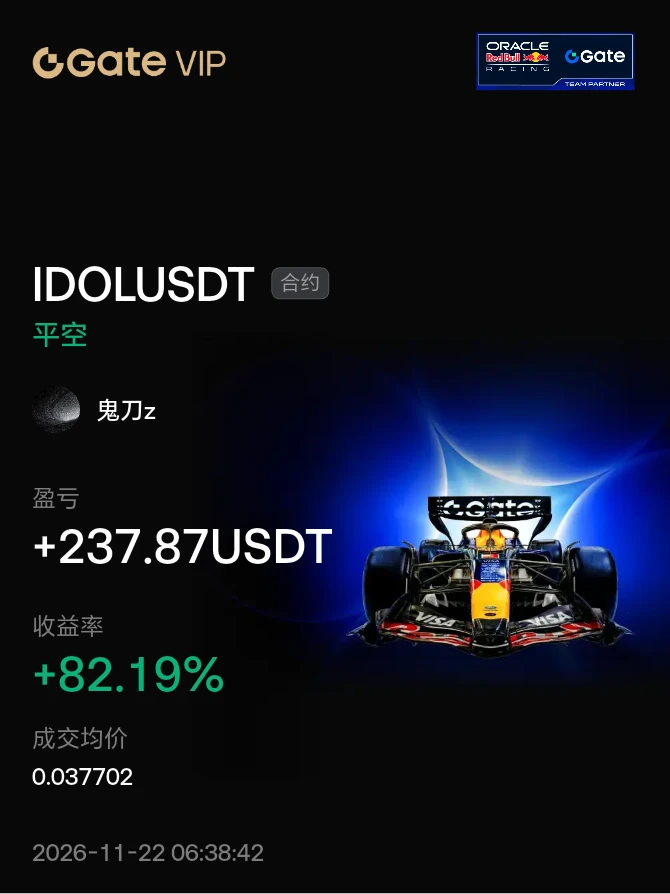
Parabolic blow-off top confirmed; the long squeeze has begun. It’s time to ride this downtrend all the way down. Join the shorts, contact $IDOL . Entry: 0.038756 - 0.039609 Target area: 0.035035 / 0.031717 Stop-loss: 0.042299 Note: Extreme volatility may trigger a stop-loss sweep and a rebound to 0.04100 before the final leg down. Don’t go all in, bro. Manage your position size based on your account.
post-image
IDOL-6.71%
Watching $BARD hold these moving averages so calmly, honestly, I'm getting a little impatient. It clearly has strong momentum, so why does it feel like it's just pacing in place instead of actually speeding up? Is everyone waiting for a specific signal, or are we just admiring the view here? TP: 0.100SL: 0.092
Market dynamics:
$VVV : Current price 25.152 - 24-hour gain: +20.49%
$ETH : Current price 1,682.61 - 24-hour gain: +3.96%
post-image
BARD-1.24%
VVV+0.37%
new stream Whale Adds $10.2 Million in Long Silver Positions, Becoming the Largest On-Chain Silver B
live-cover
LIVE1,327
BTC-0.67%
SOL-0.77%
ETH-1.26%
$INIT The long position reached TP3, and the price action looks good. After stabilizing in the 0.087 entry zone, it hit the target at 0.0929. Execution went smoothly. Not investment advice; manage your position size yourself. Current data · Latest price 0.0896600 · P&L +94.12 USDT · ROI +71.37%
post-image
INIT-2.53%
$DOGE Is Stronger Short-Term but Weak on the 4-Hour Chart—Which Will Turn First?
$DOGE is currently at 0.05517, up 1.174% over 24 hours, with an intraday range of 0.05077‑0.05569. The 1-hour chart looks relatively strong, with the price above EMA20 at 0.05475052. RSI14 is 78.74, nearing overbought territory, but the volume ratio is only 0.2, far below average, indicating limited participation from short-term buyers. A volume ratio of 0.2 means that trading volume over the past hour was only one-fifth of its recent average, making it difficult for buying pressure to persist. The 4-hour chart re
post-image
DOGE-0.22%
Driven by active trading volume, price action continues to edge higher; despite limited overall market participation, resistance remains intact. The uptrend is showing initial momentum, but the indicators have yet to fully align, suggesting the move may stall. $AKE — Long entry: 0.005343 Take-profit 1: 0.005401 Take-profit 2: 0.005450 Stop-loss: 0.005129
post-image
AKE+6.07%
#晒出我的合约收益
Take a small bite of IDOL
Seize the opportunity$ANT #IDOL
post-image
ANT-8.68%
  • 4
  • 1
Load More

Join 40 M users in our growing community

⚡️ Join 40 M users in the crypto craze discussion

💬 Engage with your favorite top creators

👍 See what interests you

Trending Topics

BTCBreaksBelow60K

2.1M Views30K Discussing

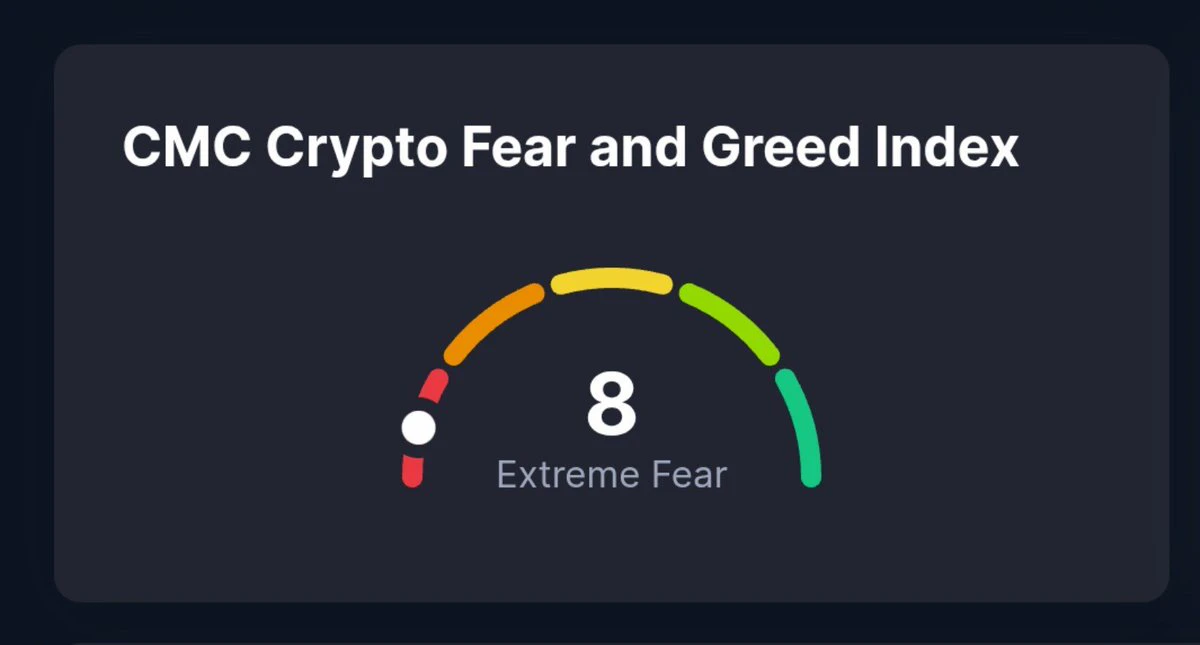
BTC fell below $60,000 on November 20 for the first time since July, alongside a tech stock selloff and broader pressure on risk assets. Will $60K become resistance, or can BTC quickly reclaim it? What price or volume signals would convince you that selling pressure is easing?

GateDirectIPOPhase3ANTAllocates92100Shares

797.2K Views4.9K Discussing

NvidiaDropsNearly14Percent

333.9K Views7.6K Discussing

View More